
动态地理背景下过度饮酒行为的时空特征及影响因素——以广州市中心城区为例
|
文隽永(1999— ),男,广东广州人,硕士生,主要研究方向为健康地理、城市规划。E-mail: wenjy9@163.com |
Copy editor: 黄光玉
收稿日期: 2023-10-19
修回日期: 2024-05-31
网络出版日期: 2024-07-24
基金资助
国家自然科学基金项目(42271234)
Spatiotemporal Characteristics of Excessive Drinking and its Influencing Factors in a Dynamic Geographic Context: A Case Study of Central Guangzhou, China
Received date: 2023-10-19
Revised date: 2024-05-31
Online published: 2024-07-24
Supported by
National Natural Science Foundation of China(42271234)
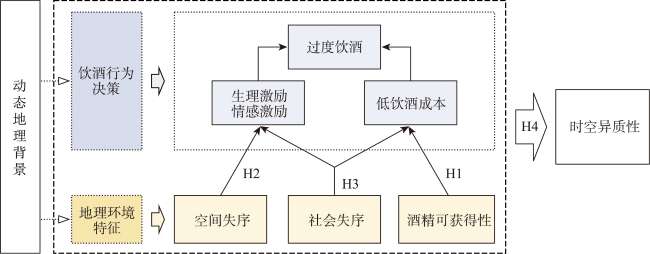
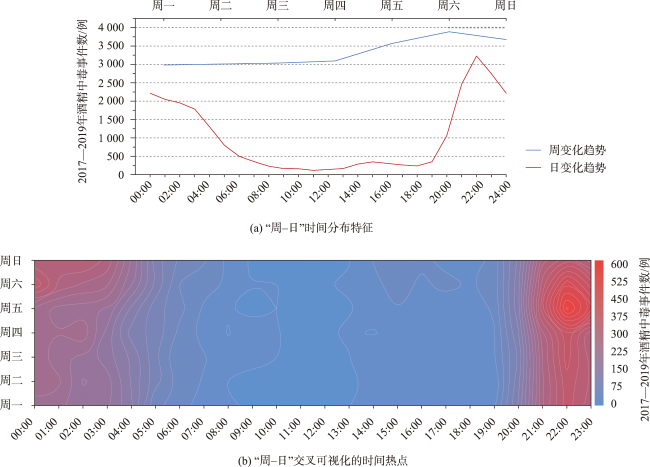
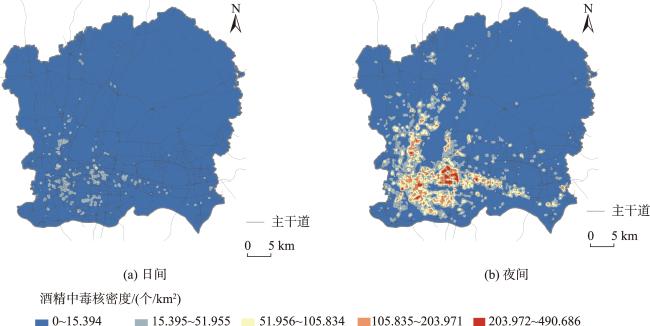
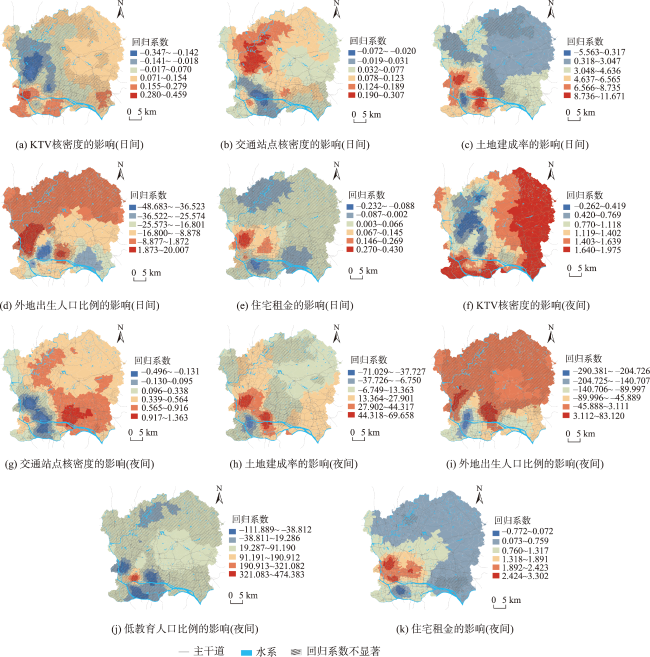
过度饮酒的危害是中国乃至全球面临的问题。本研究结合经典理论构建过度饮酒行为与地理环境关系的理论框架,使用广州市急救医疗指挥中心受理的公众急性酒精中毒呼叫记录、手机信令等多源时空数据,探究动态地理背景下过度饮酒行为的时空特征及影响因素。结果显示: ① 过度饮酒行为在时间上多发于周末和夜间,在空间上集中于城市商业中心;其空间分布在日间较为均衡,而在夜间较为集聚; ② 过度饮酒行为受酒精可获得性的影响,其与社区的KTV、交通站点密集度正相关。KTV的正向影响在日间主要体现在旧城区,在夜间体现在旧城区、近郊区和开发区,夜间的影响相对明显;交通站点的正向影响主要体现在近郊区,且在日间相对明显; ③ 过度饮酒行为也受部分空间失序因素的影响,其与所在社区的土地建成率正相关,但与建筑楼龄、街景脏乱度等关系不显著。土地建成率的正向影响主要体现在新城区的景观风貌核心地区以及城郊结合部的城中村社区,且在日间相对明显; ④ 过度饮酒行为与社会失序的关系较为复杂且时空分异性较强,其整体上与社区的外地出生人口比例负相关,与低教育人口比例和住宅租金正相关。⑤按照日间和夜间过度饮酒行为影响因素的聚类,分别划分不同的类型区,可针对这些类型区实施差异化的干预措施,以降低过度饮酒的危害。研究揭示了动态地理背景和较小空间尺度下过度饮酒行为与地理环境的关系,弥补了以往的相关研究对动态地理背景和时空异质性考虑不足、分析尺度较大等局限,相关结果能为酒精政策制定和完善、地区治安和卫生资源配置、城乡空间规划设计和相关健康问题的环境干预措施提供参考。

文隽永 , 周素红 , 李双明 . 动态地理背景下过度饮酒行为的时空特征及影响因素——以广州市中心城区为例[J]. 地球信息科学学报, 2024 , 26(8) : 1794 -1810 . DOI: 10.12082/dqxxkx.2024.230618
The harms of excessive drinking are important issues faced by China and other countries around the world. Previous studies have identified certain relationships between drinking behaviors and environmental factors, with limited consideration of the dynamic geographic context and spatiotemporal heterogeneity of these relationships. This study constructs a theoretical framework for the relationships between excessive drinking and geographical environment factors (i.e., alcohol availability, spatial disorder, and social disorder). Using multi-source spatiotemporal data, including the alcoholism cases received by Guangzhou Emergency Medical Command Center and mobile signaling data, the study explores the spatiotemporal patterns and the influencing factors of excessive drinking in a dynamic geographic context. Results show that: (1) Excessive drinking events mostly occur on weekends, at night, and in urban commercial centers. Its spatial distribution is balanced in the daytime but congregated in the nighttime; (2) Excessive drinking is influenced by alcohol availability (positively correlated with the density of KTVs and traffic stations). The positive impact of KTVs is prominent in the old urban area in the daytime and is prominent in more areas in the nighttime. The positive impact of traffic stations is mainly observed at the edge of central urban area and in suburban areas, and is relatively stronger in the daytime; (3) Excessive drinking is also affected by certain spatial disorder factors (positively correlated with the land development level), but has no significant relationship with building age and streetscape messiness. The positive impact of land development level is prominent in the new urban scenic core area and the urban villages at the urban-rural fringe, with a stronger impact in the daytime; (4) The relationship between excessive drinking and social disorder shows greater spatiotemporal differentiation and complexity. Overall, excessive drinking is negatively correlated with the proportion of nonlocal-born population, and positively correlated with the proportion of low-educated population and residential rent; (5) By analyzing different leading factors influencing excessive drinking in the daytime or nighttime, four types of spatial units can be identified, allowing for respective interventions in these zones to reduce the risk of excessive drinking. This study reveals the relationships between excessive drinking and geographical environment in a dynamic geographic context and at a smaller spatial scale, which fills the gap of lacking smaller-scale analysis, spatiotemporal heterogeneity perspective, and consideration of dynamic geographic context in previous studies. Our results provide insights for alcohol policy making, regional security and medical resource allocation, spatial planning, and environmental intervention related to health issues.
表1 分时段OLS、GWR模型名称Tab. 1 Names of the OLS and GWR models in different time periods |
| 模型类型 | 全时段模型 | 日间时段模型 | 夜间时段模型 |
|---|---|---|---|
| OLS模型 | 模型0、模型1 | 模型2 | 模型3 |
| GWR模型 | - | 模型2-1 | 模型3-1 |
表2 过度饮酒行为影响因素的回归模型变量Tab. 2 Variables of the models analyzing the influencing factors of excessive drinking |
| 变量类型 | 变量名称 | 数据来源 | 单位 | 最小值 | 最大值 | 平均值 | 标准差 | |
|---|---|---|---|---|---|---|---|---|
| 因变量 | 酒精中毒核密度Y | 酒精中毒数据 | 个/km2 | 0.000 | 463.901 | 61.278 | 56.997 | |
| 自变量 | 酒精可 获得性 | 餐厅核密度X1 | 路网和POI数据 | 个/km2 | 0.000 | 1477.674 | 87.006 | 130.425 |
| 酒吧核密度X2 | 路网和POI数据 | 个/km2 | 0.000 | 168.357 | 4.374 | 11.280 | ||
| KTV核密度X3 | 路网和POI数据 | 个/km2 | 0.000 | 53.367 | 2.513 | 4.748 | ||
| 烟酒副食店铺核密度X4 | 路网和POI数据 | 个/km2 | 0.000 | 420.154 | 32.578 | 42.516 | ||
| 路网密度X5 | 路网和POI数据 | km/km2 | 0.000 | 68.746 | 23.644 | 11.563 | ||
| 交通站点核密度X6 | 路网和POI数据 | 个/km2 | 0.000 | 97.662 | 14.774 | 14.458 | ||
| 空间 失序 | 建筑平均楼龄X7 | “七普”数据 | 年 | 0.000 | 62.820 | 22.719 | 9.156 | |
| 街景脏乱感X8 | 王林森等[35] | - | 0.492 | 0.842 | 0.710 | 0.056 | ||
| 土地建成率X9 | 土地覆被数据 | % | 0.214 | 100.000 | 79.125 | 28.311 | ||
| 社会 失序 | 外地出生人口比例X10 | 手机信令数据 | % | 52.410 | 98.085 | 80.347 | 11.160 | |
| 低教育人口比例X11 | “七普”数据 | % | 0.507 | 49.875 | 17.194 | 5.274 | ||
| 平均富裕指数X12 | 手机信令数据 | - | 3.091 | 4.125 | 3.720 | 0.124 | ||
| 住宅租金X13 | 住宅租金数据 | 元/m2·月 | 7.115 | 89.675 | 35.471 | 13.945 | ||
| 保障性住房比例X14 | “七普”数据 | % | 0.000 | 100.000 | 6.657 | 13.972 | ||
| 控制变量 | 社区人口X15 | 手机信令数据 | 千人 | 0.031 | 155.927 | 8.979 | 10.757 | |
| 社区人口密度X16 | 手机信令数据 | 人/m2 | 0.000 | 0.202 | 0.028 | 0.023 | ||
| 19~34岁人口比例X17 | 手机信令数据 | % | 11.506 | 69.658 | 47.234 | 7.066 | ||
| 35~59岁人口比例X18 | 手机信令数据 | % | 12.779 | 49.356 | 32.900 | 5.108 | ||
| 60岁及以上人口比例X19 | 手机信令数据 | % | 0.386 | 16.378 | 5.200 | 3.046 | ||
| 性别比X20 | 手机信令数据 | - | 0.996 | 12.856 | 1.877 | 0.729 | ||
| 温度X21 | 体感温度数据 | ℃ | 20.550 | 24.557 | 23.439 | 0.537 |
注:表中的描述统计指标基于模型1的变量值。 |
表3 回归模型信息Tab. 3 Information of the regression models |
| 参数 | 全天模型 | 日间模型 | 夜间模型 | |||||
|---|---|---|---|---|---|---|---|---|
| 模型0 (OLS) | 模型1 (OLS) | 模型2 (OLS) | 模型2-1 (GWR) | 模型3 (OLS) | 模型3-1 (GWR) | |||
| F | 88.910*** | 117.520*** | 70.022*** | - | 113.039*** | - | ||
| R2 | 0.566 | 0.633 | 0.506 | 0.633 | 0.624 | 0.773 | ||
| Adj R2 | 0.560 | 0.627 | 0.499 | 0.603 | 0.618 | 0.748 | ||
| AICc | 15 935.064 | 14 482.934 | 9 191.441 | 8 879.119 | 14 142.846 | 13 583.715 | ||
注:***表示P < 0.001,**表示P< 0.01,*表示P< 0.05。 |
表4 过度饮酒行为影响因素的OLS模型分析结果Tab. 4 Outcomes of OLS models analyzing the influencing factors of excessive drinking |
| 影响因素 | 未标准化系数 | 标准化系数 | VIF | |||||||||||||
|---|---|---|---|---|---|---|---|---|---|---|---|---|---|---|---|---|
| 模型1(全天) | 模型2(日间) | 模型3(夜间) | 模型1 | 模型2 | 模型3 | 模型1 | 模型2 | 模型3 | ||||||||
| 系数 | 标准误 | 系数 | 标准误 | 系数 | 标准误 | |||||||||||
| 常量 | -26.998 | 71.293 | -14.003 | 11.443 | -26.001 | 62.038 | - | - | - | - | - | - | ||||
| 自变量 | ||||||||||||||||
| 酒精可获得性 | ||||||||||||||||
| 餐厅核密度X1 | -0.011 | 0.016 | -0.003 | 0.003 | 0.000 | 0.014 | -0.025 | -0.045 | 0.001 | 5.462 | 5.522 | 5.383 | ||||
| 酒吧核密度X2 | 0.052 | 0.108 | -0.025 | 0.018 | 0.063 | 0.096 | 0.010 | -0.036 | 0.014 | 1.773 | 1.778 | 1.767 | ||||
| KTV核密度X3 | 1.888*** | 0.307 | 0.192*** | 0.050 | 1.565*** | 0.272 | 0.157*** | 0.114*** | 0.148*** | 2.554 | 2.574 | 2.531 | ||||
| 烟酒副食店铺核密度X4 | 0.030 | 0.035 | 0.004 | 0.006 | 0.033 | 0.031 | 0.022 | 0.024 | 0.028 | 2.720 | 2.721 | 2.718 | ||||
| 路网密度X5 | 0.172 | 0.125 | 0.003 | 0.020 | 0.196 | 0.111 | 0.035 | 0.004 | 0.045 | 2.496 | 2.496 | 2.493 | ||||
| 交通站点核密度X6 | 0.207* | 0.098 | 0.040* | 0.016 | 0.218* | 0.087 | 0.053* | 0.073* | 0.063* | 2.433 | 2.443 | 2.420 | ||||
| 空间失序 | ||||||||||||||||
| 住户平均楼龄X7 | 0.046 | 0.129 | 0.022 | 0.021 | 0.138 | 0.116 | 0.007 | 0.025 | 0.025 | 1.677 | 1.664 | 1.709 | ||||
| 街景脏乱度X8 | 5.245 | 24.321 | 4.490 | 3.940 | -2.704 | 21.624 | 0.005 | 0.032 | -0.003 | 2.252 | 2.244 | 2.249 | ||||
| 土地建成率X9 | 14.900* | 7.053 | 2.514* | 1.140 | 12.865* | 6.269 | 0.074* | 0.089* | 0.073* | 4.788 | 4.752 | 4.778 | ||||
| 社会失序 | ||||||||||||||||
| 外地出生人口比例X10 | -111.013*** | 20.965 | -8.615* | 3.463 | -85.310*** | 17.655 | -0.217*** | -0.116* | -0.198*** | 6.573 | 6.286 | 6.403 | ||||
| 低教育人口比例X11 | 43.731* | 22.472 | 5.009 | 3.614 | 42.667* | 20.122 | 0.040* | 0.033 | 0.045* | 1.687 | 1.657 | 1.708 | ||||
| 平均富裕指数X12 | 15.215 | 10.155 | 0.939 | 1.582 | 14.395 | 8.879 | 0.033 | 0.015 | 0.035 | 1.897 | 1.931 | 1.821 | ||||
| 住宅租金X13 | 0.821*** | 0.111 | 0.044* | 0.018 | 0.850*** | 0.098 | 0.201*** | 0.077* | 0.237*** | 2.880 | 2.850 | 2.821 | ||||
| 保障性住房比例X14 | -12.428 | 6.789 | -0.088 | 1.101 | -10.449 | 6.046 | -0.030 | -0.002 | -0.029 | 1.080 | 1.078 | 1.082 | ||||
| 控制变量 | ||||||||||||||||
| 社区人口X15 | -0.241* | 0.099 | -0.021 | 0.015 | -0.233* | 0.094 | -0.045* | -0.030 | -0.047* | 1.352 | 1.333 | 1.380 | ||||
| 社区人口密度X16 | 1106.336*** | 64.972 | 144.607*** | 10.085 | 927.902*** | 58.443 | 0.437*** | 0.435*** | 0.397*** | 2.570 | 2.674 | 2.382 | ||||
| 19~34岁人口比例X17 | 73.857** | 24.261 | 10.938** | 4.132 | 44.274* | 20.125 | 0.092** | 0.095** | 0.065* | 3.529 | 3.742 | 3.317 | ||||
| 35~59岁人口比例X18 | -65.236* | 26.249 | -3.454 | 4.406 | -67.824** | 22.045 | -0.058* | -0.022 | -0.072** | 2.159 | 2.209 | 2.109 | ||||
| 60岁以上人口比例X19 | -115.631 | 89.830 | 19.714 | 13.898 | -148.317 | 80.544 | -0.062 | 0.077 | -0.089 | 8.991 | 8.542 | 8.859 | ||||
| 性别比X20 | 0.828 | 1.822 | 0.273 | 0.291 | 0.860 | 1.452 | 0.011 | 0.026 | 0.013 | 2.119 | 2.179 | 1.834 | ||||
| 温度X21 | 0.781 | 2.189 | 0.289 | 0.354 | 0.716 | 1.945 | 0.007 | 0.019 | 0.008 | 1.657 | 1.650 | 1.653 | ||||
注:***表示P < 0.001,**表示P< 0.01,*表示P< 0.05。 |
表5 GWR模型输出的DIFF值Tab. 5 DIFFs from GWR outcomes |
| 模型2-1(日间) | 模型3-1(夜间) | |||
|---|---|---|---|---|
| 变量名称 | DIFF | 变量名称 | DIFF | |
| KTV核密度 | -18.552* | KTV核密度 | -5.088* | |
| 交通站点核密度 | -29.272* | 交通站点核密度 | -41.440* | |
| 土地建成率 | 3.035 | 土地建成率 | -91.376* | |
| 外地出生人口比例 | -35.254* | 外地出生人口比例 | -353.258* | |
| 住宅租金 | -26.785* | 低教育人口比例 | -5.752* | |
| 社区人口密度 | -39.028* | 住宅租金 | -279.599* | |
| 19~34岁人口比例 | -282.822* | 社区人口 | -3.069* | |
| 社区人口密度 | -99.401* | |||
| 19~34岁人口比例 | -952.207* | |||
| 35~59岁人口比例 | -332.048* | |||
注:*表示DIFF<0。 |
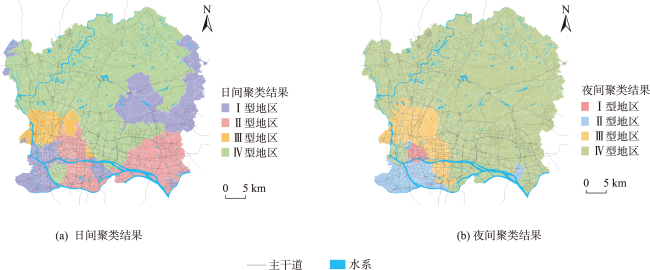
图6 影响过度饮酒行为的主导因素聚类结果Fig. 6 Clustering results of the leading factors affecting excessive drinking |
表6 过度饮酒行为主导因素分类与相应政策导则Tab. 6 Classification of leading factors affecting excessive drinking and related policy guidelines |
| 划分地区类型 | 主要覆盖地区 | 过度饮酒主导影响因素 | 政策导则 |
|---|---|---|---|
| 日间时段 | |||
| Ⅰ型 | 旧城区、 部分近郊区 | KTV核密度(+),外地出生人口比例(-) | 加强KTV集聚地区的相关治安资源、医疗资源配置;增加对本地居民聚居的社区的宣传教育 |
| Ⅱ型 | 新城核心区、 开发区 | 土地建成率(+),住宅租金(+),外地出生人口比例(-) | 对租金较高和本地居民聚居的社区进行宣传教育;增设社区口袋公园,优化步行环境;规范化酒精消费场所 |
| Ⅲ型 | 城郊结合区 | 交通站点核密度(+),土地建成率(+),外地出生人口比例(+),住宅租金(+) | 加强交通站点、外来人口聚居区周围的相关治安资源、医疗资源配置;实施工业外迁;推动更新改造和环境美化,增设社区口袋公园;对酒精广告加以管控 |
| Ⅳ型 | 旧城工业区、 新城边缘区、 近郊区 | 交通站点核密度(+) | 加强交通站点周围的相关治安资源、医疗资源配置 |
| 夜间时段 | |||
| Ⅰ型 | 旧城商业区 | KTV核密度(+),低教育人口比例(+),住宅租金(+),土地建成率(-),外地出生人口比例(-) | 加强KTV集聚地区的相关治安资源、医疗资源配置;增加对人群受教育水平低和本地居民聚居的社区的宣传教育;规范化酒精消费场所 |
| Ⅱ型 | 旧城工业区 | KTV核密度(+),外地出生人口比例(-) | 加强KTV集聚地区的相关治安资源、医疗资源配置;对旧厂单位大院等本地居民聚居社区进行宣传教育 |
| Ⅲ型 | 城郊结合区、 新城核心区 | 土地建成率(+),住宅租金(+) | 增设社区口袋公园,优化步行环境;规范化酒精消费场所;加强租金较高社区附近的相关治安资源、医疗资源配置 |
| Ⅳ型 | 旧城生活区、 近郊区 | 交通站点核密度(+) | 加强交通站点周围的相关治安资源、医疗资源配置 |
注:“+”表示正相关,“-”表示负相关。 |
| [1] |
|
| [2] |
|
| [3] |
|
| [4] |
向小军, 李荣国, 王绪轶, 等. 508名急诊患者外伤与饮酒的相关性[J]. 中国临床心理学杂志, 2014, 22(2):285-287.
[
|
| [5] |
向小军, 王绪轶, 汤宜朗, 等. 我国酒精相关危害的现状与策略[J]. 中国药物滥用防治杂志, 2015, 21(6):368-372.
[
|
| [6] |
|
| [7] |
World Health Organization. Alcohol, recorded per capita (15+) consumption (in litres of pure alcohol)[EB/OL]. (2024-4-25)[2024-04-25]. https://www.who.int/data/gho/data/indicators/indicator-details/GHO/alcohol-recorded-per-capita-(15-)-consumption-(in-litres-of-pure-alcohol).
|
| [8] |
|
| [9] |
|
| [10] |
|
| [11] |
|
| [12] |
王少华, 陈艳艳, 黄建玲, 等. 酒精可获得性对酒驾交通事故的空间效应[J]. 北京工业大学学报, 2019, 45(9):886-894.
[
|
| [13] |
|
| [14] |
|
| [15] |
|
| [16] |
|
| [17] |
|
| [18] |
|
| [19] |
|
| [20] |
|
| [21] |
|
| [22] |
|
| [23] |
|
| [24] |
|
| [25] |
陈婧佳, 张昭希, 龙瀛. 促进公共健康为导向的街道空间品质提升策略——来自空间失序的视角[J]. 城市规划, 2020, 44(9):35-47.
[
|
| [26] |
李志刚, 程晗蓓. 流动时代的城市环境暴露与移民健康——基于社会空间效应视角[J]. 上海城市规划, 2023(3):15-21.
[
|
| [27] |
|
| [28] |
|
| [29] |
|
| [30] |
柳林, 吴林琳, 宋广文, 等. 基于时空行为视角的犯罪地理创新研究框架[J]. 地理研究, 2022, 41(6):1748-1764.
[
|
| [31] |
贺力, 陈晨, 王忠民, 等. 城市微环境与盗窃犯罪关系研究进展[J]. 地理研究, 2022, 41(11):2912-2931.
[
|
| [32] |
周素红, 张琳, 林荣平. 地理环境暴露与公众健康研究进展[J]. 科技导报, 2020, 38(7):43-52.
[
|
| [33] |
广州市统计局. 2022广州统计年鉴[EB/OL].(2022-11-24)[2024-04-25]. http://tjj.gz.gov.cn/stats_newtjyw/zyxz/tjnjdzzz/content/post_8677056.html.
[Guangzhou Statistics Bureau. 2022 Guangzhou statistical yearbook[EB/OL]. (2022-11-24)[2024-04-25]. http://tjj.gz.gov.cn/stats_newtjyw/zyxz/tjnjdzzz/content/post_8677056.html.]
|
| [34] |
广州市住房和城乡建设局. 2020年广州市房屋租金参考价[EB/OL].(2021-02-19)[2024-04-25]. http://zfcj.gz.gov.cn/zwgk/zsdwxxgkzl/gzsfwjyjgzx/zjckj/content/post_7098715.html.
[Guangzhou Municipal Housing and Urban-rural Development Bureau. Reference price of housing rent in Guangzhou in 2020[EB/OL]. (2021-02-19)[2024-04-25]. http://zfcj.gz.gov.cn/zwgk/zsdwxxgkzl/gzsfwjyjgzx/zjckj/content/post_7098715.html.]
|
| [35] |
王林森, 郑重, 周素红, 等. 基于街景感知的城市空间品质对空间活力的影响作用研究[J]. 规划师, 2022, 38(3):68-75.
[
|
| [36] |
|
| [37] |
|
| [38] |
|
| [39] |
塔娜, 柴彦威, 关美宝. 建成环境对北京市郊区居民工作日汽车出行的影响[J]. 地理学报, 2015, 70(10):1675-1685.
[
|
| [40] |
|
| [41] |
周素红, 谢蔚翰, 宋广文, 等. 土地利用对街头抢劫影响的空间分异模式:以H市为例[J]. 地理科学, 2017, 37(6):885-894.
[
|
| [42] |
|
| [43] |
禹文豪, 艾廷华. 核密度估计法支持下的网络空间POI点可视化与分析[J]. 测绘学报, 2015, 44(1):82-90.
[
|
| [44] |
|
| [45] |
王洋, 张虹鸥, 黄耿志, 等. 城市住房与社会空间的对应关系及区位差异性[J]. 建筑经济, 2017, 38(8):100-104.
[
|
| [46] |
马凌, 罗加威, 李锦昊. 空间流动与社会流动关系研究述评[J]. 人文地理, 2023, 38(6):1-7.
[
|
| [47] |
高杨, 王朝辉, 乔浩浩, 等. 上海市旅游住宿业房价空间分异规律及其影响因素[J]. 地理科学, 2022, 42(8):1391-1401.
[
|
| [48] |
周素红, 程璐萍, 吴志东. 广州市保障性住房社区居民的居住-就业选择与空间匹配性[J]. 地理研究, 2010, 29(10):1735-1745.
[
|
| [49] |
|
| [50] |
周春山, 胡锦灿, 童新梅, 等. 广州市社会空间结构演变跟踪研究[J]. 地理学报, 2016, 71(6):1010-1024.
[
|
| [51] |
|
| [52] |
|
| [53] |
戚伟, 刘盛和, 赵美风. 中国城市流动人口及市民化压力分布格局研究[J]. 经济地理, 2016, 36(5):55-62.
[
|
| [54] |
|
| [55] |
|
| [56] |
古杰, 周素红, 闫小培, 等. 居民日常出行时空集聚视角下的城市交通拥堵形成机制研究——以广州为例[J]. 地理科学, 2012, 32(8):921-927.
[
|
| [57] |
李方正, 戴超兰, 姚朋. 北京市中心城社区公园使用时空差异及成因分析——基于58个公园的实证研究[J]. 北京林业大学学报, 2017, 39(9):91-101.
[
|
| [58] |
魏立华, 丛艳国, 李志刚, 等. 20世纪90年代广州市从业人员的社会空间分异[J]. 地理学报, 2007, 62(4):407-417.
[
|
| [59] |
|
| [60] |
|
| [61] |
陈意飞, 郭明, 董世童, 等. 急性酒精中毒风险防范的现状与思考[J]. 中华卫生应急电子杂志, 2019, 5(1):36-37.
[
|
| [62] |
杨春, 谭少华, 李梅梅, 等. 健康城市主动式规划干预途径研究[J]. 城市规划, 2022, 46(11):61-76.
[
|
/
| 〈 |
|
〉 |