
基于原始探测光子泊松分布特性的直方图去噪算法研究
|
李 军(1999— ),男,四川泸州人,硕士生,主要从事卫星激光测高方面的研究。E-mail: 2452481248@qq.com |
Copy editor: 蒋树芳 , 黄光玉
收稿日期: 2024-04-12
修回日期: 2024-06-05
网络出版日期: 2024-07-24
基金资助
国家重点研发计划项目(2020YFC1512000)
国家自然科学基金项目(42074041)
地理信息工程国家重点实验室基金项目(SKLGIE2022-ZZ2-07)
Research on a Histogram Denoising Algorithm Based on Poisson Distribution Characteristics of Original Detected Photons
Received date: 2024-04-12
Revised date: 2024-06-05
Online published: 2024-07-24
Supported by
National Key Research and Development Program of China(2020YFC1512000)
National Natural Science Foundation of China Projects(42074041)
State Key Laboratory of Geo-information Engineering(SKLGIE2022-ZZ2-07)
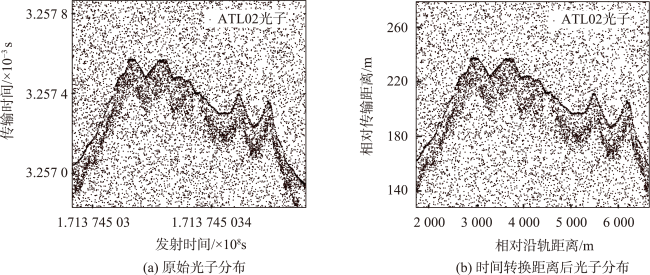
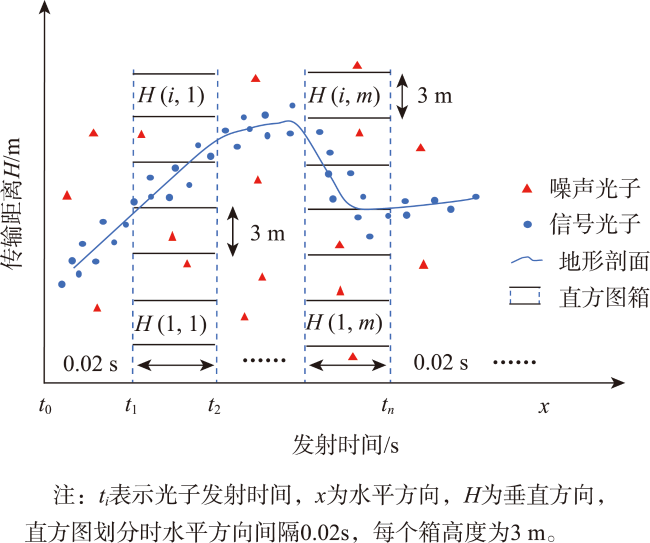
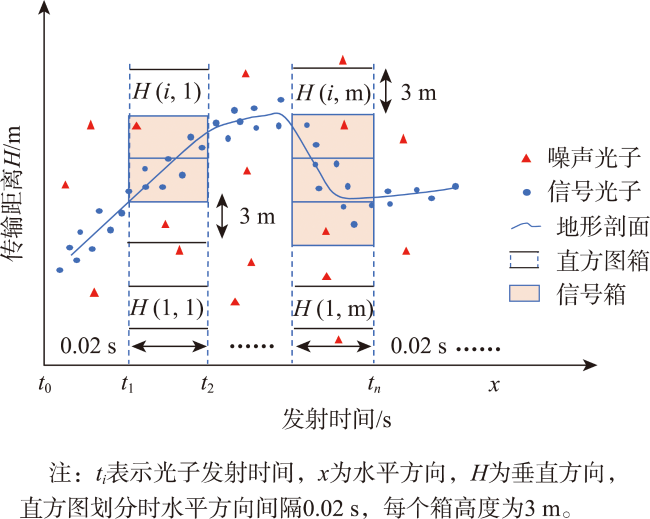
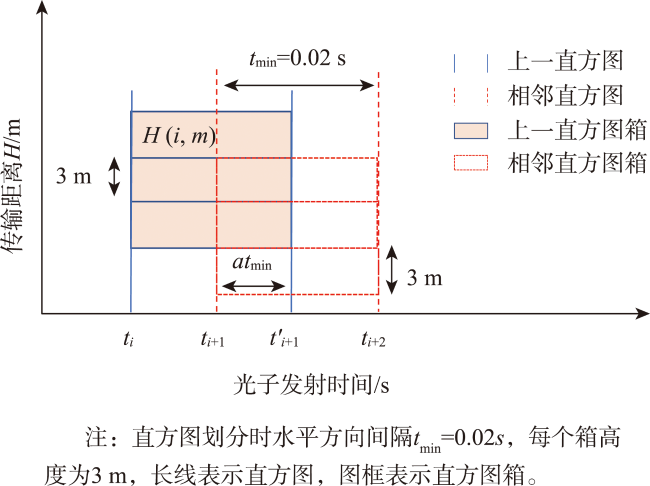
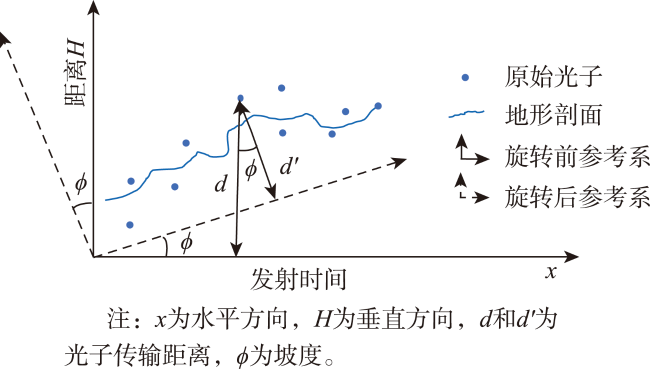
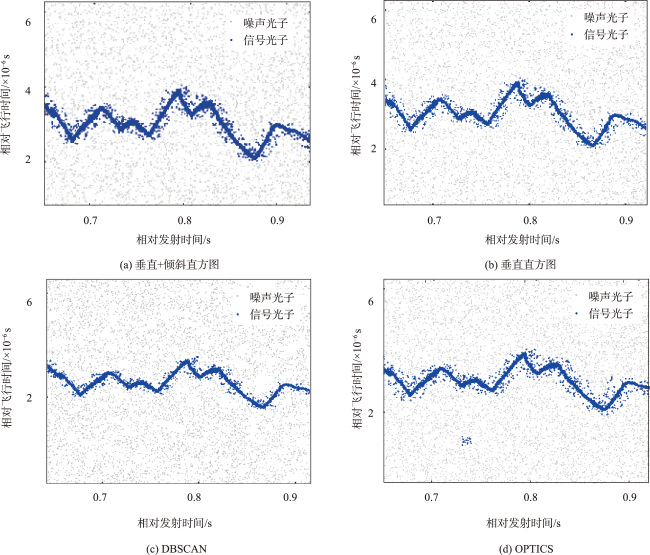
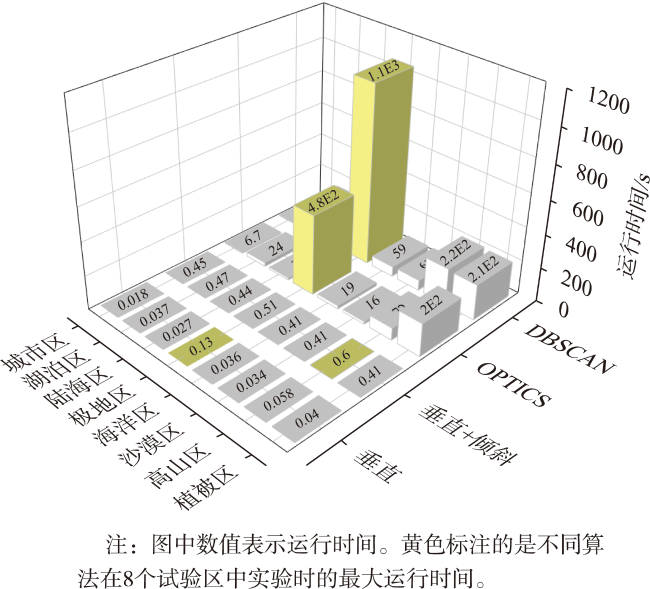
ICESat-2作为新一代多波束激光测高卫星采用了光子计数体制,其探测数据中存在大量噪声,造成光子数据在轨处理和传输时面临巨大挑战。为了在轨高效地对原始探测数据进行去噪处理,以降低星地传输数据量,本文设计了一种基于原始探测光子泊松分布特性的直方图去噪算法。该算法分为光子点云的垂直直方图化和倾斜直方图化。首先,根据光子传输距离将点云数据段划分为二维格网形成垂直直方图,利用直方图箱光子数的均值和标准差计算信噪分离阈值,并对信号光子赋予低、中和高置信度标签来表征信号可靠性;其次,对识别的中、高置信度光子进行线性拟合获取坡度信息,将光子传输距离投影到沿坡面垂直的方向形成倾斜直方图,进行二次信号光子识别且合并置信度标签;最后,对噪声光子进行剔除以实现原始数据的压缩下传。同时,本文对比研究了基于密度的空间聚类应用(Density-Based Spatial Clustering of Applications with Noise, DBSCAN)算法和对点排序以识别聚类结构(Ordering Points to Identify the Clustering Structure, OPTICS)算法性能。通过8种地类的ATL02数据开展测试实验,结果表明,DBSCAN算法会导致信号光子丢失,而OPTICS算法会产生虚假信号簇,相比之下,直方图算法有效避免了这些问题的产生,并且在实验中对不同地类具有较好的稳健性和适应性。在直方图算法中,垂直直方图算法对信号光子召回率R均为1,查准率P和调和F值平均在0.90以上,相较于垂直+倾斜直方图、DBSCAN和OPTICS的运行效率分别达到12倍、3 473倍和1 528倍以上,平均运行时间仅0.048 s,可高效实现数据去噪。垂直直方图算法去噪结果初步满足在轨处理效率要求(<0.25 s),本文有望为未来星载光子计数激光雷达数据的在轨去噪提供技术参考。

李军 , 张双成 , 师勇 , 王涛 , 王铭辉 , 王杰 . 基于原始探测光子泊松分布特性的直方图去噪算法研究[J]. 地球信息科学学报, 2024 , 26(8) : 1911 -1925 . DOI: 10.12082/dqxxkx.2024.240205
ICESat-2, a new-generation satellite for spaceborne lidar altimetry, adopts a multi-beam single-photon counting regime. The presence of a large number of noisy photons in its detection data is well known, and the large amount of photonic data poses a challenge to data transmission and processing due to the limited processor performance and satellite storage resources on board the satellite. Therefore, in order to efficiently denoise the raw detection data in orbit and reduce the data volume for transmission from space to ground, this study proposes a histogram denoising algorithm based on the Poisson distribution characteristics of the raw detection photons. The method includes creating vertical and skewed histograms of the photon point cloud. Firstly, the point cloud data segment is divided into a two-dimensional grid to form a vertical histogram based on the photon transmission distance. The thresholds for distinguishing signal and noise photons are calculated from the mean and standard deviation of the number of photons in the histogram box, and signal photons are assigned with low, medium, and high confidence labels to characterize signal reliability. This is the process of vertical histogramming. Secondly, the slope information is obtained by linearly fitting the medium- and high-confidence photons from the first step. The photon transmission distance is projected to the vertical direction along the slope to form a tilted histogram, and the signal is recognized twice, and the confidence labels are merged. Finally, the noise is eliminated to achieve the purpose of compressing the original data for downlinking. This study also compares the Density-Based Spatial Clustering of Applications with Noise (DBSCAN) algorithm and Ordering Points to Identify the Clustering Structure (OPTICS) algorithm to evaluate the performance of the histogram denoising algorithm. Experiments were conducted using ATL02 data for eight surface types. The results show that DBSCAN and OPTICS are not suitable for data denoising in urban areas, with F-values of 0.766 and 0.765, respectively. In contrast, the histogram algorithm is robust and adaptable to different landform types, with F-values of more than 0.90 in all the experimental areas. The DBSCAN algorithm results in the loss of signal photons, while the OPTICS algorithm produces spurious signal clusters. In contrast, these problems are effectively avoided due to the inclusion of signal rate constraints and horizontal to overlapping division histogram processing techniques in the histogram algorithm. Among the histogram algorithms, the vertical histogram algorithm achieves a signal photon recall (R) of 1, and the average precision (P) and F-value are more than 0.90. This improves the operation efficiency by 12 times, 3473 times, and 1528 times compared with the vertical/skewed histogram, DBSCAN, and OPTICS algorithms, respectively. In addition, the average operation time of the vertical histogram algorithm is only 0.048 seconds, realizing efficient data denoising and compression. The denoising result of the vertical histogram algorithm initially meets the requirement of on-orbit processing efficiency (<0.25 seconds). This study can provide a technical reference for future on-orbit denoising of spaceborne photon-counting LiDAR data.
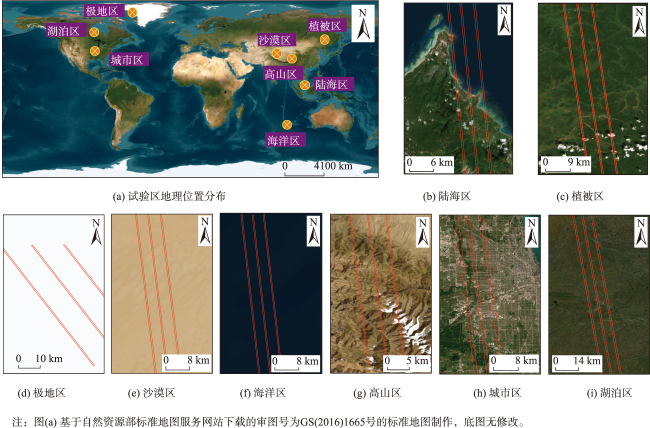
图8 试验区地理位置分布与ICESat-2星下点轨迹图Fig. 8 Geographic distribution of the test area selected in this paper with ICESat-2 down point trajectory map |
表1 各实验区数据详细信息统计Tab. 1 Detailed statistics on the data of each experimental area |
| 地表类型 | 数据编号 | 地理位置 | 地理特征 | 采集时间 | 纬度范围/(°) |
|---|---|---|---|---|---|
| 植被区 | Data1 | 大兴安岭 | 地形平坦,地表植被茂密 | 2022-01-09 | 50.55°N—50.60°N |
| 高山区 | Data2 | 祁连山脉 | 地形起伏大,地表以裸地,冰雪和稀疏植被为主 | 2023-06-07 | 39.30°N—39.64°N |
| 沙漠区 | Data3 | 塔克拉马干沙漠 | 植被稀缺,地表以沙石为主 | 2019-05-02 | 40.00°N—40.50°N |
| 海洋区 | Data4 | 印度洋 | 海面波涛起伏 | 2023-06-06 | -30.30°S—-29.80°S |
| 极地区 | Data5 | 格陵兰岛 | 地形较为平坦,地表光滑,以冰盖和积雪为主 | 2020-06-09 | 78.50°N—79.50°N |
| 陆海区 | Data6 | 南海 | 海面平坦,陆地地形起伏大,海陆交界处地形变化大 | 2021-06-29 | 3.90°N—4.30°N |
| 湖泊区 | Data7 | 哈德森湾 | 湖面平整,水深较浅 | 2020-08-10 | 56.00°N—57.15°N |
| 城市区 | Data8 | 芝加哥 | 建筑物高,分布密集 | 2021-07-27 | 41.10°N—42.10°N |
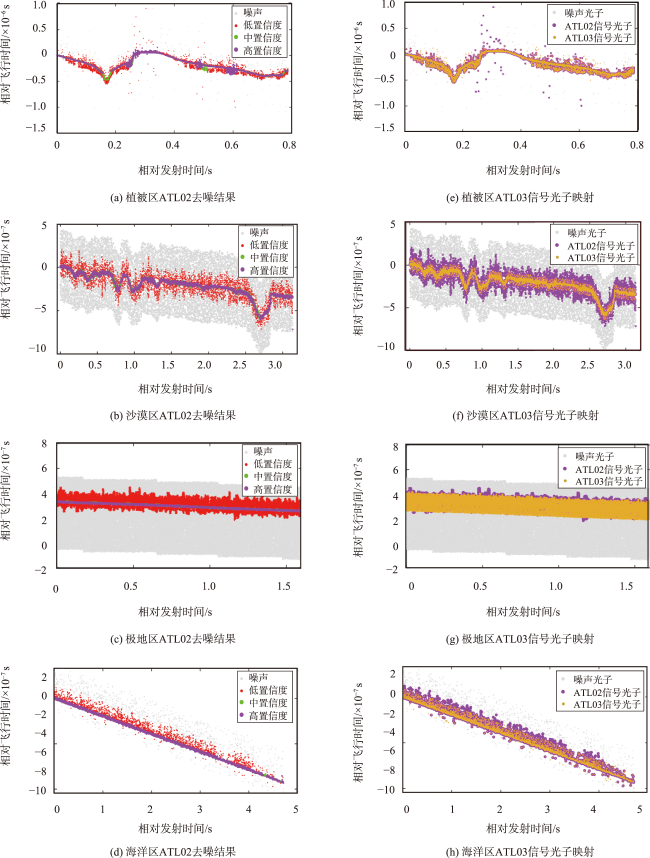
表2 基于ATL03数据对实验区各纬度范围内信号光子信息统计结果Tab. 2 Statistical results of signal photon information for each latitude range in the experimental area based on ATL03 data |
| 试验区 | 光子总数/个 | 中置信度光子/个 | 高置信度光子/个 | 人工标识/个 | 信号光子/个 | 信噪比/dB |
|---|---|---|---|---|---|---|
| 植被区 | 52 366 | 113 | 52 103 | -719 | 51 497 | 59.26 |
| 高山区 | 328 427 | 58 346 | 52 968 | 35 397 | 146 711 | 0.81 |
| 沙漠区 | 204 257 | 38 146 | 122 313 | 2 806 | 163 265 | 3.98 |
| 海洋区 | 145 635 | 227 | 140 362 | -1 446 | 139 143 | 21.42 |
| 极地区 | 462 007 | 11 789 | 249 966 | 3 004 | 264 759 | 1.34 |
| 陆海区 | 149 853 | 1 006 | 146 545 | -2 754 | 144 797 | 28.64 |
| 湖泊区 | 33 327 | 157 | 32 940 | -169 | 32 928 | 82.53 |
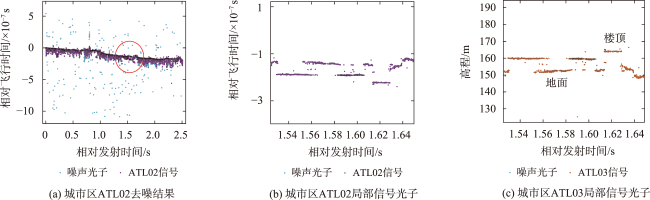
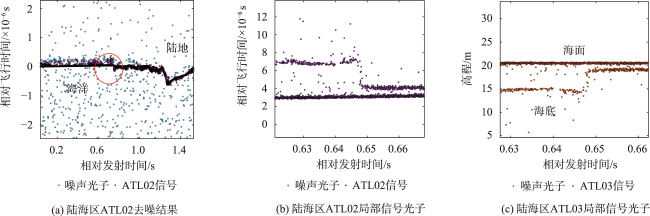
图10 基于直方图算法的城市区ATL02光子数据去噪结果与ATL03结果对比Fig. 10 Comparison of denoising results of ATL02 photon data with ATL03 results in urban areas based on histogram algorithm |
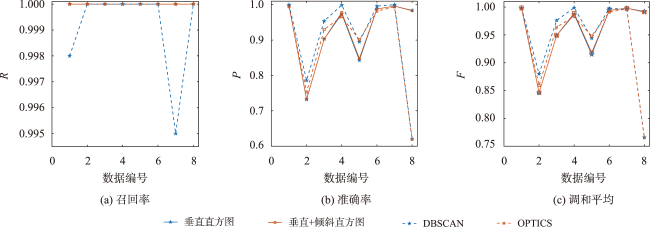
表3 基于不同算法的实验区ATL02光子数据去噪结果评估指标统计比较Tab. 3 Statistical comparison of assessment metrics for algorithmic denoising results of ATL02 photon data in experimental areas based on different algorithms |
| 实验区 | 垂直直方图 | 垂直+倾斜直方图 | DBSCAN | OPTICS | ||||||||||||
|---|---|---|---|---|---|---|---|---|---|---|---|---|---|---|---|---|
| R | P | F | R | P | F | R | P | F | R | P | F | |||||
| 植被区 | 1.000 | 0.915 | 0.956 | 1.000 | 0.916 | 0.956 | 0.998 | 1.000 | 0.999 | 1.000 | 0.994 | 0.997 | ||||
| 高山区 | 1.000 | 0.832 | 0.908 | 1.000 | 0.850 | 0.919 | 1.000 | 0.786 | 0.880 | 1.000 | 0.753 | 0.859 | ||||
| 沙漠区 | 1.000 | 0.906 | 0.951 | 1.000 | 0.896 | 0.945 | 1.000 | 0.954 | 0.976 | 1.000 | 0.930 | 0.964 | ||||
| 海洋区 | 1.000 | 0.975 | 0.987 | 1.000 | 0.975 | 0.987 | 1.000 | 0.999 | 0.999 | 1.000 | 0.966 | 0.983 | ||||
| 极地区 | 1.000 | 0.820 | 0.901 | 1.000 | 0.805 | 0.892 | 1.000 | 0.895 | 0.944 | 1.000 | 0.901 | 0.948 | ||||
| 陆海区 | 1.000 | 0.962 | 0.980 | 1.000 | 0.962 | 0.981 | 1.000 | 0.996 | 0.998 | 1.000 | 0.982 | 0.991 | ||||
| 湖泊区 | 1.000 | 0.840 | 0.913 | 1.000 | 0.854 | 0.916 | 0.992 | 1.000 | 0.996 | 1.000 | 0.994 | 0.997 | ||||
| 城市区 | 1.000 | 0.925 | 0.961 | 1.000 | 0.923 | 0.960 | 1.000 | 0.621 | 0.766 | 1.000 | 0.619 | 0.765 | ||||
| 平均值 | 1.000 | 0.897 | 0.945 | 1.000 | 0.898 | 0.945 | 0.999 | 0.906 | 0.945 | 1.000 | 0.892 | 0.938 | ||||
| [1] |
唐新明, 李国元. 激光测高卫星的发展与展望[J]. 国际太空, 2017(11):13-18.
[
|
| [2] |
方勇, 曹彬才, 高力, 等. 激光雷达测绘卫星发展及应用[J]. 红外与激光工程, 2020, 49(11):19-27.
[
|
| [3] |
单杰, 田祥希, 李爽, 等. 星载激光测高技术进展[J]. 测绘学报, 2022, 51(6):964-982.
[
|
| [4] |
唐新明, 李国元, 张斌. 自然资源陆地卫星激光测高产品及典型应用[J]. 卫星应用, 2022(9):47-53.
[
|
| [5] |
|
| [6] |
|
| [7] |
|
| [8] |
董佳臣, 倪文俭, 张志玉, 等. ICESat-2植被冠层高度和地表高程数据产品用于森林高度提取的效果评价[J]. 遥感学报, 2021, 25(6):1294-1307.
[
|
| [9] |
|
| [10] |
|
| [11] |
庞勇, 李增元, 余涛, 等. 森林碳储量遥感卫星现状及趋势[J]. 航天返回与遥感, 2022, 43(6):1-15.
[
|
| [12] |
|
| [13] |
|
| [14] |
谢锋, 杨贵, 舒嵘, 等. 方向自适应的光子计数激光雷达滤波方法[J]. 红外与毫米波学报, 2017, 36(1):107-113.
[
|
| [15] |
|
| [16] |
|
| [17] |
|
| [18] |
|
| [19] |
|
| [20] |
|
| [21] |
|
| [22] |
曹彬才, 王建荣, 胡燕, 等. 基于泊松分布的光子计数激光雷达点云去噪[J]. 海洋测绘, 2022, 42(2):65-69.
[
|
| [23] |
|
| [24] |
NASA. ICE, CLOUD, and Land Elevation Satellite (ICESat-2) Algorithm Theoretical Basis Document (ATBD) for Global Geolocated Photons(ATL03)[EB/OL]. [2024-04-04] https://nsidc.org/sites/default/files/documents/technical-reference/icesat2_atl03_atbd_v006.pdf
|
| [25] |
张智宇. 星载光子计数激光雷达探测理论与全链路仿真技术研究[D]. 武汉: 武汉大学, 2021.
[
|
| [26] |
何光辉, 王虹, 方强, 等. 山地坡度自适应星载光子计数激光雷达点云去噪方法[J]. 红外与毫米波学报, 2023, 42(2):250-259.
[
|
| [27] |
王振华, 陈诗贤, 孔伟, 等. 光子计数激光雷达中光子点云滤波方法的比较与分析[J]. 激光与光电子学进展, 2023, 60(6):344-351.
[
|
| [28] |
|
| [29] |
|
/
| 〈 |
|
〉 |
