
中亚-西亚经济走廊国土空间格局演变特征及机制分析
|
张 轲(1986— ),女,河南驻马店人,博士,讲师,主要研究方向为国土空间规划、世界地理。E-mail: 365161869@qq.com |
Copy editor: 蒋树芳
收稿日期: 2024-08-08
修回日期: 2024-09-23
网络出版日期: 2024-11-07
基金资助
中央高校基本科研业务费专项资金项目(2042024kf0029)
教育部人文社会科学研究规划基金项目(23YJA630003)
湖北省自然科学基金面上项目(2023AFB794)
Characterizing the Evolution of Territorial Space Patterns and Driving Mechanisms in the Countries Along the Central Asia-West Asia Economic Corridor
Received date: 2024-08-08
Revised date: 2024-09-23
Online published: 2024-11-07
Supported by
The Fundamental Research for the Central Universities(2042024kf0029)
Humanities and Social Science Research Planning Fund Project of the Ministry of Education of China(23YJA630003)
The Natural Science Foundation of Hubei Province(2023AFB794)
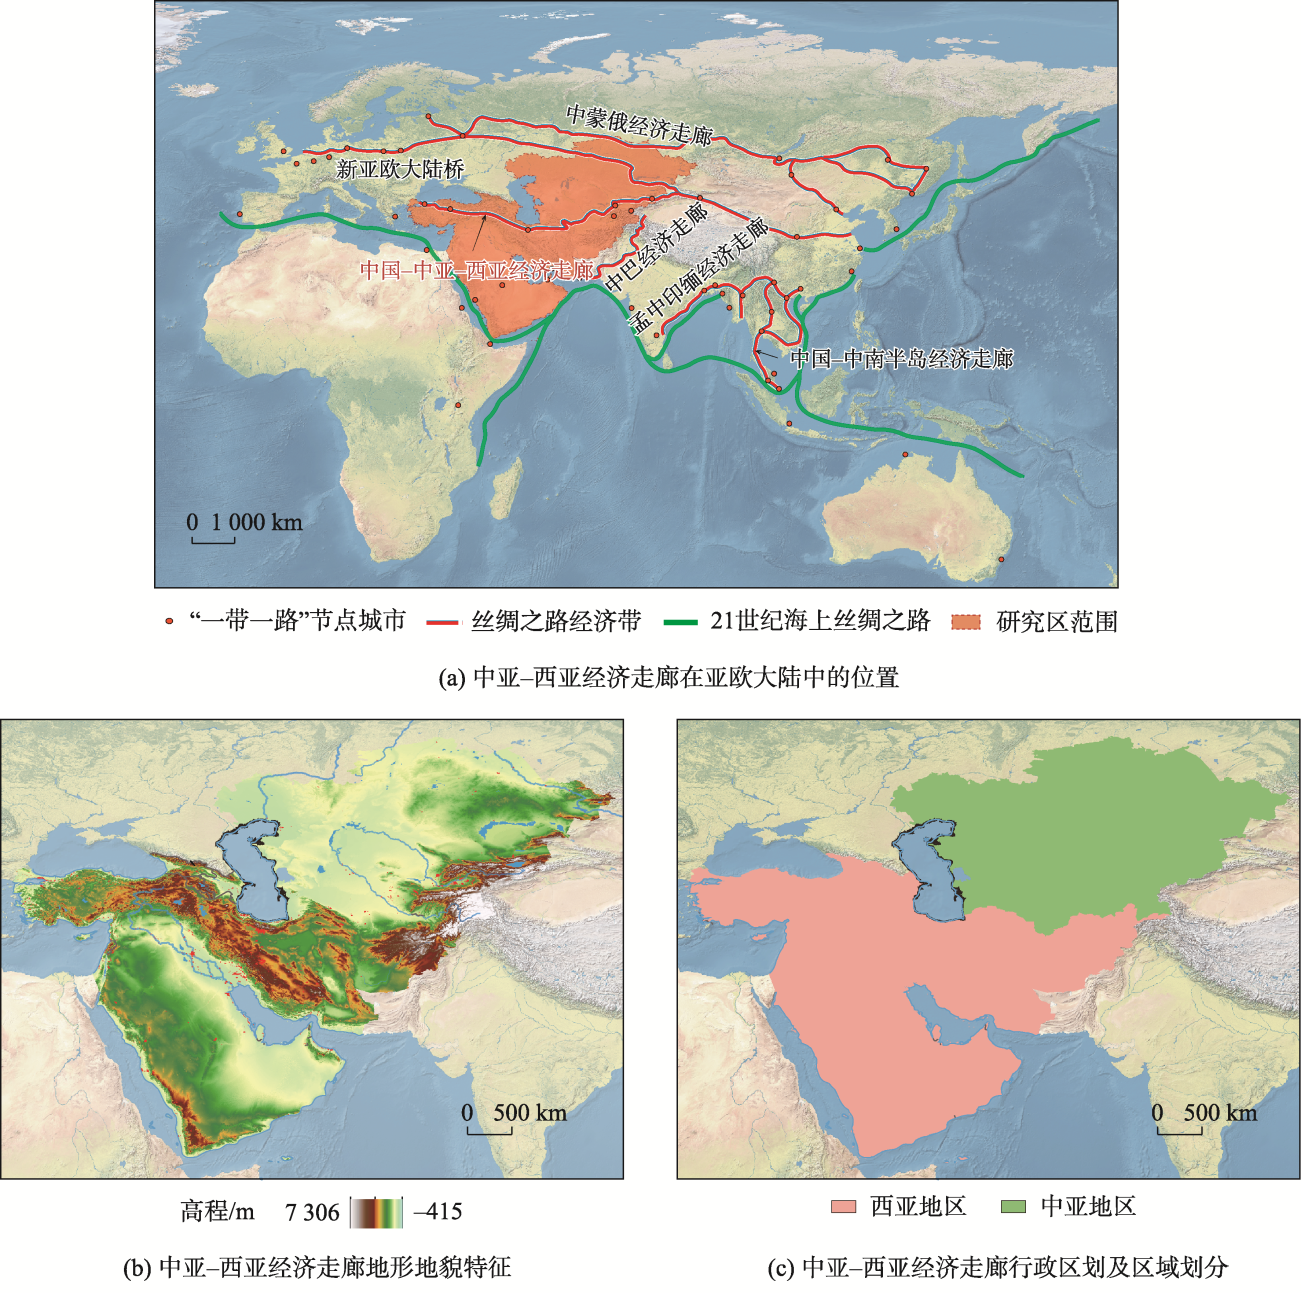
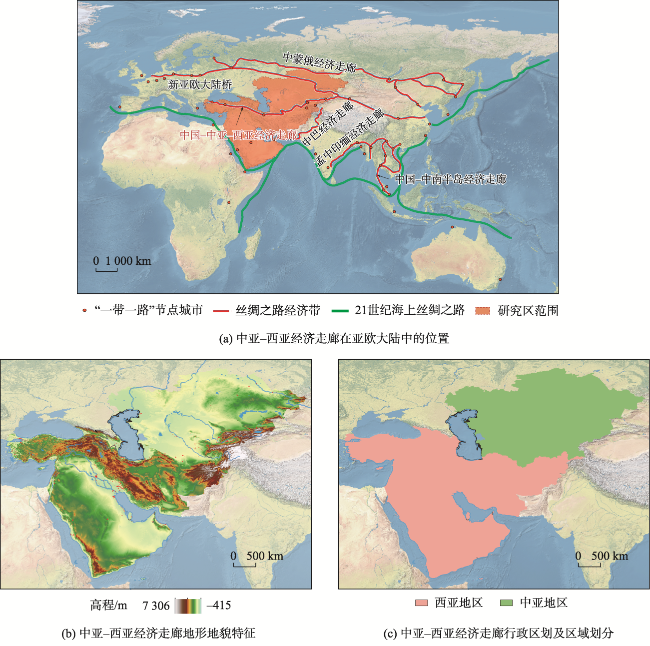
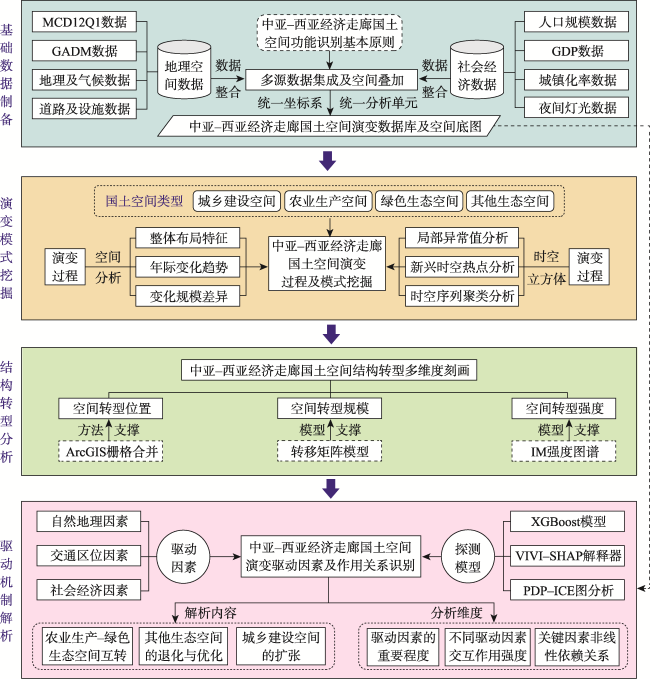
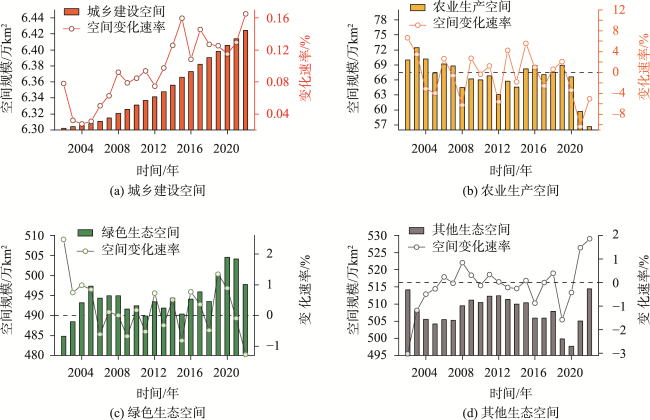
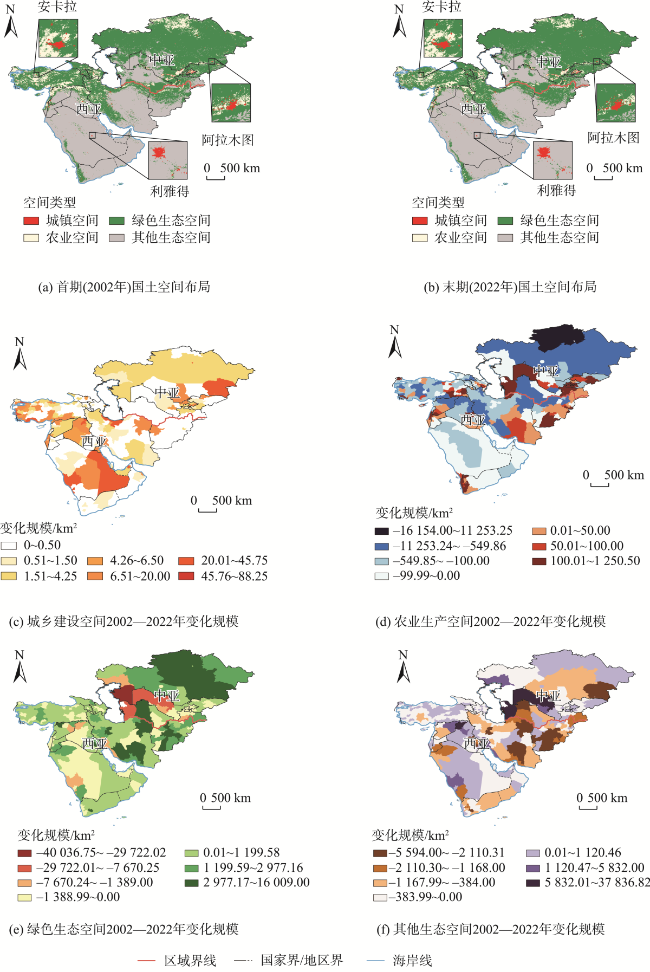
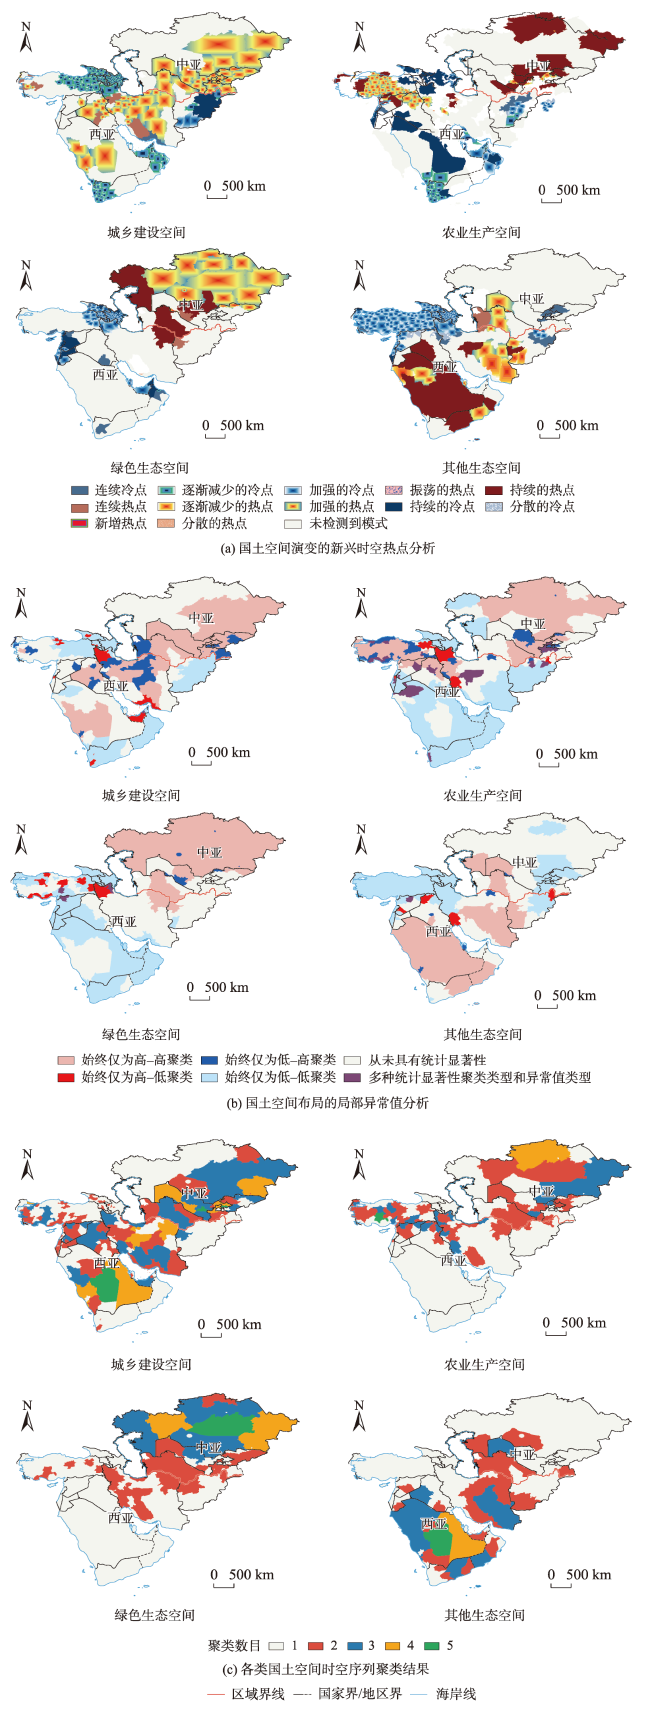
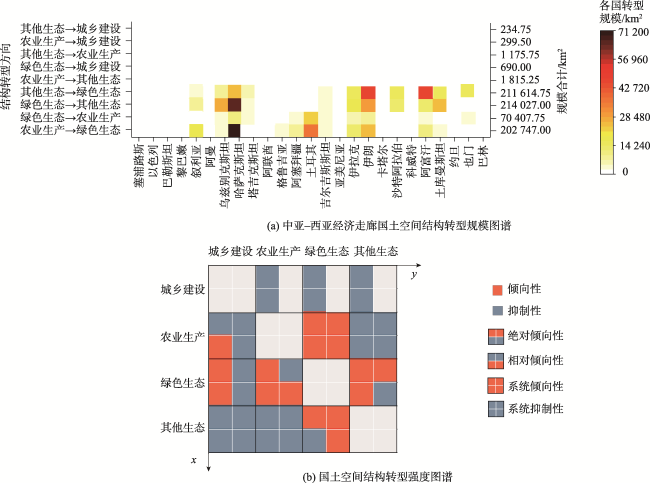
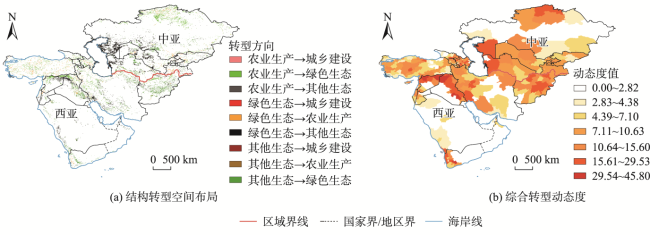
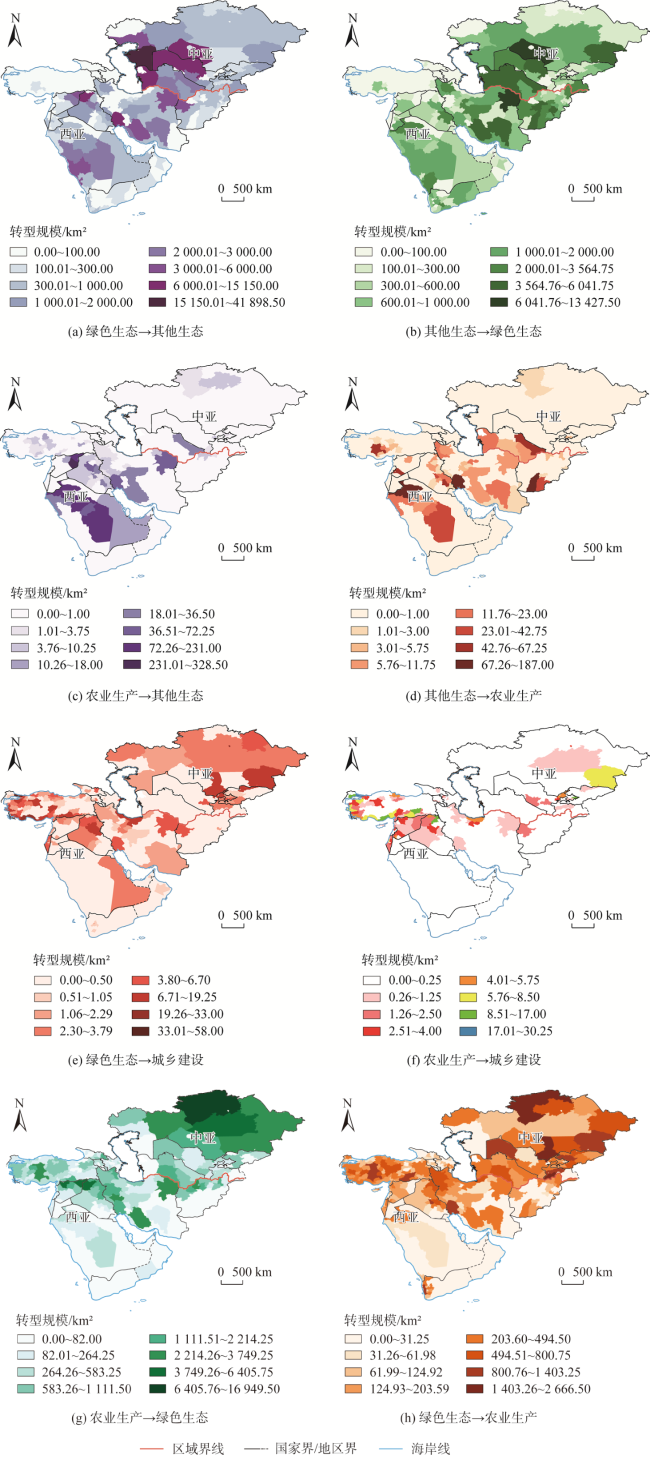
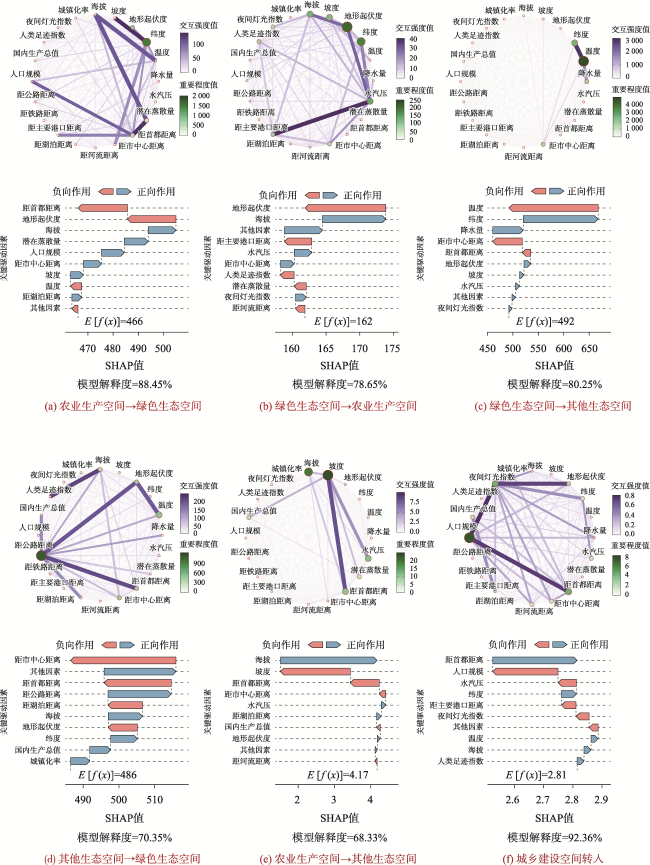
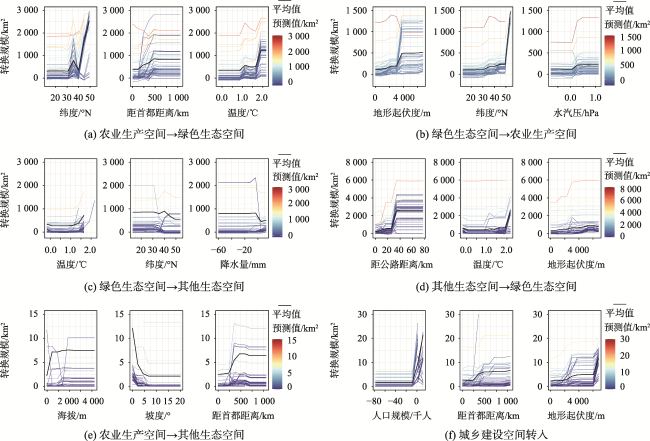
科学认知中亚-西亚经济走廊国土空间时空演变过程及形成机制,对服务当前“走出去”对外战略和“一带一路”倡议具有重要科学价值与实践意义。依据地域主导功能划分中亚-西亚经济走廊城乡建设、农业生产和生态保护三大国土空间类型,整合多源时空数据构建2002—2022年长时序国土空间分析底图,利用时空立方体模型刻画空间演变过程及典型模式,综合空间转型强度模型从规模-位置-强度3个维度分析空间结构转型特征,基于可解释机器学习模型VIVI-SHAP框架从驱动因素重要程度、交互作用强度和非线性依赖关系等方面分析演变机制。结果表明: ① 2002—2022年中亚-西亚经济走廊约6.14%的国土空间发生了结构转型,城乡建设空间占比小但稳定增长0.17%,农业生产空间整体下降19.04%;生态保护空间内部结构变化明显; ② 生态保护空间内部绿色与其他生态空间的动态互转占主导地位,绿色生态空间向农业生产空间转化呈现出系统倾向性,而城乡建设空间扩张的主要来源为绿色生态空间,占总转入规模的56.36%; ③ 中亚-西亚经济走廊国土空间格局由多个规模量级不同、转型强度各异、驱动机理多样的国土空间转型过程共同塑造,自然地理因素及交通区位因素起到决定性作用,而人口增长和社会经济发展对国土空间结构转型的全局性影响并不突出。本研究为揭示中亚-西亚经济走廊国土空间类型的变化规律和机制提供了新视角和新方法,进一步为决策部门制定合理的国土空间规划提供了数据支持,并在实现更大的空间综合收益及推动区域经济协同发展方面展现了应用价值。
张轲 , 尹力 , 魏伟 , 李泓锐 , 赵浪 , 薄立明 . 中亚-西亚经济走廊国土空间格局演变特征及机制分析[J]. 地球信息科学学报, 2024 , 26(11) : 2529 -2551 . DOI: 10.12082/dqxxkx.2024.240439
Scientific knowledge of the spatio-temporal evolution processes and formation mechanisms of territorial space in countries along the Central Asia-West Asia Economic Corridor holds significant scientific value and practical importance for supporting the current "Going Global" strategy and the "Belt and Road" initiative. Based on the dominant functions of the territories, the Central Asia-West Asia Economic Corridor is divided into three major types of territorial space: urban and rural construction, agricultural production, and ecological protection. A long-term analysis base map of territorial space from 2002 to 2022 was constructed by integrating multi-source spatio-temporal data. The spatio-temporal cube model was employed to depict the spatio-temporal evolution processes and typical patterns, while the integrated spatial transformation intensity model analyzed the characteristics of spatial structural transformation across three dimensions: scale, location, and intensity. The VIVI-SHAP framework of an interpretable machine learning model was used to analyze the evolution mechanisms, focusing on the importance of driving factors, interaction intensity, and non-linear dependencies. The results show that: (1) Approximately 6.14% of the territorial space in countries along the corridor underwent structural transformation over the past 20 years. The proportion of urban and rural construction space, though small, increased steadily by 0.17%, while agricultural production space decreased by 19.04% overall, with significant structural changes within the ecological protection space. (2) The dynamic interchange between green and other ecological spaces within the ecological protection space is predominant, with a systematic tendency for green ecological space to convert into agricultural production space, while the main source of urban and rural construction space expansion was green ecological space, accounting for 56.36% of the total converted area. 3) The territorial spatial pattern of the corridor is shaped by multiple processes of territorial space transformation, each with different magnitudes, intensities, and driving mechanisms. Natural geographic factors and transportation location factors played decisive roles, while the global influence of population growth and socio-economic development on territorial space structural transformation was less pronounced. This study provides new perspectives and methods to reveal the patterns and mechanisms of changes in land spatial types in the Central Asia-West Asia region. It further provides data support for decision-making departments to formulate reasonable land spatial planning, and demonstrates its application value in achieving greater spatial comprehensive benefits and promoting coordinated regional economic development.
表1 数据来源与分类Tab. 1 Data sources and classifications |
| 数据类型 | 数据项目 | 数据获取时间/年 | 数据来源 | |
|---|---|---|---|---|
| 国土空间分类数据 | MCD12Q1土地覆被数据集 | 2001—2022 | 美国宇航局地球观测系统数据和信息系统(NASA EOSDIS)MODIS/Terra+Aqua MCD12Q1数据集 | |
| 各国行政边界数据 | 中亚-西亚经济走廊各级行政区划 | 2022 | 全球行政区划数据库GADM(https://gadm.org/),经与我国自然资源部标准底图比较修改后使用 | |
| 驱动因素探测数据 | 自然地理要素 | 海拔、纬度数据 | 2014 | EarthEnv-DEM90数值高程模型(https://www.earthenv.org/DEM) |
| 坡度、地形起伏度数据 | 2014 | 利用DEM数据在ArcGIS10.7中处理后获得 | ||
| 温度、降水量、水汽压、 潜在蒸散量数据 | 2002—2022 | 英国国家大气科学中心CRU TS全球气象数据(https://crudata.uea.ac.uk/cru/data/hrg/) | ||
| 交通区位要素 | 港口、铁路、公路等交通设施数据及河流湖泊等空间位置数据 | 2022 | 自然地球数据库(https://www.naturalearthdata.com/)、全球水文数据集(https://www.hydrosheds.org/)、开放街道地图数据集(https://www.openstreetmap.org/) | |
| 社会经济要素 | 人口规模数据 | 2002—2022 | LandScan全球人口密度空间分布数据(https://landscan.ornl.gov/) | |
| 夜间灯光数据 | 2002—2022 | 地球观测组织全球高质量夜间灯光遥感影像(https://eogdata.mines.edu/products/vnl/) | ||
| 城镇化率和GDP数据 | 2002—2020 | 美国航天局对地观测系统数据与信息中心(https://sedac.ciesin.columbia.edu/data/sets/browse) | ||
| 人类足迹数据 | 2002—2020 | 全球人类足迹数据集(https://www.x-mol.com/groups/li_xuecao/news/48145) | ||
表2 中亚-西亚经济走廊国土空间分类与国际地圈-生物圈计划(IGBP)中土地利用类型的衔接Tab. 2 Cohesion table of Central Asia-West Asia Economic Corridor's territorial spatial classification and land use types in International Geosphere-Biosphere Program(IGBP) |
| 中亚-西亚经济走廊 国土空间分类 | IGBP土地利用类型及内涵 | 空间主导功能 |
|---|---|---|
| 城乡建设空间 | 城市和建成区用地、不透水表面面积≥30%的场地 | 承载城乡建设与发展功能 |
| 农业生产空间 | 耕地(耕地面积≥60%)和半混合耕地(40%~60%的小规模种植地) | 粮食生产与粮食安全 |
| 绿色生态空间 | 常绿针叶林、常绿阔叶林、落叶针叶林、落叶阔叶林进和混交林(覆盖率均>60%且冠高>2 m);封闭灌木林(覆盖率>60%)、开阔灌木林(覆盖率为10%~60%)、草地;湿地、永久性冰川积雪地 | 提供正向生态系统服务功能 |
| 其他生态空间 | 沙地、岩石和裸土地 | 需要修复与保育 |
注:资料来源于MODIS Collection6.1(C61)土地覆被数据产品用户指南(https://lpdaac.usgs.gov/documents/1409/MCD12_User_Guide_V61.pdf)中MCD12Q1国际地圈-生物圈计划(IGBP)土地利用分类说明,经翻译与整理。 |
表3 可解释机器学习变量和指标说明Tab. 3 Variable description and statistical characteristics of driving factors of Central Asia-West Asia Economic Corridor's territorial spatial evolution |
| 维度 | 驱动因素名称 | 符号 | 计算方法 |
|---|---|---|---|
| 自然地理 | 纬度 | g1 | ArcGIS栅格统计 |
| 海拔 | g2 | ArcGIS栅格统计 | |
| 坡度 | g3 | ArcGIS栅格统计 | |
| 地形起伏度 | g4 | ArcGIS栅格统计 | |
| 温度 | g5 | ArcGIS栅格统计 | |
| 降水量 | g6 | ArcGIS栅格统计 | |
| 水汽压 | g7 | ArcGIS栅格统计 | |
| 潜在蒸散量 | g8 | ArcGIS栅格统计 | |
| 交通区位 | 距首都距离 | t1 | ArcGIS欧式距离分析 |
| 距市中心距离 | t2 | ArcGIS欧式距离分析 | |
| 距公路距离 | t3 | ArcGIS欧式距离分析 | |
| 距铁路距离 | t4 | ArcGIS欧式距离分析 | |
| 距湖泊距离 | t5 | ArcGIS欧式距离分析 | |
| 距主要港口距离 | t6 | ArcGIS欧式距离分析 | |
| 距河流距离 | t7 | ArcGIS欧式距离分析 | |
| 社会经济 | 人口规模 | s1 | ArcGIS栅格统计 |
| 城镇化率 | s2 | ArcGIS栅格统计 | |
| 国内生产总值 | s3 | ArcGIS栅格统计 | |
| 夜间灯光指数 | s4 | ArcGIS栅格统计 | |
| 人类足迹指数 | s5 | ArcGIS栅格统计 |
图3 中亚-西亚经济走廊2002—2022年各类国土空间规模及年均变化速率Fig. 3 Central Asia-West Asia Economic Corridor 2002—2022 various types of territorial spacal scale and annual average rate of change |
图7 中亚-西亚经济走廊国土空间结构转型布局及转型动态度注:该图基于自然资源部标准地图服务网站下载的审图号为GS(2021)5443号的标准地图绘制,底图无修改。 Fig. 7 Transformation layout and dynamic degree of territorial spatial structure transformation in Central Asia-West Asia Economic Corridor |
| [1] |
宋涛, 程艺, 刘卫东, 等. 中国边境地缘经济的空间差异及影响机制[J]. 地理学报, 2017, 72(10):1731-1745.
[
|
| [2] |
朱永彪. “中国—中亚—西亚经济走廊”的建设现状与前景[J]. 兰州大学学报(社会科学版), 2023, 51(4):1-12.
[
|
| [3] |
中华人民共和国国家发展和改革委员会, 中华人民共和国外交部, 中华人民共和国商务部. 推动共建丝绸之路经济带和21世纪海上丝绸之路的愿景与行动[N]. 人民日报,2015-03-29(4).
[National Development and Reform Commission, Ministry of Foreign Affairs of the People's Republic of China, Ministry of Commerce of the People's Republic of China. Vision and actions on jointly building silk road economic belt and 21st-century maritime silk road[N]. People's Daily, 2015-03-29(4).]
|
| [4] |
李晓丽, 吴威, 刘玮辰. 基于国际公路运输链的“一带一路”区域公路通达性分析[J]. 地理研究, 2020, 39(11):2552-2567.
[
|
| [5] |
汪泰, 陈俊华. 中国—中亚—西亚经济走廊贸易投资便利化水平研究[J]. 世界地理研究, 2020, 29(5):883-892.
[
|
| [6] |
宋周莺, 虞洋. “一带一路”沿线贸易便利化发展格局研究[J]. 地理科学进展, 2020, 39(3):355-366.
[
|
| [7] |
杨宇, 郭越, 樊杰, 等. 能源地理研究的发展与展望[J]. 地理学报, 2024, 79(1):147-170.
[
|
| [8] |
赵亚博, 胡志丁, 葛岳静, 等. 中国与中亚地区地缘经济关联度的时空演变与类型划分[J]. 世界地理研究, 2019, 28(2):105-113.
[
|
| [9] |
|
| [10] |
陈伟, 赵晞泉, 刘卫东, 等. “一带一路”贸易网络演化与贸易门户国家识别[J]. 地理学报, 2023, 78(10):2465-2483.
[
|
| [11] |
姚辉斌, 彭新宇. “一带一路”沿线国家制度环境对中国农产品出口贸易的影响研究[J]. 农业技术经济, 2021(4):17-29.
[
|
| [12] |
赵捷, 陈秧分. 中国企业对中亚农业投资的模式选择——基于“一带一路”投资环境的对比分析[J]. 世界农业, 2021,(9):24- 36,122-123.
[
|
| [13] |
马海涛, 孙湛. 中亚五国综合城镇化水平测度及其动力因素[J]. 地理学报, 2021, 76(2):367-382.
[
|
| [14] |
刘晶, 方创琳, 何伦志, 等. “一带一路”沿线国家城镇化发展质量综合评价——基于经济、制度、社会视角[J]. 经济地理, 2019, 39(4):59-66.
[
|
| [15] |
高倩,阿里木江·卡斯木. “一带一路”沿线之中国新疆—中亚—西亚城市空间扩张[J]. 经济地理, 2017, 37(5):51-57.
[
|
| [16] |
于水, 陈迪桃, 黄法融, 等. 中亚农业水资源脆弱性空间格局及分区研究[J]. 中国农业资源与区划, 2020, 41(4):11-20.
[
|
| [17] |
李富佳, 董锁成, 原琳娜, 等. “一带一路”农业战略格局及对策[J]. 中国科学院院刊, 2016, 31(6):678-688.
[
|
| [18] |
姚檀栋, 黄建平, 徐柏青, 等. 绿色丝绸之路建设的气候变化科技应对战略[J]. 中国科学院院刊, 2023, 38(9):1264-1272.
[
|
| [19] |
苏芳, 刘钰, 陈律凡, 等. 气候变化对中亚五国粮食安全的影响[J]. 中国科学:地球科学, 2024, 54(1):281-293.
[
|
| [20] |
郑玉雯, 薛伟贤. 丝绸之路经济带生态环境风险评估及发展趋势预判[J]. 中国软科学, 2022(2):95-104.
[
|
| [21] |
杨恕, 孙凌霄, 何婧, 等. 咸海变迁——危机和现状[J]. 干旱区地理, 2024, 47(2):181-191.
[
|
| [22] |
陆建涛, 彭建, 李刚勇, 等. 干旱对中亚草地总初级生产力时滞和累积效应的影响评估[J]. 生态学报, 2023, 43(23):9745-9757.
[
|
| [23] |
莫贵芬, 冯建中, 白林燕, 等. 2001—2018年中亚干旱区地表水资源时空变化特征[J]. 地理科学, 2022, 42(1):174-184.
[
|
| [24] |
闫雪, 孟德坤, 陈迪桃, 等. 基于生态系统服务的中亚水土热资源匹配度时空变化特征[J]. 应用生态学报, 2020, 31(3):794-806.
[
|
| [25] |
陈桃, 包安明, 郭浩, 等. 中亚跨境流域生态脆弱性评价及其时空特征分析——以阿姆河流域为例[J]. 自然资源学报, 2019, 34(12):2643-2657.
[
|
| [26] |
秦大河, 张国友, 宋长青, 等. 今天的中国为什么比任何时候都需要世界地理学[J]. 世界地理研究, 2020, 29(1):1-7.
[
|
| [27] |
张棋, 许德合, 丁严. 基于SPEI和时空立方体的中国近40年干旱时空模式挖掘[J]. 干旱地区农业研究, 2021, 39(3):194-201.
[
|
| [28] |
朱艳丽, 靖常峰, 伏家云, 等. 时空立方体的抢劫案件时空特征挖掘与分析[J]. 测绘科学, 2019, 44(9):132-138,145.
[
|
| [29] |
顾观海, 吴彬, 张文主, 等. 中国边境地区国土空间演变及驱动机制的区域差异研究[J]. 自然资源学报, 2024, 39(5):1022-1038.
[
|
| [30] |
魏伟, 尹力, 谢波, 等. 国土空间规划背景下黄河流域“三区空间”演化特征及机制[J]. 经济地理, 2022, 42(3):44-55,86.
[
|
| [31] |
刘瑞, 朱道林. 基于转移矩阵的土地利用变化信息挖掘方法探讨[J]. 资源科学, 2010, 32(8):1544-1550.
[
|
| [32] |
李帅呈, 龚健, 杨建新, 等. 兰西城市群土地利用/覆被变化模式特征——基于强度分析框架[J]. 资源科学, 2023, 45(3):480-493.
[
|
| [33] |
|
| [34] |
|
| [35] |
|
| [36] |
|
| [37] |
|
/
| 〈 |
|
〉 |