
耦合Sentinel-1/2多源时序遥感影像特征的红树林物种分类方法
|
薛宇飞(1997— ),男,山东聊城人,博士生,主要研究方向为红树林植被遥感解译、植被碳汇遥感。E-mail: 2022010182@m.scnu.edu.cn |
Copy editor: 蒋树芳
收稿日期: 2024-06-11
修回日期: 2024-08-28
网络出版日期: 2024-11-07
基金资助
国家自然科学基金面上项目(42071399)
广东省红树林生态修复项目数据采集及监测示范项目。
Classification of Mangrove Species Using Coupled Sentinel-1/2 Multi-Source Time-Series Remote Sensing Image Features
Received date: 2024-06-11
Revised date: 2024-08-28
Online published: 2024-11-07
Supported by
National Natural Science Foundation of China(42071399)
Data Collection and Monitoring Demonstration Project for Mangrove Ecological Restoration Project in Guangdong Province.
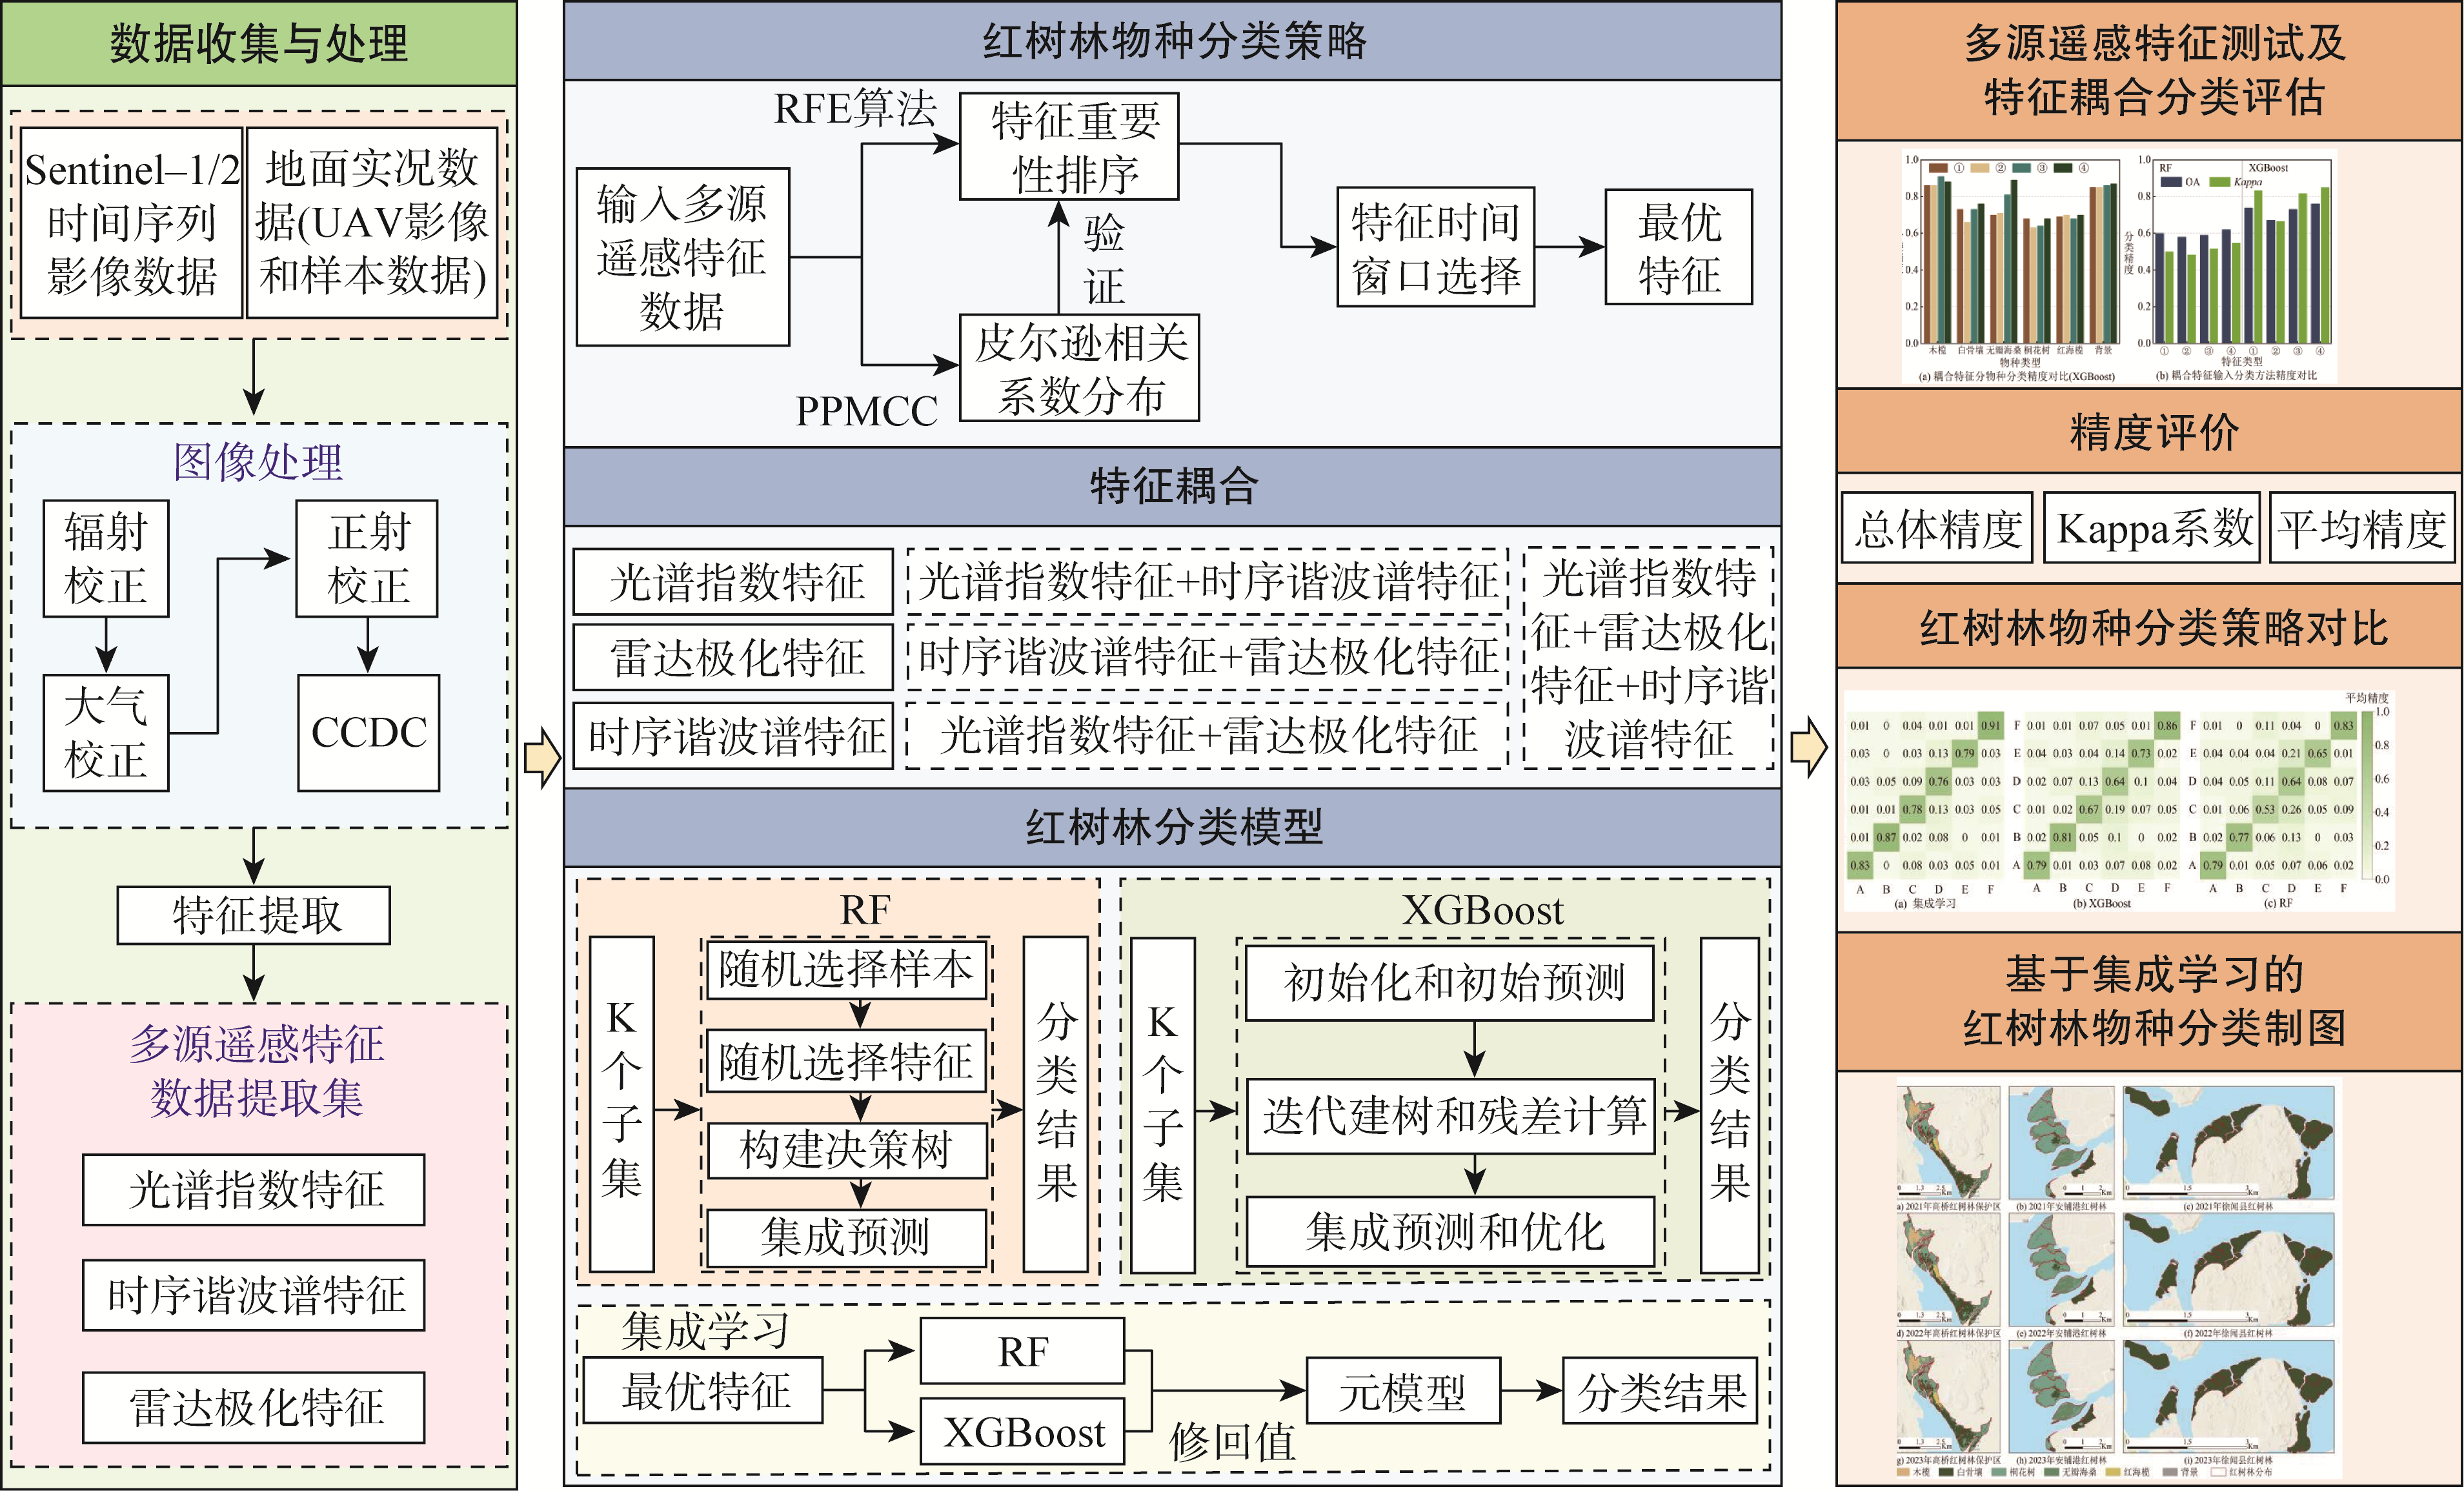
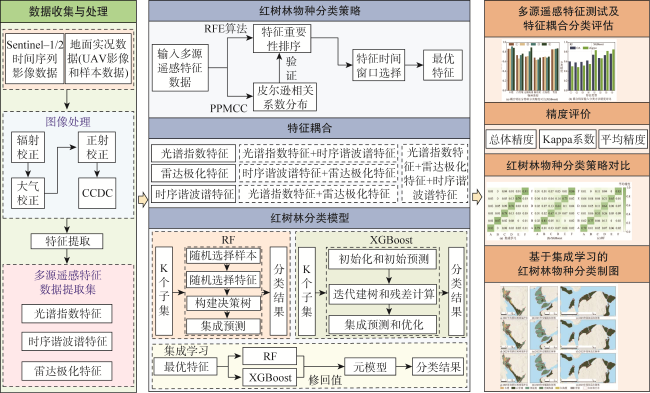
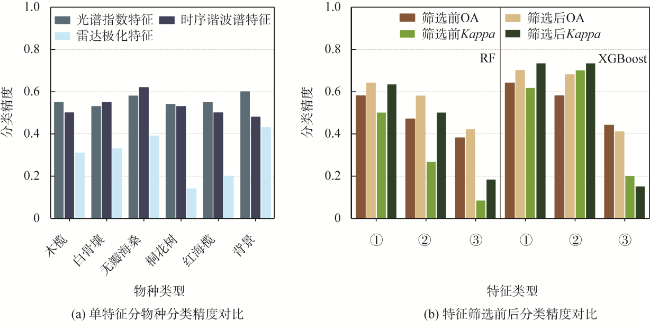
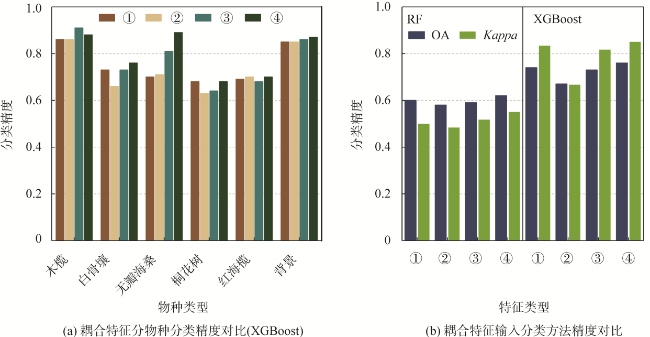
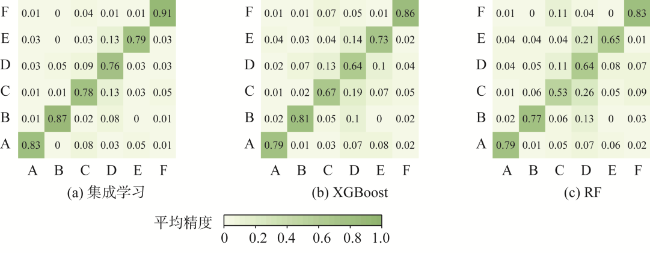
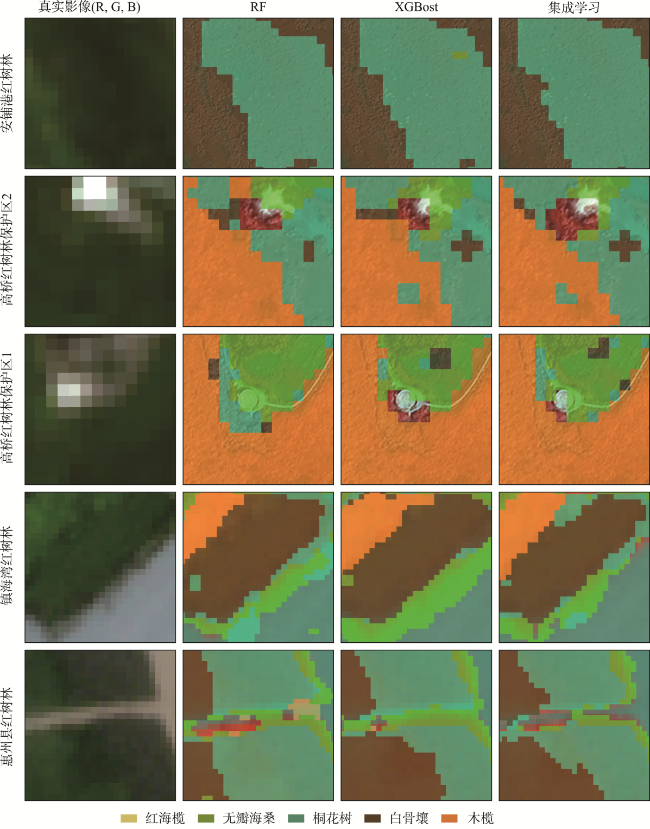
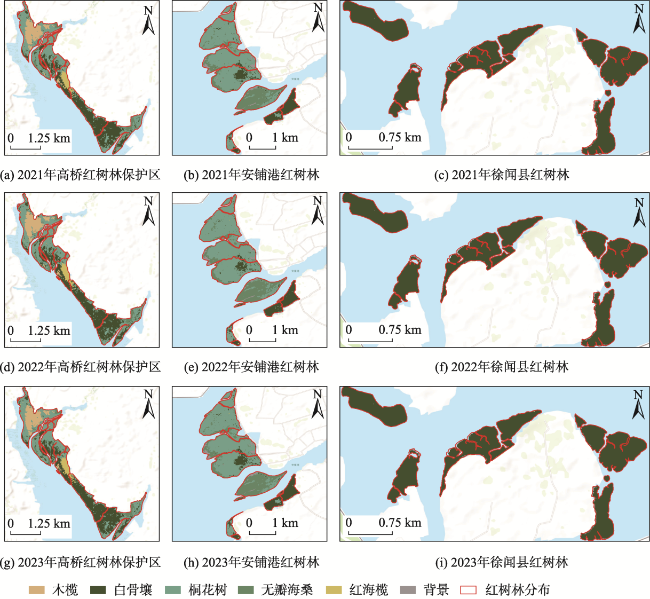
科学准确地监测红树林物种是保护滨海湿地生态系统的基础和前提。利用多源遥感数据能够有效进行红树林物种精细化分类,但在光学和SAR影像特征及其时间变化信息的应用方面仍存在一定的挑战。本文基于Sentinel-1/2影像数据,提出一种基于多源遥感影像特征耦合和集成学习(Ensemble Learning)算法(Multi-source Features-coupled and Ensemble Learning algorithm, MFEL)的红树林物种分类框架,通过分析光谱指数特征、雷达极化特征及其时序谐波谱特征在特征优选和耦合互补上的分类优势,堆叠随机森林(Random Forest, RF)和极端梯度提升(eXtreme Gradient Boosting, XGBoost)算法,构建红树林物种分类的集成学习分类模型,对比基于特征优选的RF分类模型和XGBoost分类模型,评估MFEL分类方法的分类精度和特征应用差异。本研究以湛江市红树林国家级自然保护区为实验区,实验结果表明: ① 相比于只使用光谱指数特征进行红树林物种分类而言,在增加雷达极化特征或时序谐波谱特征参与分类后,分类精度分别提高了6%和8%;同时增加雷达极化特征和时序谐波谱特征参与分类可以更精准地实现红树林物种分类,分类精度提高了12%; ② MFEL方法分类精度最高,总体精度达到88.03%, Kappa系数为0.86;将使用实验区红树林物种样本训练的MFEL模型迁移至其他区域,物种分类精度分别为83.94%和82.77%; ③ 研究验证了雷达极化特征和时序谐波谱特征在红树林物种分类中的应用潜力,对五种红树林物种分类的精度也有明显提升,分类精度为76%~91%。研究结果对拓展中分辨率遥感卫星影像进行红树林物种监测具有参考价值。
薛宇飞 , 张声晗 , 白娜娜 , 原峰 , 刘杰 , 陈烨 , 黄晓慧 , 熊兰兰 , 付迎春 . 耦合Sentinel-1/2多源时序遥感影像特征的红树林物种分类方法[J]. 地球信息科学学报, 2024 , 26(11) : 2626 -2642 . DOI: 10.12082/dqxxkx.2024.240334
Scientific and accurate monitoring of mangroves is the basis and premise for protecting marine coastal wetland ecosystems. Multi-source remote sensing data can be used to classify mangrove species effectively, but challenges remain in applying optical and SAR image features along with their time-varying information. In this paper, based on Sentinel-1/2 image data, we propose a mangrove species classification framework using Multi-source Features-coupled and Ensemble Learning algorithm (MFEL). The framework analyzs the classification advantages of spectral index features, SAR polarization features, and their temporal harmonic spectral features in feature selection and coupling. It then stacks the Random Forest (RF) and eXtreme Gradient Boosting (XGBoost) models to construct an Ensemble Learning model for mangrove species classification. Comparing the RF classification model and XGBoost models based on feature optimization, we evaluated the classification accuracy and feature application differences of the MFEL classification method. Zhanjiang Mangrove Forest National Nature Reserve was selected as the experimental area. The results show that: ① compared to using only spectral index features, classification accuracy improves by 6% and 8% with the addition of SAR polarization features or temporal harmonic spectral features, respectively. Adding both SAR polarization features and temporal harmonic spectral features simultaneously improves classification accuracy by 12%, making it more effective for mangrove species classification. ② The MFEL method achieves the highest classification accuracy, with an overall accuracy of 88.03% and a Kappa coefficient of 0.86. When the MFEL model trained on samples from the experimental area was applied to other areas, the classification accuracies were 83.94% and 82.77%, respectively. ③ This study verifies the potential application of SAR polarization features and time-sequence harmonic spectral features in mangrove species classification, significantly improving the accuracy for five mangrove species, with accuracies ranging from 76% to 91%. The study results provide valuable insights for expanding the use of medium-resolution remote sensing satellite imagery in monitoring mangrove species.
表1 本文采用的光谱指数特征Tab. 1 Spectral index features used in this paper |
| 指数 | 公式和波段 | 编号 | 描述 | |
|---|---|---|---|---|
| 光谱波段 | Sentinel-2 MSI波段 | , , , , , , , , , | NIR、SWIR等波段对叶绿素敏感,反射效果好,可用于突出健康茂密植被 | |
| 植被指数 | 归一化植被指数 (Normalized Difference Vegetation Index, NDVI) | (1) | 对叶绿素十分敏感,但对于生长茂密的植被会产生饱和现象 | |
| 增强植被指数 (Enhanced Vegetation Index, EVI) | (2) | 加入蓝色波段以增强植被信号,校正土壤背景和气溶胶散射的影响 | ||
| 差值植被指数 (Difference Vegetation Index, DVI) | (3) | 对土壤背景的变化较为敏感 | ||
| 红树林植被指数 (Mangrove Vegetation Index, MVI) | (4) | 由Baloloy等[30]提出的专门用于监测红树林的指数 | ||
| 增强型红树林植被指数 (Enhanced Mangrove Vegetation Index, EMVI) | (5) | 由Yang等[32]提出的基于高光谱图像的红树林植被指数 | ||
| 比值植被指数 (Ratio Vegetation Index, RVI) | (6) | 绿色植被的灵敏指示参数,与叶干生物量、叶绿素含量相关性高,可用于检测和估算植物生物量 | ||
| 叶绿素植被指数 (Green Chlorophyll Vegetation Index, GCVI) | (7) | 使用近红外和绿光波段的反射比率来反映叶片中的叶绿素含量 | ||
| 湿地森林指数 (Wetland Forest Index, WFI) | (8) | 由Wang等[33]提出用于准确识别红树林 | ||
| 水体指数 | 归一化差值含水指数 (Normalized Difference Moisture Index, NDMI) | (9) | 对植被的水分含量敏感,使用NIR和SWIR波段创建比值以减轻光照影响和大气效应 | |
| 改进的归一化差值水体指数 (Modified Normalized Difference Water Index, MNDWI) | (10) | 对冠层水分含量的变化敏感 | ||
| 地表水分指数 (Land Surface Water Index, LSWI) | (11) | 对植被叶片含水量及土壤湿度敏感 |
表2 2021—2023年Sentinel系列数据统计Tab. 2 Sentinel series data used in this paper, 2021—2023 (幅) |
| 时间/月 | Sentinel-1 | Sentinel-2 |
|---|---|---|
| 1—3月 | 32 | 36 |
| 4—6月 | 33 | 21 |
| 7—9月 | 30 | 29 |
| 10—12月 | 34 | 26 |
| 总计 | 129 | 112 |
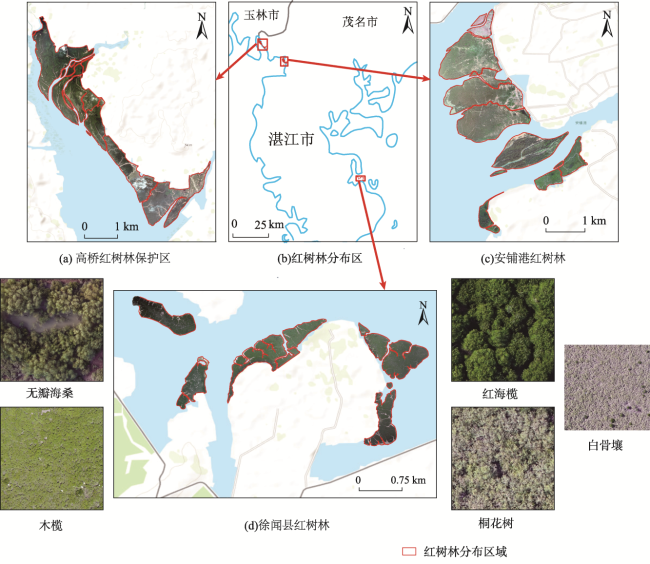
表3 研究区土地覆盖类型及其样本点数量Tab. 3 Training and validation samples data of study area (个) |
| 研究区 | 木榄 | 白骨壤 | 无瓣海桑 | 桐花树 | 红海榄 | 背景 |
|---|---|---|---|---|---|---|
| 高桥红树林保护区 | 166 | 283 | 72 | 286 | 199 | 200 |
| 安铺港红树林 | 20 | 351 | 120 | 243 | 20 | 200 |
| 徐闻县红树林 | 0 | 380 | 43 | 154 | 10 | 200 |
| 总计 | 186 | 1 014 | 235 | 683 | 229 | 600 |
| 2 947 | ||||||
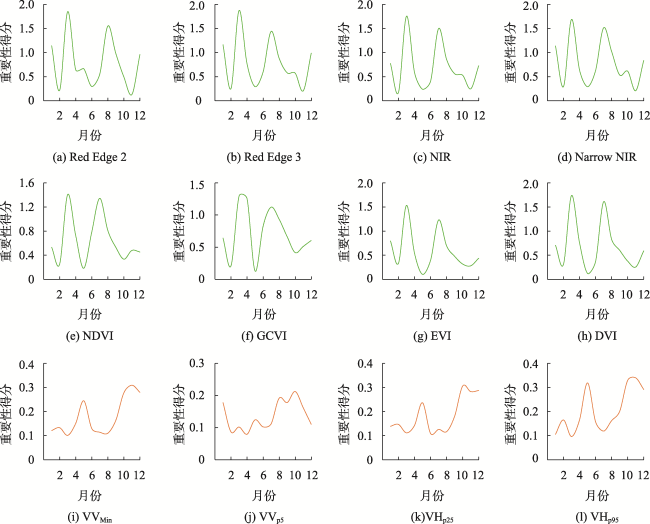
表4 本研究中使用的特征Tab. 4 List of features used in this study |
| 特征类型 | 特征 | |
|---|---|---|
| 优选前 | 优选后 | |
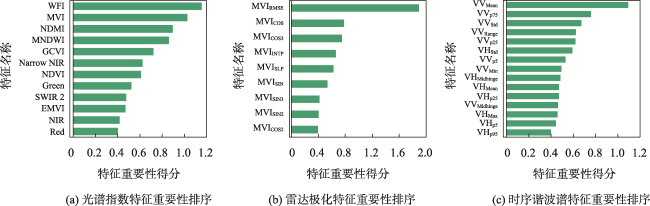
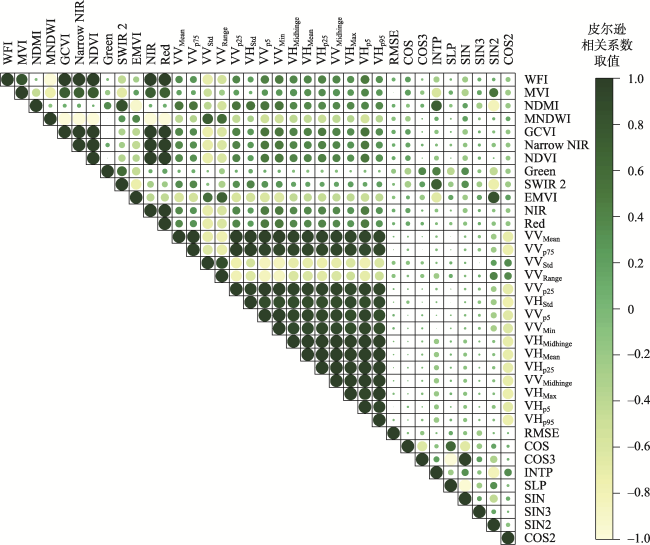
| 光谱指数 | Blue、 Green、 Red、 Red Edge 1、 Red Edge 2、 Red Edge 3、 NIR、Narrow NIR、 SWIR 1、 SWIR 2、 NDVI、 EVI、 DVI、 MVI、 RVI、GCVI、 WFI、 NDMI、 MNDWI、 EMVI | Green、 Red、 NIR、 Narrow NIR、 SWIR 2、 NDVI、 MVI、 GCVI、 WFI、 NDMI、 MNDWI、 EMVI |
| 时序谐波谱 | RMSE、 INTP、 SLP、 SIN 1-3、 COS 1-3 | RMSE、 INTP、 SLP、 SIN 1-3、 COS 1-3 |
| 雷达极化 | VV/VHMidhinge、 VV/VHMax、 VV/VHMin、 VV/VHStd、VV/VHMean、VV/VHRange、 VV/VHp5、 VV/VHp25、 VV/VHp75、 VV/VHp95 | VV/VHMidhinge、 VHMax、 VVMin、 VV/VHStd、 VV/VHMean、VHRange、 VV/VHp5、 VV/VHp25、 VVp75、 VHp95 |
注:每个光谱指数和雷达极化特征均包含9个时序谐波谱特征,使用RMSE、 INTP、 SLP, SIN 1-3、 COS 1-3表示。 |
感谢广东省海洋发展规划研究中心在实地调查和红树林物种数据上的支持。
| [1] |
|
| [2] |
林鹏. 红树林[M]. 北京: 海洋出版社;1984.
[
|
| [3] |
|
| [4] |
|
| [5] |
周振超, 李贺, 黄翀, 等. 红树林遥感动态监测研究进展[J]. 地球信息科学学报, 2018, 20(11):1631-1643.
[
|
| [6] |
卢元平, 徐卫华, 张志明, 等. 中国红树林生态系统保护空缺分析[J]. 生态学报, 2019, 39(2):684-691.
[
|
| [7] |
|
| [8] |
|
| [9] |
|
| [10] |
廖宝文, 张乔民. 中国红树林的分布、面积和树种组成[J]. 湿地科学, 2014, 12(4):435-440.
[
|
| [11] |
吴后建, 刘世好, 贺东北, 等. 中国红树林监测研究进展与展望[J]. 湿地科学与管理, 2022, 18(1):69-72.
[
|
| [12] |
|
| [13] |
|
| [14] |
|
| [15] |
薛朝辉, 钱思羽. 融合Landsat 8与Sentinel-2数据的红树林物候信息提取与分类[J]. 遥感学报, 2022, 26(6):1121-1142.
[
|
| [16] |
|
| [17] |
|
| [18] |
廖静娟, 王庆. 利用Radarsat-2极化雷达数据探测湿地地表特征与分类[J]. 国土资源遥感, 2009, 21(3):70-73.
[
|
| [19] |
|
| [20] |
|
| [21] |
高常军, 蒋侠朋, 甄佳宁, 等. 耦合WorldView-2和珠海一号影像的红树林物种分布[J]. 遥感学报, 2022, 26(6):1155-1168.
[
|
| [22] |
吴培强, 任广波, 张程飞, 等. 无人机多光谱和LiDAR的红树林精细识别与生物量估算[J]. 遥感学报, 2022, 26(6):1169-1181.
[
|
| [23] |
徐逸, 甄佳宁, 蒋侠朋, 等. 无人机遥感与XGBoost的红树林物种分类[J]. 遥感学报, 2021, 25(3):737-752.
[
|
| [24] |
|
| [25] |
|
| [26] |
|
| [27] |
|
| [28] |
|
| [29] |
|
| [30] |
|
| [31] |
|
| [32] |
|
| [33] |
|
| [34] |
|
| [35] |
|
| [36] |
|
| [37] |
|
| [38] |
|
| [39] |
陈粤超, 陈菁菁. 广东湛江红树林国家级自然保护区资源管理策略[J]. 湿地科学与管理, 2012, 8(1):17-19.
[
|
| [40] |
刘静, 马克明, 曲来叶. 广东湛江红树林国家级自然保护区优势乔木群落的物种组成及结构特征[J]. 生态科学, 2016, 35(3):1-7.
[
|
| [41] |
林康英, 张倩媚, 简曙光, 等. 湛江市红树林资源及其可持续利用[J]. 生态科学, 2006, 25(3):222-225.
[
|
| [42] |
廖宝文, 郑松发, 陈玉军, 等. 外来红树植物无瓣海桑生物学特性与生态环境适应性分析[J]. 生态学杂志, 2004, 23(1):10-15.
[
|
/
| 〈 |
|
〉 |
