
基于中心轴正交旋转的点云数据隧道断面提取方法
|
王铁星(1999— ),男,江西丰城人,硕士生,主要研究方向为隧道点云断面提取及三维重建研究。E-mail: 2447530848@qq.com |
Office editor: 黄光玉
收稿日期: 2024-09-09
修回日期: 2024-10-18
网络出版日期: 2024-11-28
基金资助
国家自然科学基金项目(42364003)
国家自然科学基金项目(41964008)
Tunnel Point Cloud Section Extraction Method Based on Orthogonal Rotation of the Central Axis
Received date: 2024-09-09
Revised date: 2024-10-18
Online published: 2024-11-28
Supported by
National Natural Science Foundation of China(42364003)
National Natural Science Foundation of China(41964008)
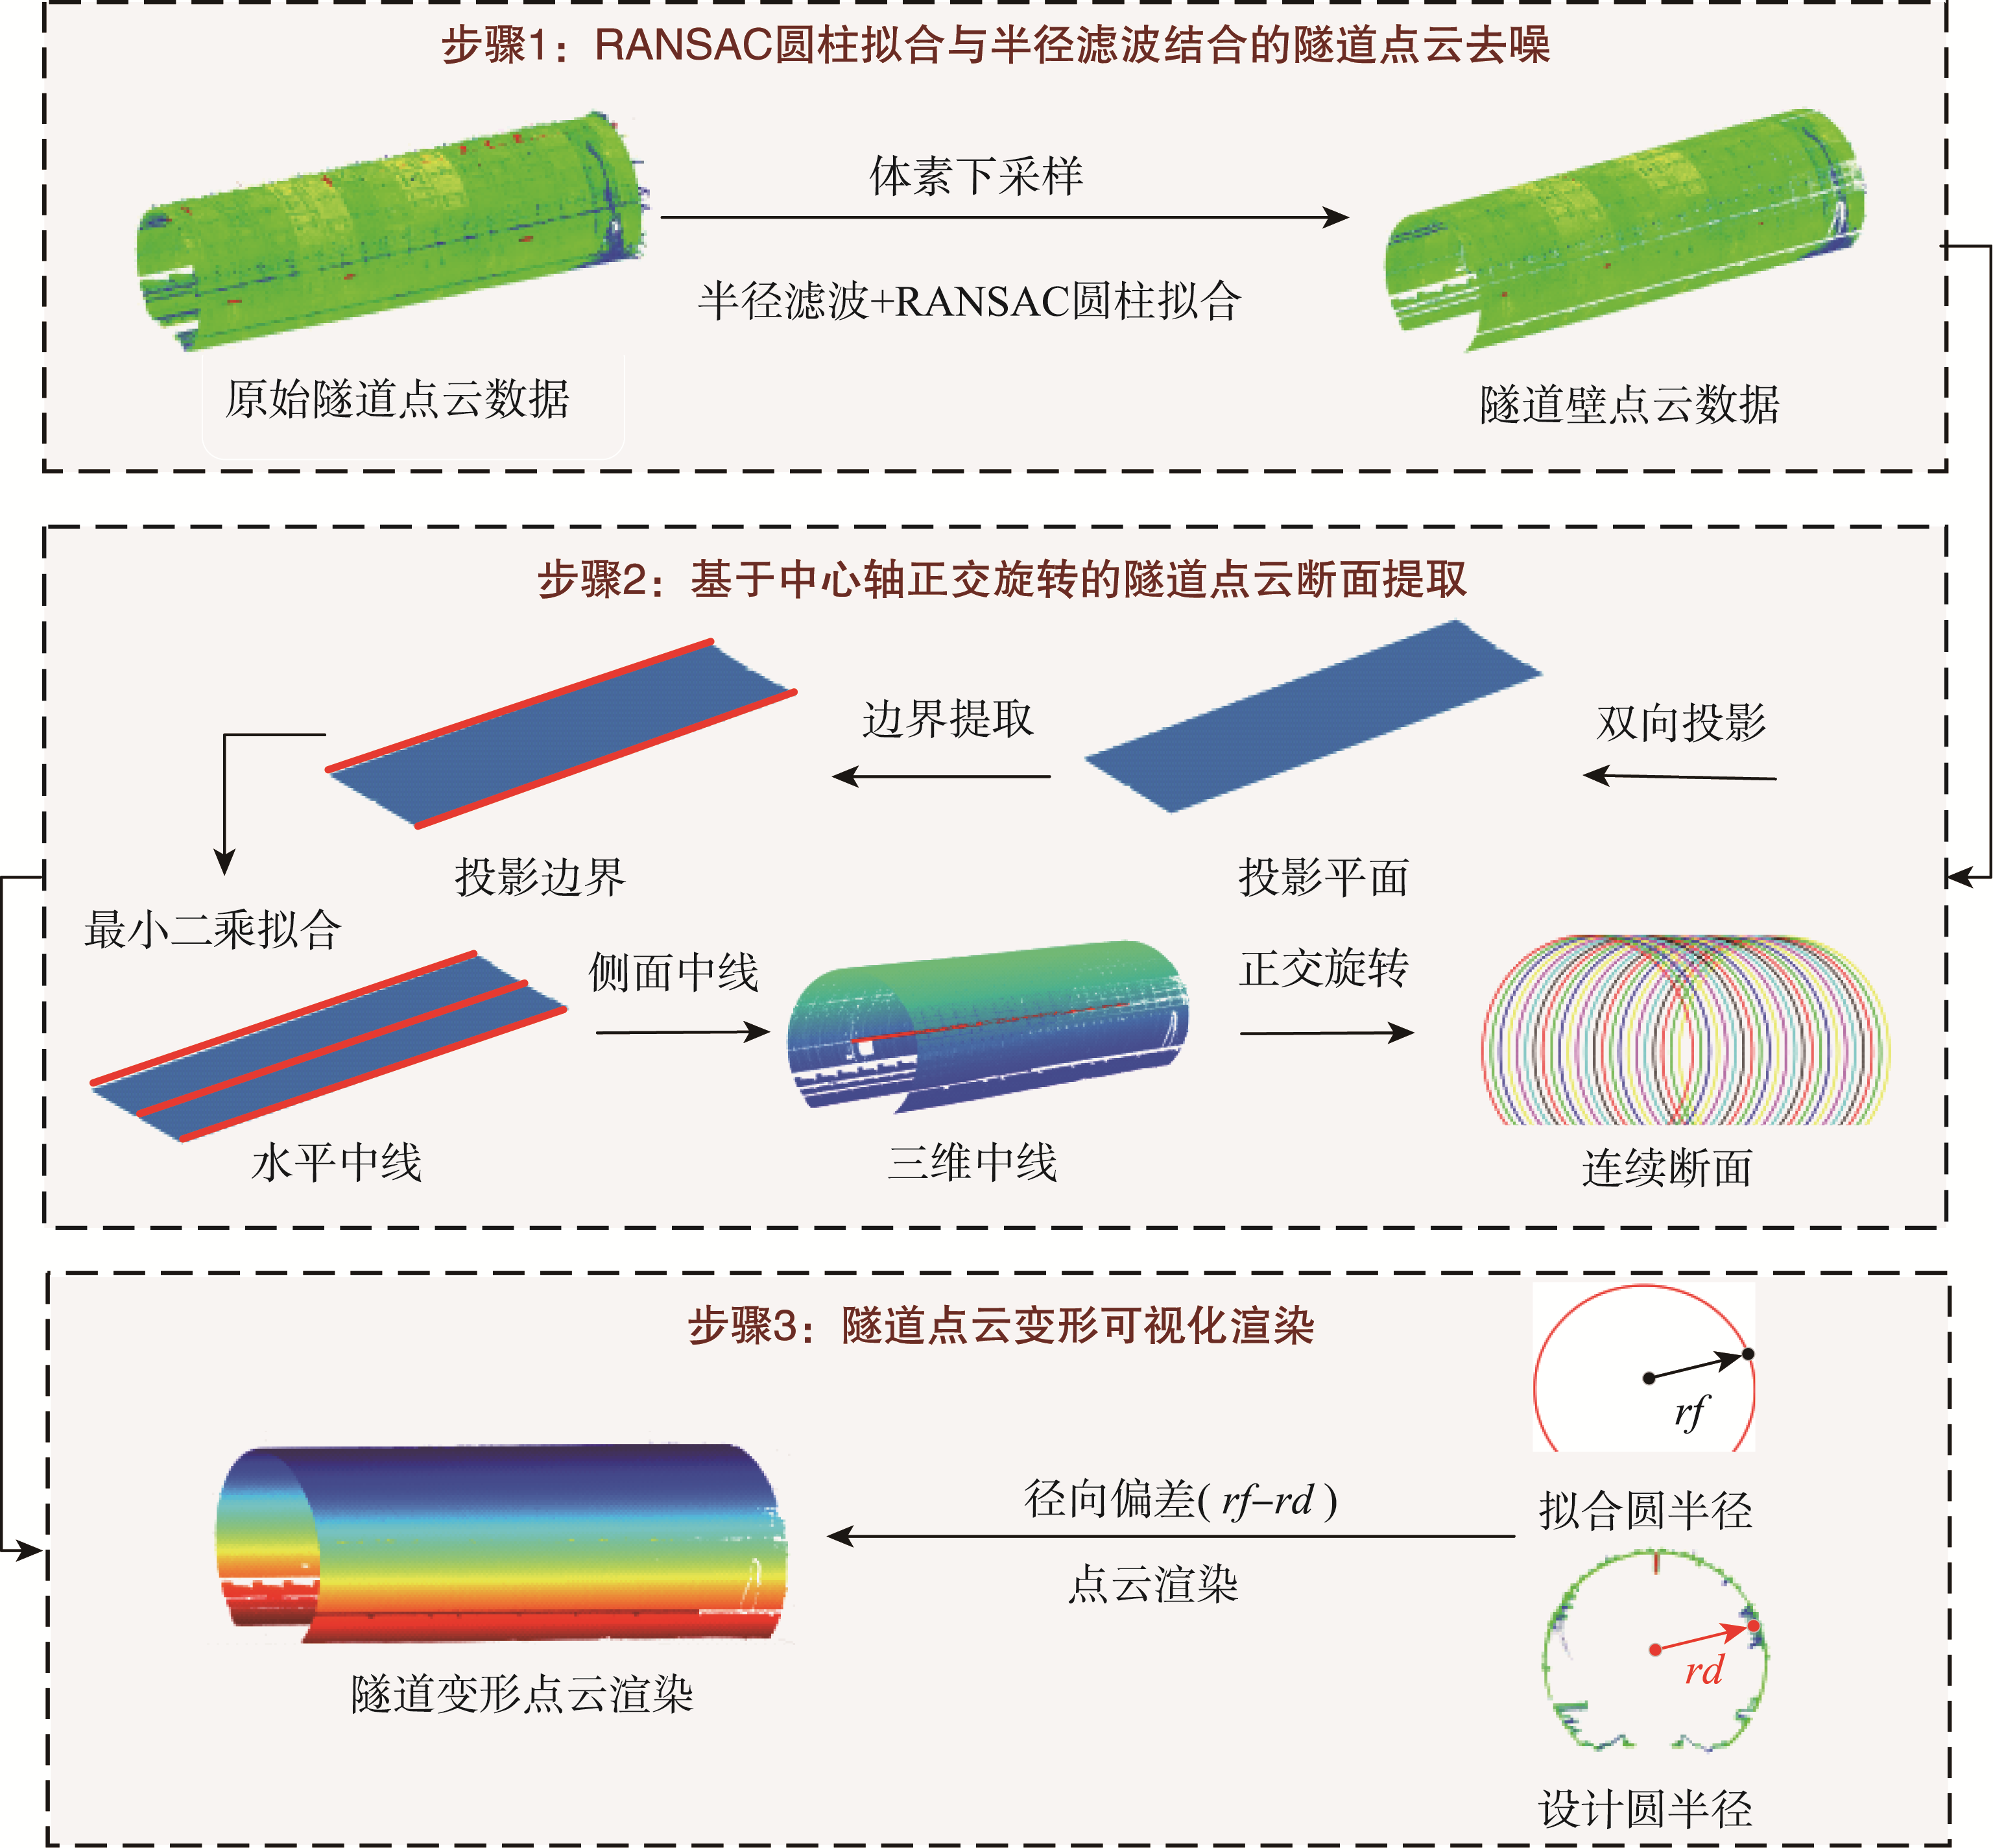
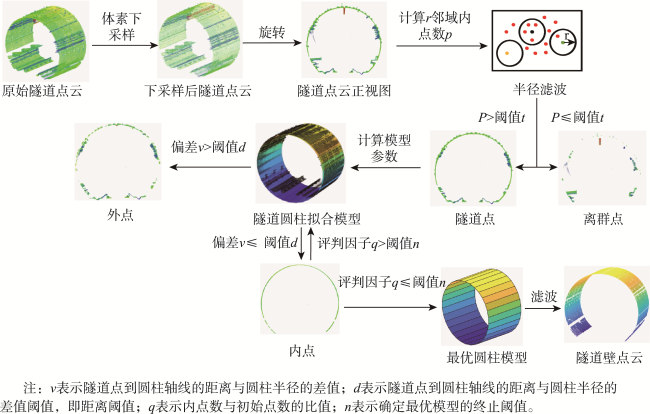
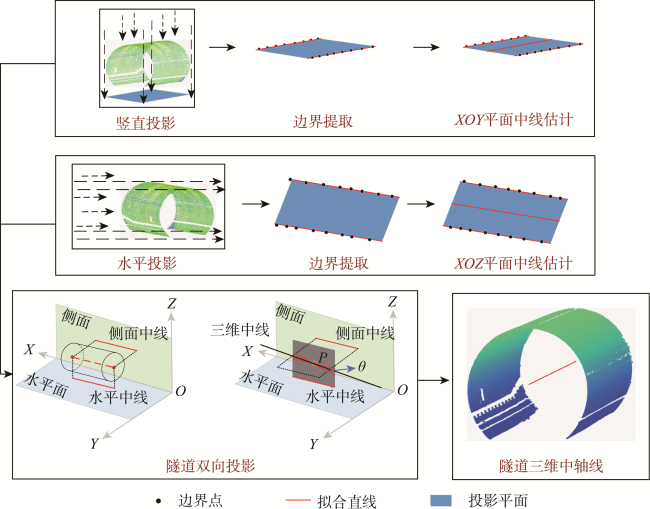
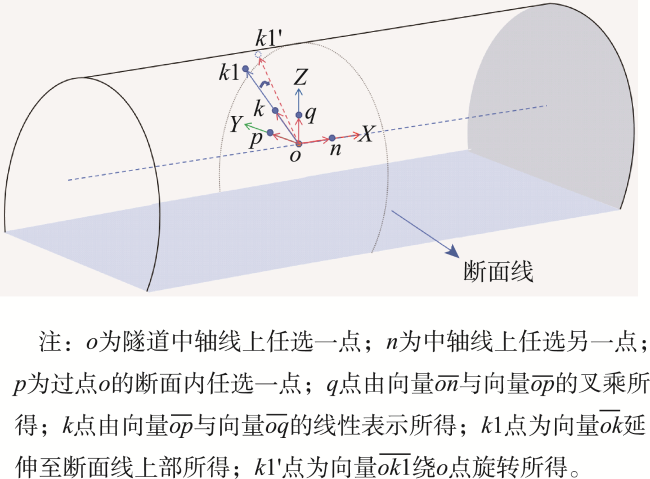
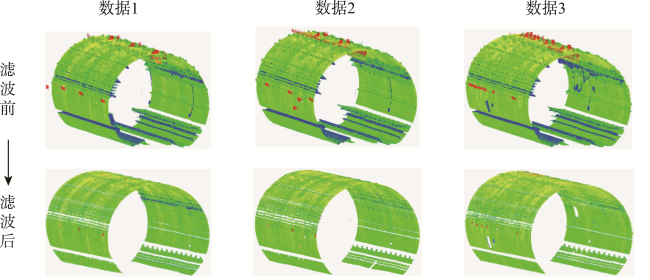
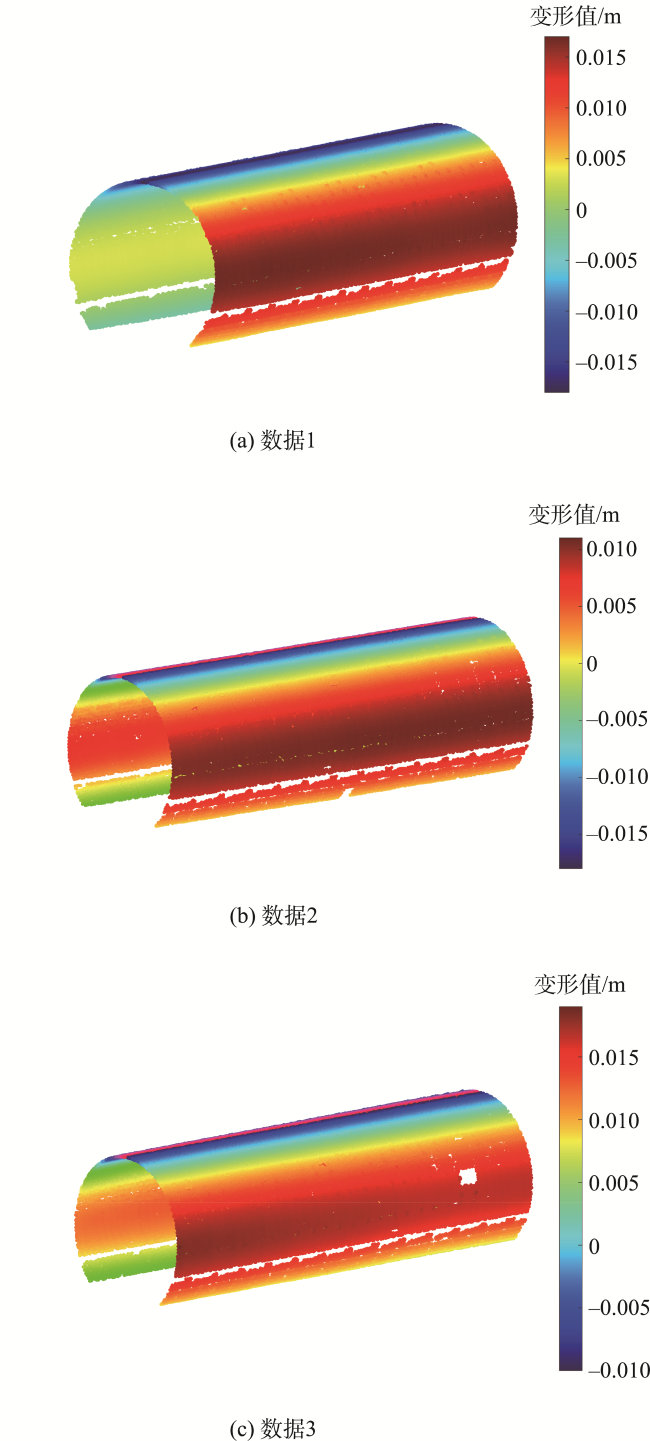
隧道断面的精确提取是隧道形变分析中的一个关键环节,然而,隧道内部复杂的形状和环境使得点云处理算法变得复杂,传统的断面提取与变形分析算法已经不适用于点云数据,因此亟需更高效和更鲁棒的算法。针对这一问题,本文提出了一种基于点云数据的隧道断面连续提取方法。首先,引入结合随机样本一致性(Random Sample Consensus,RANSAC)圆柱拟合与半径滤波的方法,以有效滤除离群点及附着在隧道壁上的噪声点;接着,通过双向投影获取隧道中轴线,并根据“与隧道中轴线正交旋转的直线相交于隧道壁”建立数学模型,从而实现对隧道点云断面的连续提取;最后,以断面点的拟合圆心坐标和设计半径为参数计算隧道的形变量,并通过可视化渲染直观展示隧道整体变形情况。为证明本文方法的有效性,实验选取了成都市某地铁线路三段地铁隧道的激光点云数据,结果表明,该方法滤除噪声时I类误差、II类误差和总误差均值分别为1.48%、1.03%和1.21%,Kappa系数达到97.45%。相比传统的最小二乘法、密度聚类法以及法向偏差法,本方法的3类误差之和分别降低了9.34%、10.61%和4.41%,Kappa系数则提高了5.36%、6.38%和3.65%。这充分展现出本方法更优越的鲁棒性和准确性;此外,该方法所提取出的隧道断面拟合半径与设计半径的偏差均值低至1.36 mm。相比目前的1.60 mm方法及6.00 mm方法,本文方法的偏差均值分别降低了2.5 mm和2.7 mm。而求得隧道形变量范围在0~18 mm之间,同时通过点云渲染方式直观展示了隧道整体变形情况。本研究的方法为隧道安全监测工作提供了可靠依据和基础支持。
王铁星 , 魏冠军 , 王永鑫 . 基于中心轴正交旋转的点云数据隧道断面提取方法[J]. 地球信息科学学报, 2024 , 26(12) : 2759 -2771 . DOI: 10.12082/dqxxkx.2024.240505
The accurate extraction of tunnel sections is a pivotal step in tunnel deformation analysis. However, due to inadequate illumination, the reflection and occlusion caused by dust and structural elements generate noise and erroneous points in the point cloud data, complicating data processing. Additionally, the intricate geometry of tunnel features, such as curved surfaces, corners, and cracks, renders traditional section extraction algorithms ineffective for point cloud data. Consequently, there is an urgent need for more efficient and robust algorithms. To address this issue, this paper proposes a method for continuous tunnel section extraction based on laser point cloud data. First, a combination filtering method is introduced, integrating Random Sample Consensus (RANSAC) cylindrical fitting and radius filtering to effectively remove scattered outliers and noise points adhering to the tunnel walls with sparse density. Next, the tunnel central axis is obtained via bidirectional projection, and a mathematical function model is established in line with the principle that ‘a straight line intersecting the tunnel central axis intersects the tunnel wall’, enabling the continuous extraction of tunnel section point clouds. Finally, the fitting center coordinates of the section points and the tunnel design radius are used as parameters to calculate the radial deviation of the tunnel points, representing the shape variables. The tunnel point cloud is visually rendered using these shape variables to display the overall deformation of the tunnel. In this paper, laser point cloud data from three sections of a subway tunnel in Chengdu are used as the experimental data. The results show that the mean values of Class I error, Class II error, and total error are 1.48%, 1.03%, and 1.21%, respectively, with the Kappa coefficient reaching 97.45% when using this method for noise filtering. Compared to traditional methods such as least squares, density clustering, and normal deviation algorithms, this method reduces cumulative errors by 9.34%, 10.61%, and 4.41%, respectively, while increasing the Kappa coefficient by 5.36%, 6.38%, and 3.65%. This demonstrates the enhanced robustness and accuracy of the proposed method. Moreover, the mean deviation between the tunnel section fitting radius obtained through this method and the design radius is merely 1.36 mm, compared to deviations of 1.60 mm and 6.00 mm with existing methods, achieving reductions of 2.5 mm and 2.7 mm, respectively. The range of the tunnel shape variable is between 0 and 18 mm, and the overall deformation of the tunnel is visually displayed through point cloud rendering. The method provides a reliable foundation and essential support for tunnel safety monitoring.
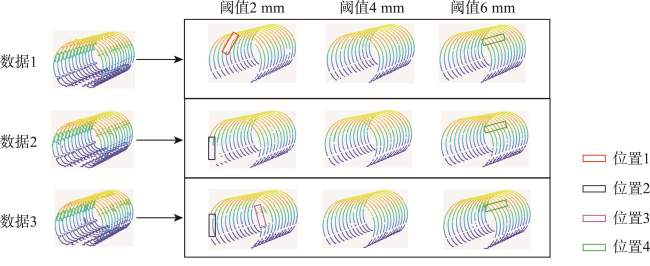
表1 不同断面对应不同阈值的圆柱模型7个参数及滤波后点数Tab. 1 Seven parameters and filtered points of cylindrical model with different cross-sections corresponding to different thresholds |
| 数据 | 阈值/mm | 轴线上一点(x, y, z)/m | 方向向量(a, b, c) | 半径r/m | 滤波后点数/个 |
|---|---|---|---|---|---|
| 数据1 | 2 | (112.045, 0.018, 1.856) | (1.001, 0.026, 0.001) | 2.754 | 18 712 |
| 4 | (112.041, 0.017, 1.858) | (1.004, 0.024, 0.002) | 2.751 | 19 572 | |
| 6 | (112.042, 0.018, 1.856) | (1.003, 0.027, 0.007) | 2.753 | 20 604 | |
| 数据2 | 2 | (131.066, -0.068, 1.859) | (1.006, 0.019, 0.005) | 2.745 | 16 589 |
| 4 | (131.069, -0.065, 1.864) | (1.002, 0.014, 0.001) | 2.752 | 17 303 | |
| 6 | (131.061,- 0.068, 1.866) | (1.004, 0.022, 0.002) | 2.743 | 18 500 | |
| 数据3 | 2 | (150.514, 0.054, 1.854) | (1.005, 0.006, 0.007) | 2.746 | 17 910 |
| 4 | (150.507, 0.059, 1.857) | (1.001, 0.003, 0.010) | 2.749 | 18 804 | |
| 6 | (150.511, 0.063, 1.852) | (0.998, 0.002, 0.003) | 2.744 | 19 801 |
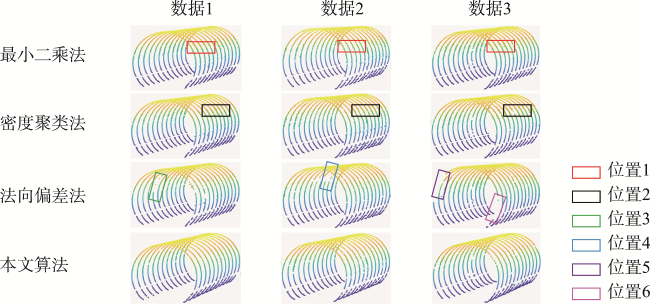
表2 用于不同断面的滤波算法参数Tab. 2 Parameters of filtering algorithm for different sections |
| 数据 | 滤波算法 | a0 | b0 | c0 | d0 |
|---|---|---|---|---|---|
| 数据1 | 最小二乘法 | 11 047 | 1 122 | 132 | 19 527 |
| 密度聚类法 | 10 989 | 1 180 | 257 | 19 402 | |
| 法向偏差法 | 12 041 | 128 | 903 | 18 756 | |
| 本文算法 | 11 973 | 196 | 269 | 19 390 | |
| 数据2 | 最小二乘法 | 10 577 | 1 064 | 62 | 17 198 |
| 密度聚类法 | 10 441 | 1 200 | 98 | 17 162 | |
| 法向偏差法 | 11 547 | 94 | 546 | 16 714 | |
| 本文算法 | 11 483 | 158 | 115 | 17 145 | |
| 数据3 | 最小二乘法 | 10 664 | 945 | 84 | 18 884 |
| 密度聚类法 | 10 712 | 897 | 169 | 18 799 | |
| 法向偏差法 | 11 528 | 81 | 981 | 17 987 | |
| 本文算法 | 11 437 | 172 | 201 | 18 767 |
表3 用于不同断面的滤波算法评估指标Tab. 3 Evaluation index of filtering algorithm for different sections |
| 数据 | 去噪算法 | TypeI/% | TypeII/% | Total/% | Kappa/% | 时间/s |
|---|---|---|---|---|---|---|
| 数据1 | 最小二乘法 | 9.22 | 0.67 | 3.94 | 91.53 | 15.78 |
| 密度聚类法 | 9.70 | 1.31 | 4.51 | 90.31 | 6.67 | |
| 法向偏差法 | 1.05 | 4.60 | 3.24 | 93.22 | 9.13 | |
| 本文算法 | 1.61 | 1.37 | 1.46 | 96.91 | 8.32 | |
| 数据2 | 最小二乘法 | 9.14 | 0.36 | 3.90 | 92.00 | 11.49 |
| 密度聚类法 | 10.31 | 0.57 | 4.49 | 90.40 | 4.31 | |
| 法向偏差法 | 0.81 | 3.16 | 2.21 | 95.43 | 6.99 | |
| 本文算法 | 1.36 | 0.67 | 0.94 | 98.04 | 5.72 | |
| 数据3 | 最小二乘法 | 8.14 | 0.44 | 3.37 | 92.74 | 12.62 |
| 密度聚类法 | 7.73 | 0.89 | 3.49 | 92.50 | 3.98 | |
| 法向偏差法 | 0.70 | 5.17 | 3.47 | 92.74 | 7.18 | |
| 本文算法 | 1.48 | 1.06 | 1.22 | 97.41 | 5.69 |
| [1] |
李勇, 罗尹政, 濮启鹏, 等. 一种适用于隧道场景的激光点云地面滤波和隧道壁及标靶球提取方法[J]. 中国激光, 2023, 50(13):3788/CJL220845.
[
|
| [2] |
|
| [3] |
毛庆洲, 徐浩轩, 朱璟, 等. 利用高密度点云现场检测在建隧道超欠挖[J/OL]. 武汉大学学报(信息科学版):1-12[2024-05-21].
[
|
| [4] |
|
| [5] |
|
| [6] |
|
| [7] |
|
| [8] |
|
| [9] |
|
| [10] |
卞政, 石波, 吴凡, 等. 基于PointNet++进行附属设施语义分割的隧道收敛变形分析[J/OL]. 铁道科学与工程学报:1-13[2024-05-21].
[
|
| [11] |
王耀东, 苏广思, 方恩权, 等. 基于激光雷达的隧道轮廓三维点云重构与形变检测研究[J]. 中南大学学报(自然科学版), 2024, 55(6):2393-2403.
[
|
| [12] |
程云建, 王辉, 仇文革. 基于三维激光点云的隧道掌子面挤出位移场高精度监测方法[J]. 中国公路学报, 2024, 37(7):46-57.
[
|
| [13] |
钱禹航, 王竞雪, 郑雪涛. 结合谱聚类和粒子群改进K-means聚类的机载LiDAR点云单木分割方法[J]. 地球信息科学学报, 2024, 26(9):2177-2191.
[
|
| [14] |
关宇忻, 王竞雪, 许峥辉. 顾及分层动态区域增长的车载LiDAR点云行道树提取方法[J]. 地球信息科学学报, 2024, 26(8):1975-1990.
[
|
| [15] |
韦征, 周臻, 俞旻韬, 等. 基于三维激光扫描点云整体分析的铁路隧道超欠挖检测方法[J]. 铁道学报, 2023, 45(1):135-140.
[
|
| [16] |
韦征, 曾庆谊, 周建强, 等. 基于概率密度的隧道三维激光扫描监测方法[J]. 铁道工程学报, 2023, 40(2):66-72.
[
|
| [17] |
刘新根, 陈莹莹, 刘学增. 激光扫描盾构隧道断面变形快速检测[J]. 交通运输工程学报, 2021, 21(2):107-116.
[
|
| [18] |
程效军, 贾东峰, 刘燕萍, 等. 基于中轴线的隧道点云去噪算法[J]. 同济大学学报(自然科学版), 2015, 43(8):1239-1245.
[
|
| [19] |
|
| [20] |
|
| [21] |
杜黎明, 钟若飞, 孙海丽, 等. 移动激光扫描技术下的隧道横断面提取及变形分析[J]. 测绘通报, 2018,(6):61-67.
[
|
| [22] |
吴廷, 侯阳飞, 鲍金. 基于三维激光点云的隧道中轴线及断面连续提取[J]. 测绘与空间地理信息, 2018, 41(11):85-87.
[
|
| [23] |
|
| [24] |
冯阳, 陈长军, 闫利, 等. 一种基于半圆柱模型的隧道点云中轴线提取与滤波方法[J]. 测绘地理信息, 2021, 46(3):55-59.
[
|
| [25] |
|
| [26] |
|
| [27] |
方俊杰. 基于地面激光扫描仪的隧道断面提取研究[J]. 测绘与空间地理信息, 2021, 44(2):212-214,217.
[
|
| [28] |
|
| [29] |
李先帅, 武斌. 基于椭圆拟合的隧道点云数据去噪方法[J]. 铁道科学与工程学报, 2021, 18(3):713-719.
[
|
| [30] |
柳斌, 李雪梅. 一种基于激光雷达点云的自适应双半径滤波算法[J]. 兵工学报, 2023, 44(9):2768-2777.
[
|
| [31] |
|
| [32] |
曹桂萍, 刘行思, 刘念, 等. 基于激光三维点云分割地铁隧道壁表面物体[J]. 光学学报, 2020, 40(21):38-46.
[
|
| [33] |
邓辉, 蓝秋萍, 廖威, 等. 基于法向偏差的隧道点云去噪算法[J]. 测绘工程, 2018, 27(1):59-63.
[
|
/
| 〈 |
|
〉 |
