
基于时空统计建模的主要类型癌症全球疾病负担变化研究
作者贡献:Author Contributions
申力、徐瑱梵、卢宾宾参与实验设计;申力和徐瑱梵完成实验操作;申力、徐瑱梵、艾明耀、卢宾宾参与论文的写作和修改。所有作者均阅读并同意最终稿件的提交。
The study was designed by SHEN Li, XU Zhenfan and LU Binbin. The experimental operation was completed by SHEN Li and XU Zhenfan. The manuscript was drafted and revised by SHEN Li, XU Zhenfan, AI Mingyao and LU Binbin. All the authors have read the last version of paper and consented to submission.
|
申 力(1986— ),女,河北张家口人,博士,副教授,主要从事时空大数据挖掘应用研究。E-mail: shenli1986@whu.edu.cn |
收稿日期: 2024-09-20
修回日期: 2024-11-25
网络出版日期: 2025-03-06
基金资助
国家自然科学基金项目(42201448)
国家自然科学基金项目(42071368)
中央高校自主科研项目项目(2042022dx0001)
A Spatio-Temporal Modeling Study on the Global Disease Burden of Major Types of Cancers
Received date: 2024-09-20
Revised date: 2024-11-25
Online published: 2025-03-06
Supported by
National Natural Science Foundation of China(42201448)
National Natural Science Foundation of China(42071368)
The Fundamental Research Funds for the Central Universities, China(2042022dx0001)
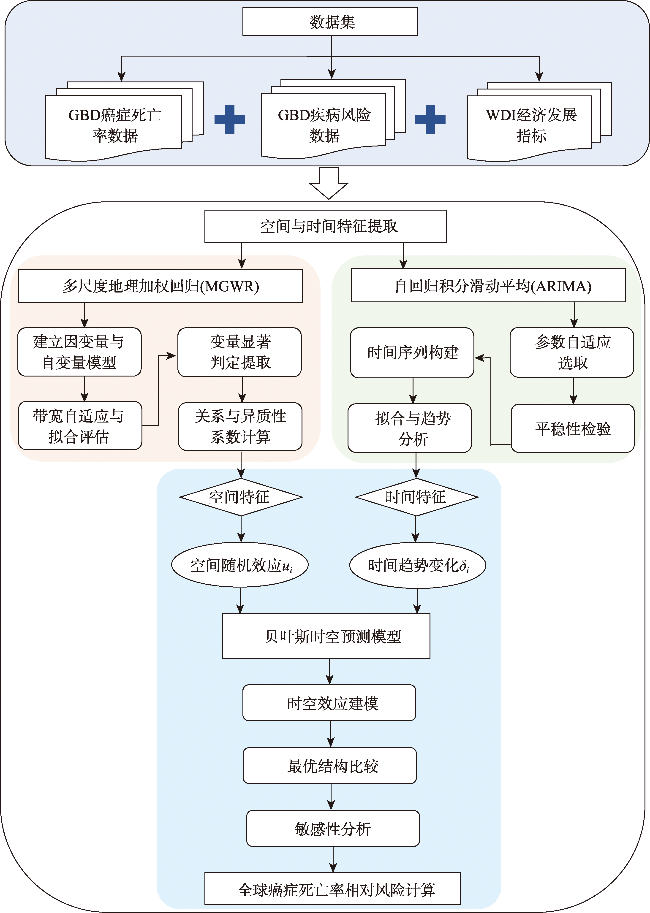
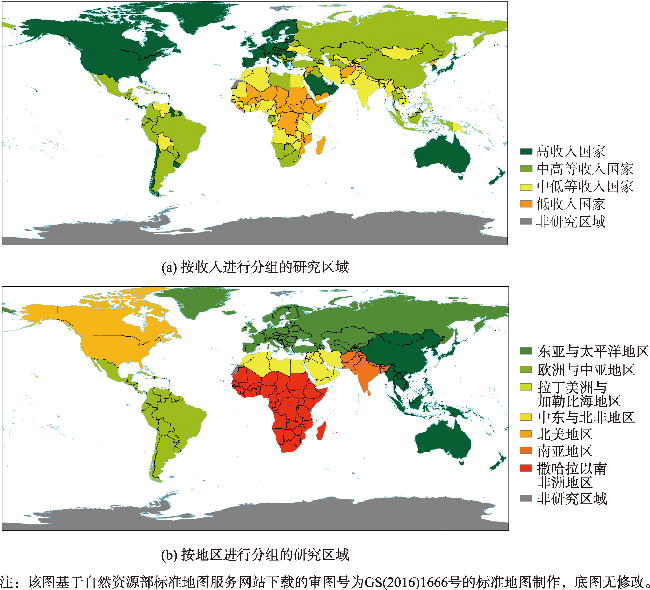
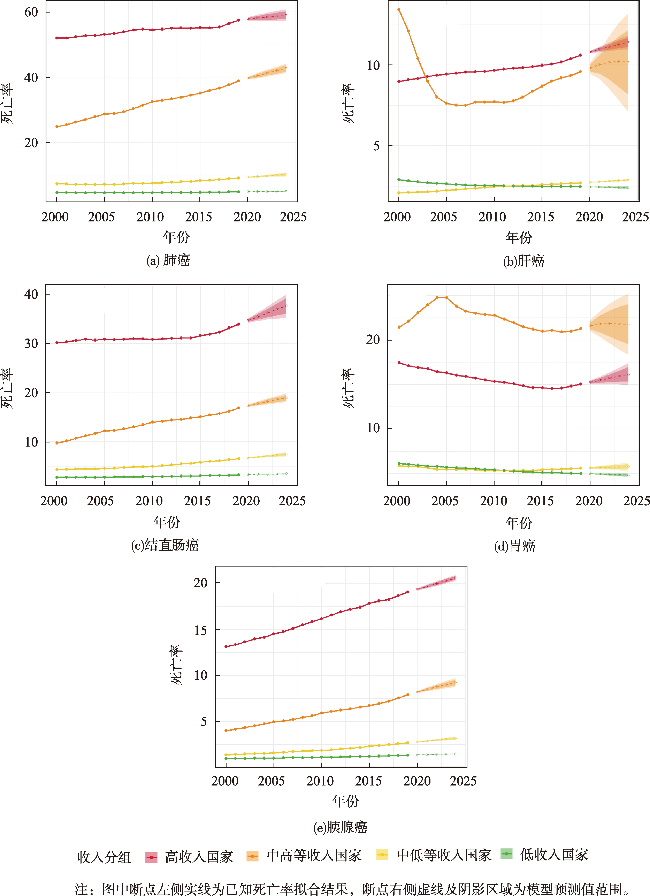
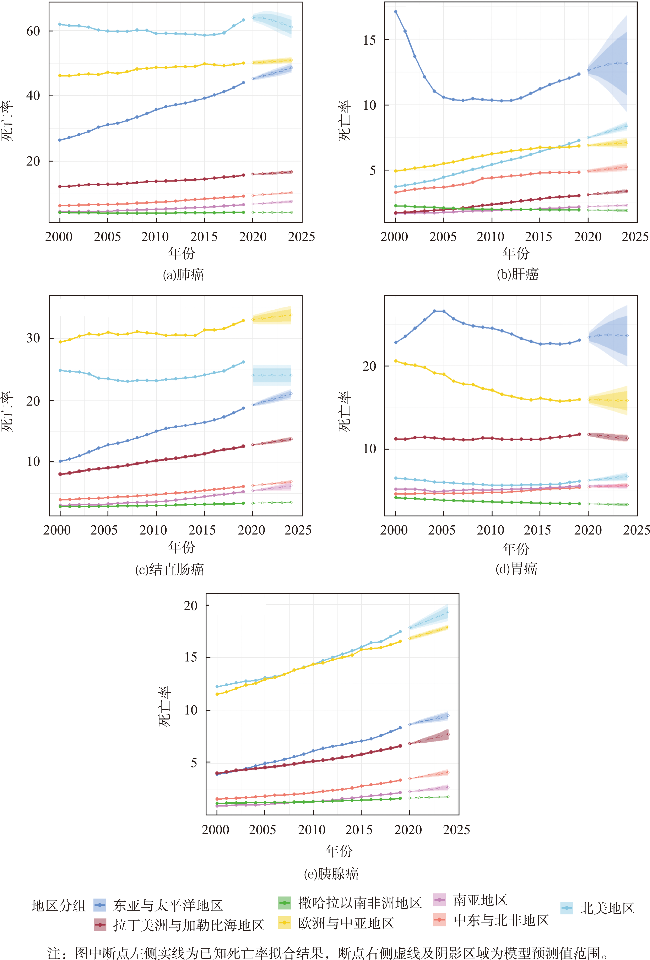
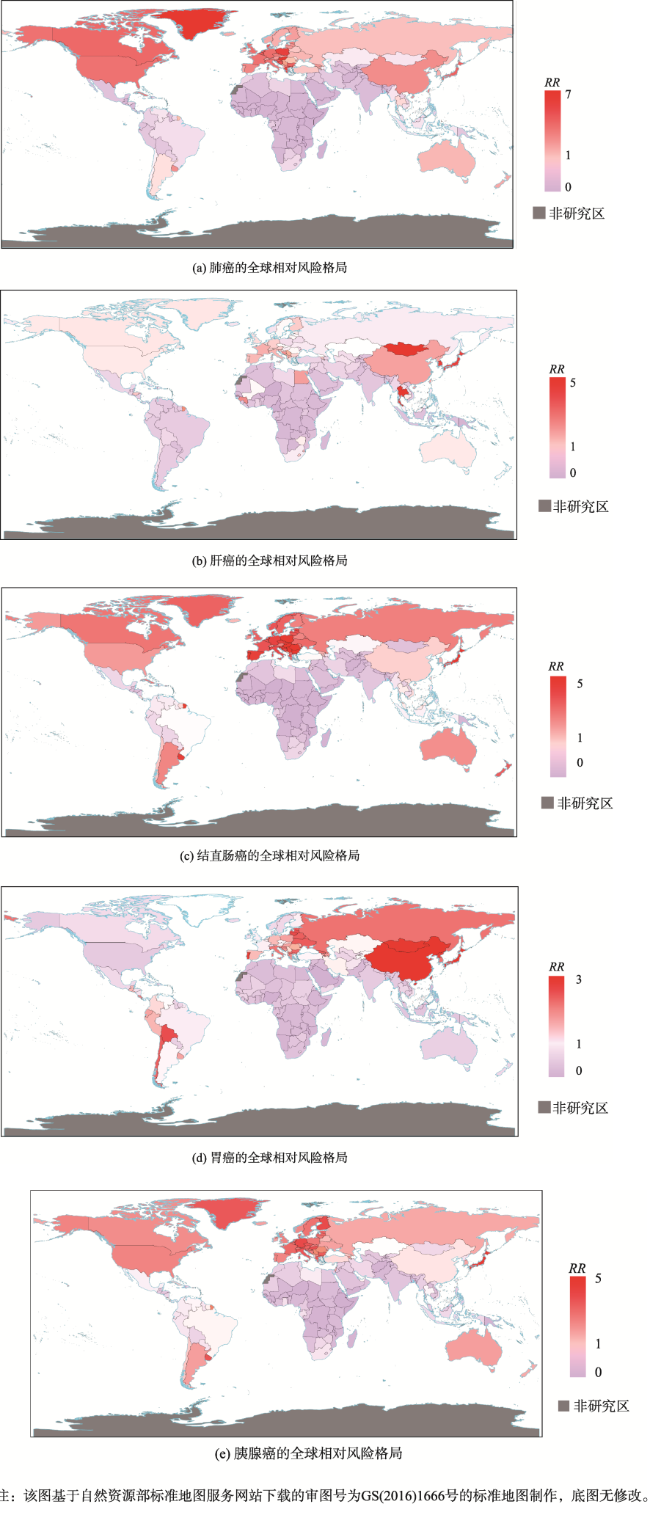
【目的】 癌症是全球绝大多数国家的主要致病死因,对人类寿命和公共卫生构成了严重威胁。本文探讨了全球五类主要癌症死亡率的时空分布特征,并给出了未来发展趋势预测。【方法】 本文针对2011—2019年全球200个国家五类主要癌症(肺癌、结直肠癌、胃癌、肝癌与胰腺癌),采用GBD数据与世界银行数据库资料,基于MGWR模型提取各类癌症死亡率影响因素的空间异质性特征,利用ARIMA模型提取各类癌症死亡率的时间变化趋势特征,并将该时空信息作为参数输入构建贝叶斯时空模型,对全球主要类型癌症死亡风险进行预测评估。【结果】 研究发现,全球五类癌症死亡率均持续增加, 2019年各类癌症死亡率较2011年平均上升了17.2/100 000人。全球超过72.8%的国家癌症死亡相对风险较高(RR>1),呈现出明显的空间聚集性。【结论】 相比非洲与南亚地区,欧洲、中亚、北美、东亚及太平洋地区癌症死亡率增速较快。相比中低收入和低收入国家,高收入和中高收入国家各类癌症死亡率上升趋势明显,相对风险更高。65岁及以上人口占比、吸烟、酒精、低运动强度、高糖加工饮食、人均GDP、人均GNI和人均医疗卫生支出成为全球主要类型癌症死亡风险的关键影响因素。本研究通过集成不同地理时空分析方法优势,创新性构建了涵括时空分组变量和不同影响因素的疾病风险时空预测模型,灵活度高,可解释性强,更适用于量化时空非平稳性关系,能够有效评估全球不同地区主要类型癌症死亡的相对风险,加深了地理空间建模技术与流行病研究的交叉融合,对严峻的全球癌症防控规划具有重大科学意义。

申力 , 徐瑱梵 , 艾明耀 , 卢宾宾 . 基于时空统计建模的主要类型癌症全球疾病负担变化研究[J]. 地球信息科学学报, 2025 , 27(3) : 698 -715 . DOI: 10.12082/dqxxkx.2025.240528
[Objectives] Cancer is the leading cause of death in most countries worldwide, posing a significant threat to human longevity and public health. This study explores the spatiotemporal distribution characteristics of mortality rates for five major types of cancer worldwide and provides predictions for future trends. [Methods] Aiming at five major cancer types (lung, colorectal, gastric, liver, and pancreatic cancer) in 200 countries from 2011 to 2019, this study used GBD and World Bank data to extract spatial heterogeneity of the factors affecting cancer mortality using the MGWR model. The ARIMA model was used to extract temporal trend characteristics of various cancer mortality rates. Such spatial-temporal information was integrated into a Bayesian spatial-temporal model to predict and evaluate the global mortality risk for the five types of cancer. [Results] Results revealed that global death rate for all five cancer types increased, with an average rise of 17.2 deaths per 100 000 people in 2019 compared to 2011. Over 72.8% of countries exhibited a high relative risk of cancer death (RR>1), indicating significant spatial clustering. [Conclusions] Regions such as Europe, Central Asia, North America, and East Asia and the Pacific experienced faster increases in cancer death rates compared to Africa and South Asia. Compared to low- and middle-income countries, middle-high- and high-income countries showed a more pronounced upward trend in cancer mortality and a higher relative risk. Key factors influencing global cancer mortality included the percentage of the population aged 65 years and older, smoking, alcohol consumption, low physical activity, high sugar diets, GDP per capita, GNI per capita, and health expenditure per capita. By integrating the advantages of different geographical spatial-temporal analysis methods, this study developed an innovative spatiotemporal prediction model of disease risk that integrates spatial-temporal grouping variables and multiple influencing factors. This proposed model is highly flexible, interpretable, and better suited for quantifying non-stationarity spatial-temporal relationships. While the structured spatial and temporal effects increase computational demands, the model effectively assesses cancer mortality risk across regions, offering robust insights into the spatiotemporal dynamics of disease. This approach deepens the integration of geospatial modeling technology and epidemiological research, providing significant scientific contributions to global cancer research, prevention, and control planning.
表1 纳入本研究的全球主要癌症不同影响因素Tab. 1 Different influencing factors of global major cancers included in the study |
| 影响因素(中文) | 影响因素(英文) | 数据来源 | 衡量指标 |
|---|---|---|---|
| 65岁及以上人口占比 | Population ages 65 and above | WDI | 百分比/% |
| 低运动强度 | Low physical activity | GBD | SEV/% |
| 高空腹血糖 | High fasting plasma glucose | GBD | SEV/% |
| 高体重指数人群 | High body-mass index | GBD | SEV/% |
| 酒精 | Alcohol use | GBD | SEV/% |
| 空气污染 | Air pollution | GBD | SEV/% |
| 吸烟 | Smoking | GBD | SEV/% |
| 饮食中低膳食纤维 | Diet low in fiber | GBD | SEV/% |
| 饮食中高含糖饮料 | Diet high in sugar-sweetened beverages | GBD | SEV/% |
| 饮食中高红肉 | Diet high in red meat | GBD | SEV/% |
| 饮食中高加工肉类 | Diet high in processed meat | GBD | SEV/% |
| 职业致癌物暴露 | Occupational carcinogens | GBD | SEV/% |
| GDP | GDP | WDI | 2015不变价美元/USD |
| GNI | GNI | WDI | 2015不变价美元/USD |
| PM2.5 | PM2.5 | WDI | 年平均浓度/(μg/m3) |
| 人均GDP | GDP per capita | WDI | 2015不变价美元/USD |
| 人均GNI | GNI per capita | WDI | 2015不变价美元/USD |
| 人均医疗卫生支出 | Health expenditure per capita | WDI | 现价美元/USD |
| 乙型肝炎病毒 | Total burden related to hepatitis B | GBD | SEV/% |
| 丙型肝炎病毒 | Total burden related to hepatitis C | GBD | SEV/% |
| 糖尿病 | Diabetes | GBD | SEV/% |
表2 各类型癌症所选影响因素Tab. 2 Selected influencing factors for different types of cancer |
| 影响因素 | 肺癌 | 肝癌 | 结直肠癌 | 胃癌 | 胰腺癌 |
|---|---|---|---|---|---|
| 65岁及以上人口占比 | √ | √ | √ | √ | √ |
| 低运动强度 | √ | √ | √ | ||
| 高空腹血糖 | √ | √ | √ | ||
| 高体重指数人群 | √ | √ | √ | ||
| 酒精 | √ | √ | √ | √ | |
| 空气污染 | √ | ||||
| 吸烟 | √ | √ | √ | ||
| 饮食中低膳食纤维 | √ | √ | |||
| 饮食中高含糖饮料 | √ | √ | |||
| 饮食中高红肉 | √ | √ | |||
| 饮食中高加工肉类 | √ | √ | |||
| 职业致癌物暴露 | √ | ||||
| GDP | √ | √ | √ | √ | √ |
| GNI | √ | √ | √ | √ | √ |
| PM2.5 | √ | ||||
| 人均GDP | √ | √ | √ | √ | √ |
| 人均GNI | √ | √ | √ | √ | √ |
| 人均医疗卫生支出 | √ | √ | √ | √ | √ |
| 乙型肝炎病毒 | √ | ||||
| 丙型肝炎病毒 | √ | ||||
| 糖尿病 | √ | √ | √ |
表3 多尺度地理加权回归模型指标Tab. 3 Indicators for the Multiscale Geographically Weighted Regression Model |
| 癌种 | 模型指标 | 总体 | 男性 | 女性 |
|---|---|---|---|---|
| 肺癌 | 拟合优度R2 | 0.926 | 0.914 | 0.878 |
| AICc | 90.173 | 113.398 | 155.190 | |
| 有效参数数量v1 | 22.134 | 23.055 | 20.090 | |
| 残差平方和 | 10.720 | 12.366 | 17.525 | |
| 肝癌 | 拟合优度R2 | 0.724 | 0.656 | 0.804 |
| AICc | 318.903 | 346.099 | 285.007 | |
| 有效参数数量v1 | 34.698 | 33.310 | 38.735 | |
| 残差平方和 | 39.693 | 49.604 | 28.264 | |
| 结直肠癌 | 拟合优度R2 | 0.953 | 0.934 | 0.941 |
| AICc | 60.175 | 97.592 | 73.188 | |
| 有效参数数量v1 | 33.635 | 30.298 | 27.666 | |
| 残差平方和 | 6.757 | 9.481 | 8.489 | |
| 胃癌 | 拟合优度R2 | 0.823 | 0.804 | 0.802 |
| AICc | 244.808 | 248.714 | 257.056 | |
| 有效参数数量v1 | 31.807 | 28.461 | 30.608 | |
| 残差平方和 | 25.446 | 28.224 | 28.490 | |
| 胰腺癌 | 拟合优度R2 | 0.954 | 0.959 | 0.945 |
| AICc | 22.880 | 17.969 | 35.638 | |
| 有效参数数量v1 | 22.369 | 27.101 | 18.431 | |
| 残差平方和 | 6.687 | 5.857 | 7.885 |
表4 显著变量的回归系数统计描述Tab. 4 Statistical description of regression coefficients for significant variables |
| 癌种 | 自变量 | 均值 | 标准差 | 带宽 |
|---|---|---|---|---|
| 肺癌 | 常数项 | -0.279 | 0.117 | 61 |
| 65岁及以上人口占比 | 0.518 | 0.007 | 143 | |
| 吸烟 | 0.448 | 0.302 | 43 | |
| 肝癌 | 常数项 | 0.079 | 0.257 | 44 |
| 人均GDP | 0.618 | 0.232 | 49 | |
| 丙型肝炎病毒 | 0.210 | 0.328 | 43 | |
| 结直 肠癌 | 常数项 | -0.062 | 0.004 | 143 |
| 65岁及以上人口占比 | 0.952 | 0.025 | 115 | |
| 低运动强度 | -0.065 | 0.097 | 44 | |
| 饮食中高含糖饮料 | 0.159 | 0.095 | 50 | |
| 饮食中高加工肉类 | -0.098 | 0.006 | 143 | |
| 人均GDP | -0.314 | 0.103 | 45 | |
| 人均GNI | 0.523 | 0.006 | 141 | |
| 人均医疗卫生支出 | -0.355 | 0.005 | 141 | |
| 胃癌 | 常数项 | -0.013 | 0.108 | 99 |
| 65岁及以上人口占比 | 0.828 | 0.011 | 143 | |
| 低运动强度 | -0.063 | 0.112 | 54 | |
| 饮食中高含糖饮料 | -0.068 | 0.054 | 111 | |
| 饮食中高红肉 | 0.198 | 0.149 | 61 | |
| 吸烟 | -0.106 | 0.066 | 105 | |
| 人均医疗卫生支出 | -0.503 | 0.007 | 143 | |
| 胰腺癌 | 常数项 | -0.055 | 0.027 | 117 |
| 65岁及以上人口占比 | 0.657 | 0.007 | 117 | |
| 高空腹血糖 | -0.408 | 0.014 | 143 | |
| 糖尿病 | 0.431 | 0.098 | 43 | |
| 吸烟 | 0.088 | 0.011 | 114 | |
| 酒精 | 0.083 | 0.008 | 119 | |
| GDP | -3.863 | 0.002 | 143 | |
| GNI | 3.885 | 0.002 | 143 |
表5 按收入分组的各类型癌症死亡率相对风险均值Tab. 5 Mean relative risk of mortality from various types of cancer by income group |
| 收入组 | 死亡率相对风险均值 | ||||
|---|---|---|---|---|---|
| 肺癌 | 肝癌 | 结直肠癌 | 胃癌 | 胰腺癌 | |
| 高收入国家 | 1.799 | 1.197 | 2.342 | 1.027 | 2.518 |
| 中高等收入国家 | 1.024 | 0.985 | 1.244 | 0.960 | 1.285 |
| 中低等收入国家 | 0.424 | 0.845 | 0.506 | 0.609 | 0.475 |
| 低收入国家 | 0.202 | 0.507 | 0.251 | 0.415 | 0.230 |
表6 按地区分组的各类型癌症死亡率相对风险均值Tab. 6 Mean relative risk of mortality from various types of cancer by region |
| 地区 | 死亡率相对风险均值 | ||||
|---|---|---|---|---|---|
| 肺癌 | 肝癌 | 结直肠癌 | 胃癌 | 胰腺癌 | |
| 东亚与太平洋地区 | 1.004 | 1.868 | 1.025 | 0.898 | 0.933 |
| 拉丁美洲与加勒比海地区 | 0.674 | 0.594 | 1.269 | 1.010 | 1.224 |
| 撒哈拉以南非洲地区 | 0.233 | 0.535 | 0.355 | 0.383 | 0.363 |
| 欧洲与中亚地区 | 2.174 | 1.272 | 2.581 | 1.281 | 2.798 |
| 南亚地区 | 0.264 | 0.402 | 0.362 | 0.383 | 0.354 |
| 中东与北非地区 | 0.474 | 0.502 | 0.621 | 0.355 | 0.730 |
| 北美地区 | 2.342 | 1.075 | 2.450 | 0.654 | 2.907 |
表7 全球各地区主要类型癌症死亡风险与关键诱因Tab. 7 Mortality risk for global major types of cancer and their key drivers by region |
| 地区 | 癌种 | 死亡风险 | 关键诱因 |
|---|---|---|---|
| 东亚与 太平洋地区 | 肺癌 | 较高 | 吸烟、工业污染、老龄化人口 |
| 肝癌 | 高 | 丙型肝炎病毒感染、酒精摄入 | |
| 结直肠癌 | 较高 | 高加工肉类饮食、高含糖饮料摄入 | |
| 胃癌 | 高 | 高红肉饮食、高盐饮食、幽门螺旋杆菌感染 | |
| 胰腺癌 | 较高 | 高空腹血糖、糖尿病、吸烟 | |
| 拉丁美洲与 加勒比海地区 | 肺癌 | 较低 | 吸烟 |
| 肝癌 | 低 | 酒精摄入、低运动强度 | |
| 结直肠癌 | 低 | 低运动强度 | |
| 胃癌 | 低 | 高盐饮食、低运动强度 | |
| 胰腺癌 | 较低 | 吸烟、酒精 | |
| 撒哈拉以南 非洲地区 | 肺癌 | 低 | 吸烟 |
| 肝癌 | 低 | 无明显诱因 | |
| 结直肠癌 | 低 | 高加工肉类饮食 | |
| 胃癌 | 低 | 无明显诱因 | |
| 胰腺癌 | 低 | 高空腹血糖、糖尿病 | |
| 欧洲与中亚地区 | 肺癌 | 高 | 吸烟 |
| 肝癌 | 高 | 酒精摄入、脂肪性肝炎 | |
| 结直肠癌 | 高 | 低运动强度、高含糖饮料摄入、高加工肉类饮食 | |
| 胃癌 | 较高 | 高盐饮食、幽门螺旋杆菌感染 | |
| 胰腺癌 | 高 | 吸烟、酒精、高空腹血糖 | |
| 南亚地区 | 肺癌 | 低 | 吸烟 |
| 肝癌 | 低 | 丙型肝炎病毒感染 | |
| 结直肠癌 | 低 | 高含糖饮料摄入、高加工肉类饮食 | |
| 胃癌 | 较低 | 高红肉饮食 | |
| 胰腺癌 | 低 | 高空腹血糖、吸烟 | |
| 中东与北非地区 | 肺癌 | 低 | 吸烟 |
| 肝癌 | 低 | 无明显诱因 | |
| 结直肠癌 | 低 | 高含糖饮料摄入、高加工肉类饮食 | |
| 胃癌 | 低 | 无明显诱因 | |
| 胰腺癌 | 较低 | 高空腹血糖 | |
| 北美地区 | 肺癌 | 高 | 吸烟 |
| 肝癌 | 较高 | 酒精摄入、脂肪性肝炎 | |
| 结直肠癌 | 高 | 高含糖饮料摄入、高加工肉类饮食 | |
| 胃癌 | 较低 | 低运动强度、吸烟 | |
| 胰腺癌 | 高 | 吸烟、高空腹血糖 |
利益冲突:Conflicts of Interest 所有作者声明不存在利益冲突。
All authors disclose no relevant conflicts of interest.
| [1] |
王劲松, 魏家燕, 彭敏. 2023年美国癌症统计报告和全球最新癌症统计数据解读及启示[J]. 实用肿瘤杂志, 2023, 38(6):523-527.
[
|
| [2] |
李纪宾, 邹小农. 全球癌症流行现状及环境致癌因素解析[J]. 环境卫生学杂志, 2023, 13(11):795-803.
[
|
| [3] |
|
| [4] |
|
| [5] |
|
| [6] |
|
| [7] |
|
| [8] |
|
| [9] |
|
| [10] |
|
| [11] |
张玲莉, 王丽珍, 杨培忠. 工业污染对癌症影响的挖掘方法:改进的空间同位模式[J]. 地球信息科学学报, 2023, 25(12):2340-2360.
[
|
| [12] |
|
| [13] |
|
| [14] |
|
| [15] |
|
| [16] |
|
| [17] |
|
| [18] |
|
| [19] |
|
| [20] |
卢宾宾, 葛咏, 秦昆, 等. 地理加权回归分析技术综述[J]. 武汉大学学报(信息科学版), 2020, 45(9):1356-1366.
[
|
| [21] |
|
| [22] |
|
| [23] |
郑大山, 张俊国, 文婉琪, 等. 三种常用统计学指标之间的区别和应用:相对危险度和风险比及比值比[J]. 中华预防医学杂志, 2024, 58(5):706-710.
[
|
| [24] |
[
|
| [25] |
Institute for Health Metrics and Evaluation (IHME). GBD Results[DB/OL]. Seattle: University of Washington, 2021.
|
| [26] |
|
| [27] |
|
| [28] |
World Bank Group. World Development Indicators[DB/OL]. Washington: World Bank Group, 2021.
|
| [29] |
|
| [30] |
张景暄, 付庭吕, 李宁, 等. 《肺癌的全球负担:当前状态和未来趋势》要点解读[J]. 中国胸心血管外科临床杂志, 2024, 31(1):17-23.
[
|
| [31] |
|
| [32] |
|
| [33] |
曹毛毛, 李贺, 孙殿钦, 等. 全球肝癌2020年流行病学现状[J]. 中华肿瘤防治杂志, 2022, 29(5):322-328.
[
|
| [34] |
中华医学会肝病学分会, 中华医学会感染病学分会. 丙型肝炎防治指南(2022年版)[J]. 中华临床感染病杂志, 2022, 15(6):428-447.
[Chinese Society of Hepatology, Chinese Society of Infectious Diseases, Chinese Medical Association. Guidelines for the Prevention and Treatment of Hepatitis C (2022 Edition)[J]. Chinese Journal of Clinical Infectious Diseases, 2022, 15(6):428-447.] DOI: 10.3760/cma.j.issn.1674-2397.2022.06.002
|
| [35] |
|
| [36] |
|
| [37] |
杨宗明, 朱章航, 徐李莎, 等. 全球结直肠癌疾病负担与筛查比较[J]. 实用肿瘤杂志, 2023, 38(3):211-217.
[
|
| [38] |
徐梦圆, 单天昊, 曾红梅. 2020年全球结肠癌和直肠癌发病死亡分析[J]. 江苏预防医学, 2023, 34(1):12-16.
[
|
| [39] |
|
| [40] |
|
| [41] |
闫超, 陕飞, 李子禹. 2020年全球胃癌负担分析:聚焦中国流行现状[J]. 中国肿瘤, 2023, 32(3):161-170.
[
|
| [42] |
|
| [43] |
孙惠昕, 贾海晗, 王婉莹, 等. 胰腺癌流行现状和影响因素的研究[J]. 医学信息, 2022, 35(11):47-50.
[
|
/
| 〈 |
|
〉 |