
百度街景和GSENet模型相结合的兰州市绿视率时空变化分析
|
许新元(2000— ),男,山东聊城人,硕士生,主要从事深度学习图像处理和地理信息系统。E-mail: 13734453821@163.com |
Copy editor: 黄光玉 , 蒋树芳
收稿日期: 2024-09-29
修回日期: 2025-02-16
网络出版日期: 2025-03-25
基金资助
国家自然科学基金项目(42171401)
国家自然科学基金项目(41771433)
甘肃省自然科学基金项目(20JR10RA247)
Spatio-Temporal Analysis of the Green View Index in Lanzhou City Using Baidu Street View and GSENet Model Integration
Received date: 2024-09-29
Revised date: 2025-02-16
Online published: 2025-03-25
Supported by
National Natural Science Foundation of China(42171401)
National Natural Science Foundation of China(41771433)
Gansu Provincial Natural Science Foundation(20JR10RA247)
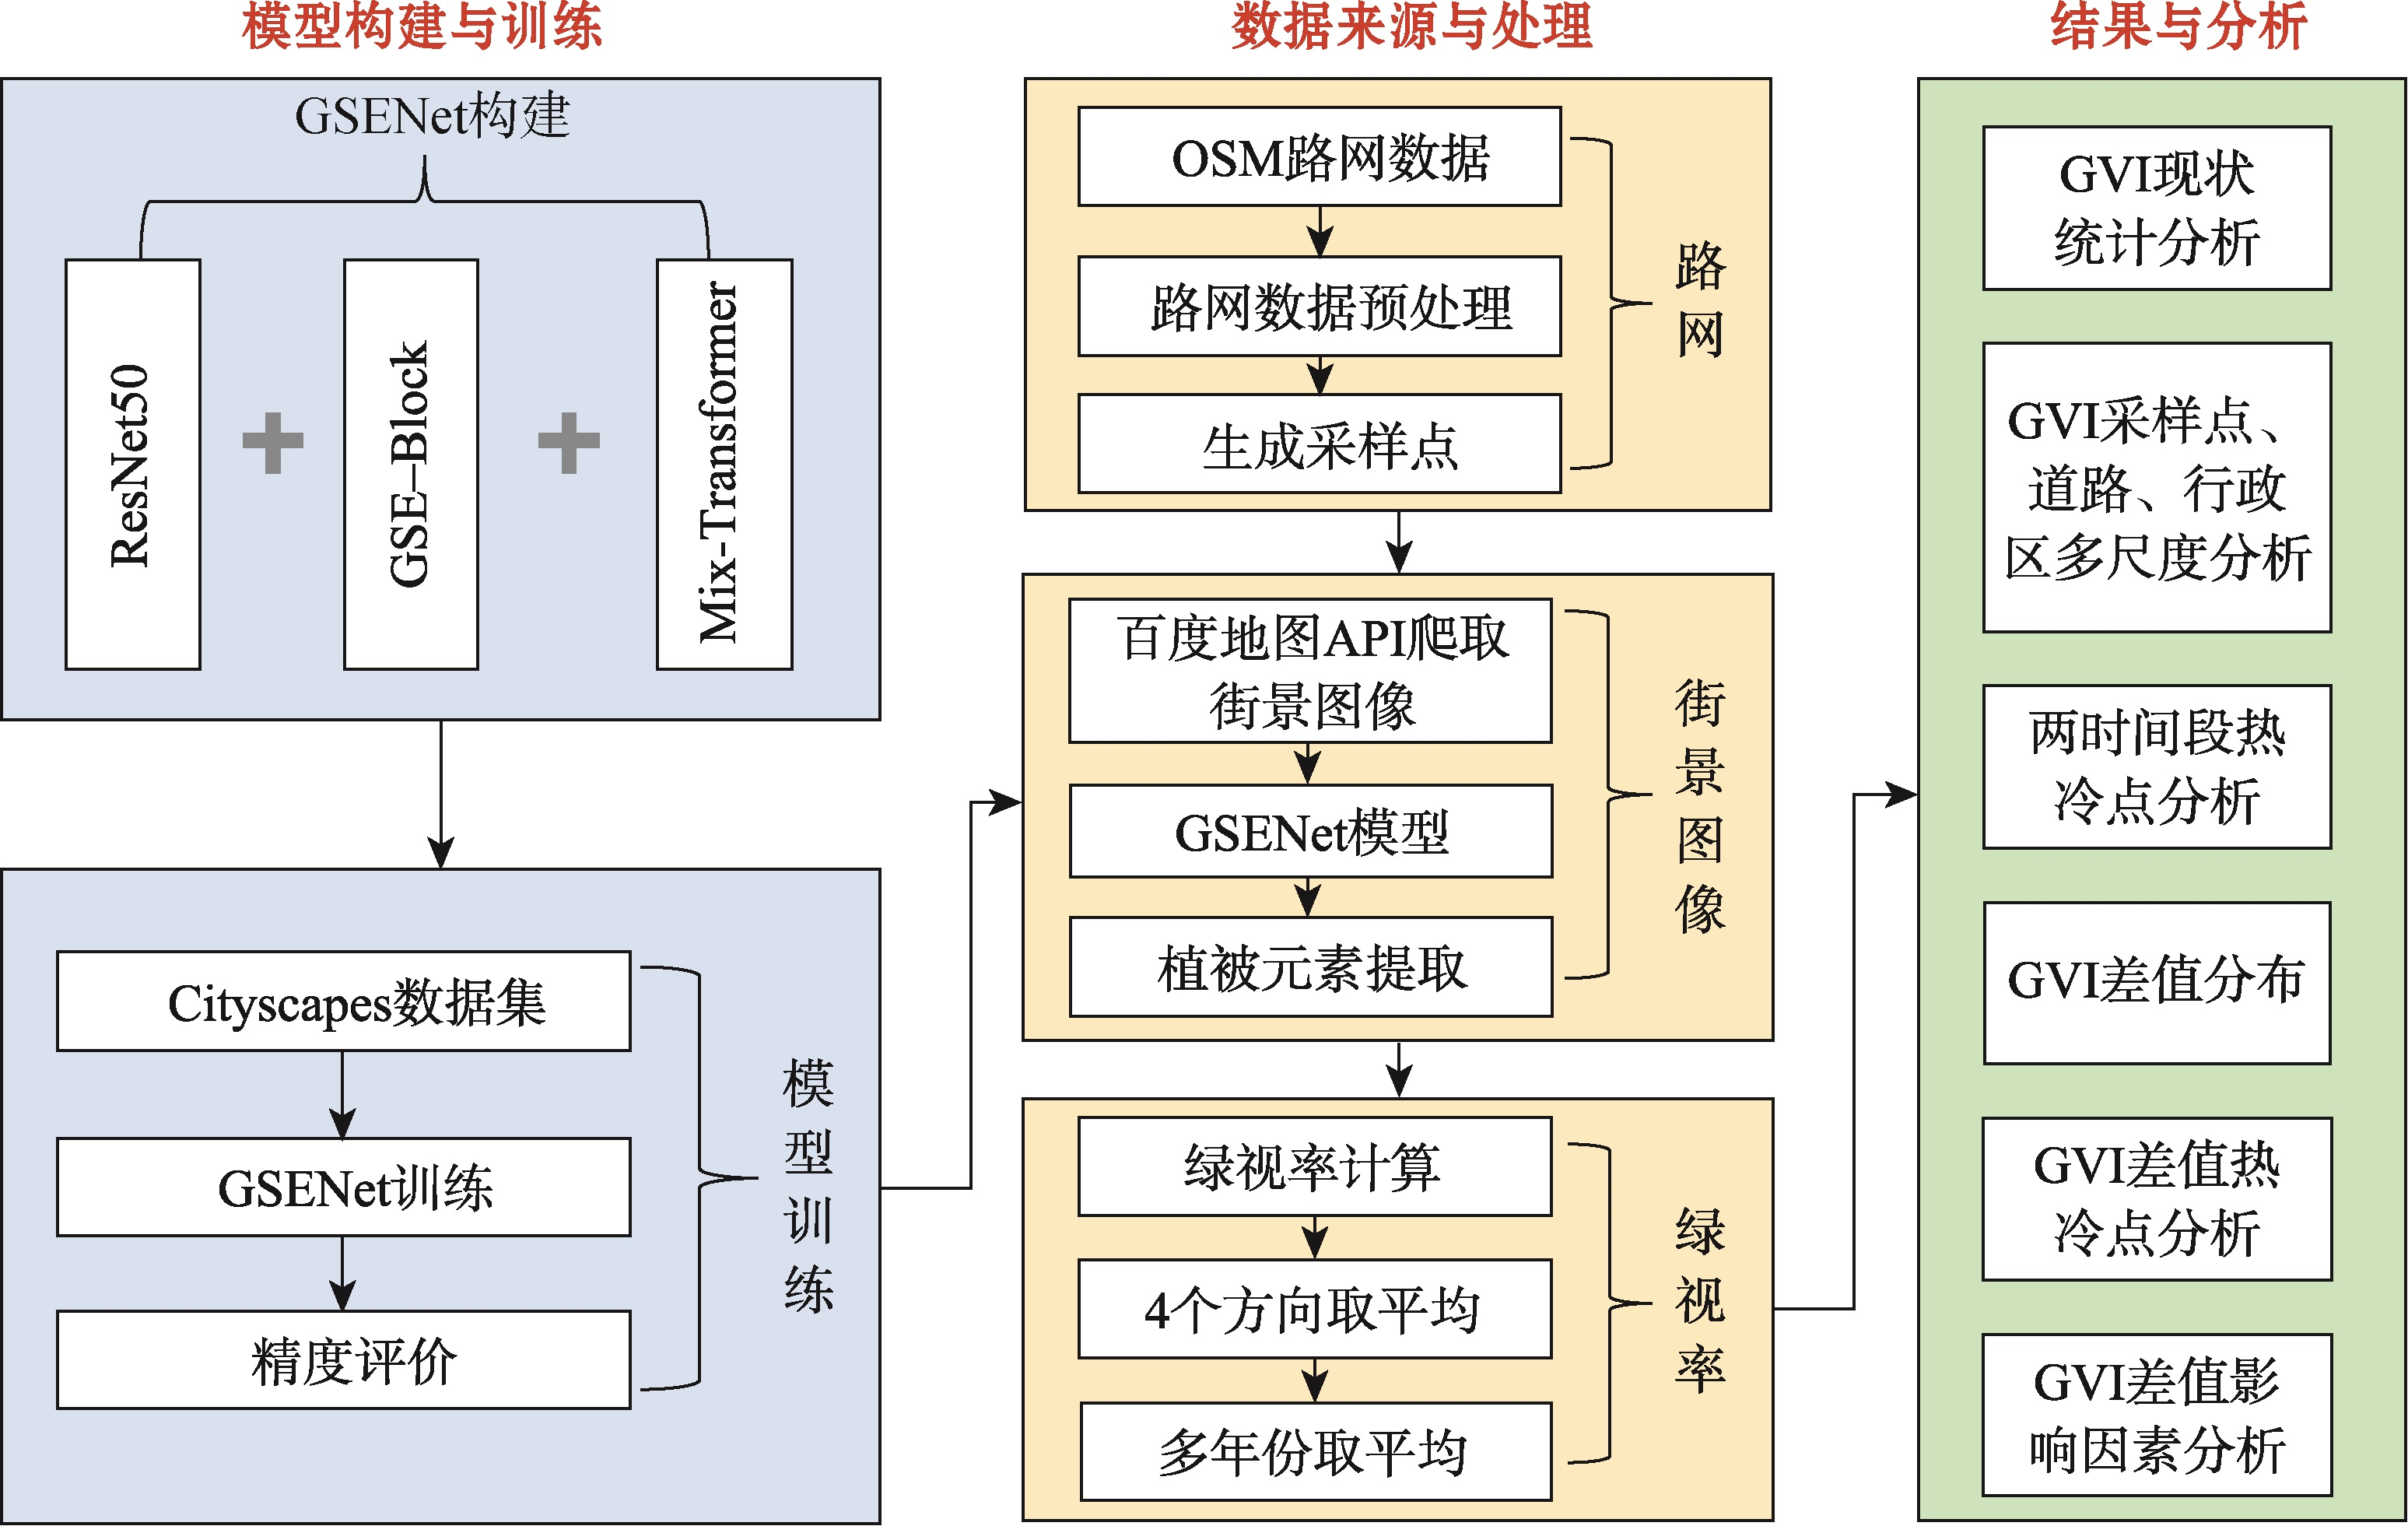
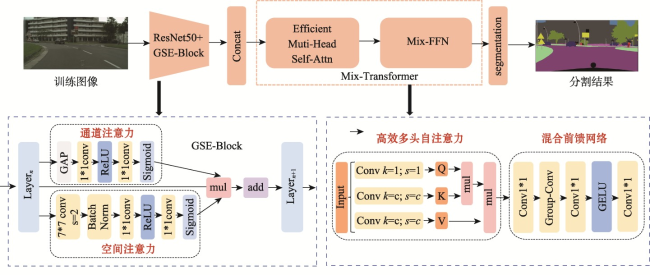
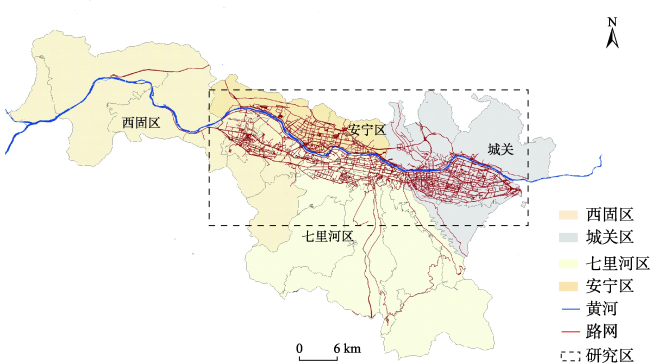
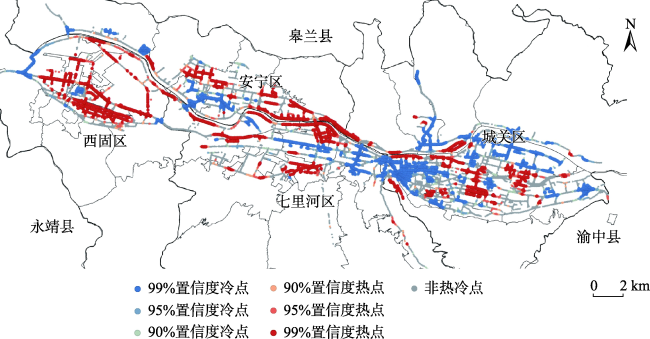
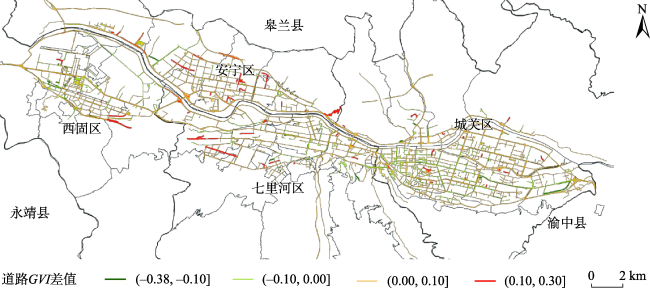
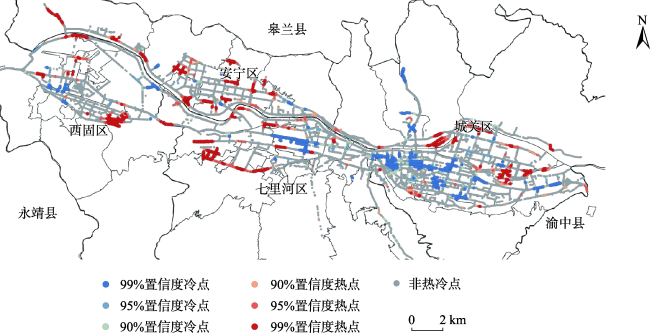
【目的】探索基于街景数据的城市绿视率时空变化特征及其影响因素,为城市街道绿化水平评估提供新方法。【方法】提出GSENet语义分割模型,在编码器中整合GSE-Block特征校准模块,解码器采用高效自注意力模块(Mix-transforemr)。基于该模型分析2014—2023年兰州市主城区百度街景数据,运用热冷点分析、统计分析、相关性分析方法探索绿视率时空变化规律。【结果】① GSENet模型以ResNet50为主干网络,MIOU达74.7%,优于PSPNet、DeepLabV3等主流模型,大面积类别F1分数可达0.95; ② 2019—2023年相比2014—2018年, GVI平均上升2.3%,70.9%的采样点显示出上升趋势。安宁区提升最显著,城关区提升最小。研究区中部偏西及东北部地区GVI显著上升,特别是在高校周边区域;商业中心和交通枢纽附近,GVI出现明显下降; ③ 建筑密集度与GVI变化呈负相关,道路宽阔度与GVI变化的相关性较弱;人口密度与GVI变化在街道尺度下呈现出较强的正相关。【结论】基于GSENet模型的街景绿视率测算方法具有较高准确性,可有效评估城市绿化水平的时空变化特征,为提升街道绿化感知程度和城市空间规划提供重要参考。
许新元 , 牛磊 . 百度街景和GSENet模型相结合的兰州市绿视率时空变化分析[J]. 地球信息科学学报, 2025 , 27(4) : 994 -1010 . DOI: 10.12082/dqxxkx.2025.240544
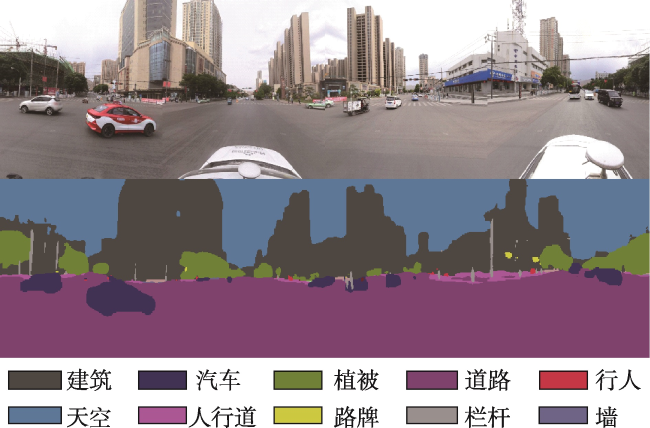
[Objectives] Although the use of street view data to calculate the Green View Index (GVI) has emerged as a method for evaluating urban greening levels, systematic research on the spatiotemporal dynamics of GVI remains limited. [Methods] This study explores the spatiotemporal characteristics and influencing factors of urban GVI using street view big data, providing a new method for assessing urban street greening levels. This study proposes the GSENet semantic segmentation model for calculating and analyzing the GVI in Lanzhou's main urban area. The GSENet model incorporates a GSE-Block feature calibration module within its encoder, combining spatial and channel attention mechanisms. The decoder adopts an efficient self-attention module (Mix-transformer), which introduces a scaling factor and replaces the fully connected layer with a 1×1 convolution, combining the global modeling capability of Transformers with the local processing ability of convolution. Using the GSENet model, this study calculates the GVI of Lanzhou's main urban area based on Baidu Street View data and explores its spatiotemporal variation patterns through hotspot analysis, statistical analysis, and correlation analysis. [Results] The results reveal several key findings: (1) Utilizing ResNet50 as the backbone, the GSENet model achieves a Mean Intersection over Union (MIOU) of 74.7%, outperforming mainstream models such as PSPNet and DeepLabV3. The model demonstrates superior performance in identifying large-area categories such as vegetation and buildings, achieving an F1 score of 0.95. (2) Between 2019 and 2023, the average GVI increased by 2.3% compared to the period from 2014 to 2018. Notably, 70.9% of the sampled points showed a positive GVI trend, although only 8.4% experienced an increase greater than 10%. Anning District recorded the most substantial improvement, with a GVI rise of 3.5%, while Chengguan District saw the smallest growth, at only 1.9%. Spatial analysis identified that the central-western and northeastern parts of the study area experienced significant GVI increases, particularly in regions surrounding universities. In contrast, GVI declined notably in commercial centers and transportation hubs. (3) The influence of street view features and social factors on GVI changes exhibits spatiotemporal heterogeneity. Building density shows a negative correlation with GVI changes. The correlation between road width and GVI changes is relatively weak while the correlation between population density and GVI changes varies across different scales, with a stronger positive correlation at the street scale. [Conclusions] The experimental results highlight the effectiveness of this research in enhancing the perceived greening of urban streets. Furthermore, the findings provide valuable insights for urban planners aiming to optimize green space distribution and improve urban environments.
表1 GVI计算方法对比分析Tab. 1 Comparison and analysis of GVI calculation methods |
表2 研究数据来源及用途Tab. 2 Research data sources and applications |
| 数据类型 | 数据来源 | 时间/年 | 空间精度/分辨率 | 主要用途 |
|---|---|---|---|---|
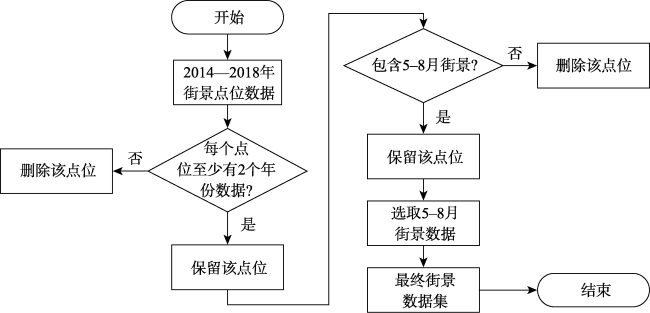
| 街景数据 | 百度街景 | 2014—2023 | 256像素×256像素 | GVI计算与分析 |
| 路网数据 | OpenStreetMap | 2023 | 矢量数据 | 街景采样点生成 |
| 训练样本 | Cityscapes | — | 1 024像素×2 048像素 | 模型训练 |
| 验证样本 | 自主标注 | 2014—2023 | 256像素×256像素 | 模型精度验证 |
| 人口分布数据 | Oak Ridge National Laboratory | 2014—2022 | 1 km×1 km | GVI相关性分析 |
| 人口普查数据 | 第七次人口普查 | 2022 | 乡镇级别 | GVI相关性分析 |
表3 模型在 Cityscapes 验证集上的性能对比Tab. 3 Performance comparison of different models on the Cityscapes validation set |
| 模型 | Backbone | 平均交并比 | 平均精确率 | 平均召回率 | F1分数 |
|---|---|---|---|---|---|
| Unet | Resnet50 | 0.660 | 0.806 | 0.760 | 0.779 |
| PSPnet | Resnet50 | 0.675 | 0.777 | 0.810 | 0.791 |
| DeepLabV3 | Resnet50 | 0.688 | 0.800 | 0.806 | 0.801 |
| PSAnet | Resnet50 | 0.737 | 0.849 | 0.833 | 0.840 |
| GSENet | Resnet50 | 0.747 | 0.871 | 0.829 | 0.847 |
表4 Cityscapes 验证集上各类别精度评价Tab. 4 Accuracy evaluation of each category on Cityscapes validation set |
| 类别 | 平均交并比 | 平均精确率 | 平均召回率 | F1分数 |
|---|---|---|---|---|
| 道路 | 0.977 | 0.991 | 0.987 | 0.989 |
| 天空 | 0.933 | 0.957 | 0.974 | 0.965 |
| 植被 | 0.917 | 0.953 | 0.960 | 0.956 |
| 建筑 | 0.914 | 0.947 | 0.964 | 0.955 |
| 人行道 | 0.827 | 0.896 | 0.916 | 0.906 |
| 栅栏 | 0.580 | 0.812 | 0.670 | 0.733 |
| 信号灯 | 0.748 | 0.892 | 0.822 | 0.855 |
| 栏杆 | 0.565 | 0.770 | 0.680 | 0.721 |
表5 模型在街景标注数据上的性能对比Tab. 5 Performance comparison of models on street view annotation data |
| 模型 | Backbone | 平均 交并比 | 平均 精确率 | 平均 召回率 | F1分数 |
|---|---|---|---|---|---|
| Unet | Resnet50 | 0.632 | 0.795 | 0.727 | 0.744 |
| PSPnet | Resnet50 | 0.651 | 0.743 | 0.776 | 0.759 |
| DeepLabV3 | Resnet50 | 0.667 | 0.788 | 0.790 | 0.789 |
| PSAnet | Resnet50 | 0.698 | 0.812 | 0.806 | 0.801 |
| GSENet | Resnet50 | 0.718 | 0.853 | 0.809 | 0.830 |
表6 模型在街景标注数据上的性能对比Tab. 6 Performance comparison of models on street view annotation data |
| 类别 | 平均交并比 | 平均精确率 | 平均召回率 | F1分数 |
|---|---|---|---|---|
| 道路 | 0.954 | 0.962 | 0.965 | 0.963 |
| 天空 | 0.918 | 0.936 | 0.954 | 0.945 |
| 植被 | 0.903 | 0.925 | 0.931 | 0.927 |
| 建筑 | 0.896 | 0.920 | 0.933 | 0.926 |
| 人行道 | 0.801 | 0.868 | 0.897 | 0.882 |
| 栅栏 | 0.530 | 0.762 | 0.656 | 0.705 |
| 信号灯 | 0.710 | 0.823 | 0.784 | 0.803 |
| 栏杆 | 0.525 | 0.693 | 0.662 | 0.677 |
表7 GSENet模型不同模块在Cityscapes验证集上的性能对比Tab. 7 Performance comparison of GSENet model components on Cityscapes validation set |
| 模型 | Backbone | 注意力模块 | 平均交并比 |
|---|---|---|---|
| GSENet | Resnet50 | 无 | 0.685 |
| GSENet | Resnet50 | GSE-Block | 0.737 |
| GSENet | Resnet50 | Mix-Transformer | 0.713 |
| GSENet | Resnet50 | GSE-Block+ Mix-Transformer | 0.747 |
表8 两阶段GVI统计特征对比Tab. 8 Comparison of GVI statistical characteristics between two time periods |
| 指标 | 2014—2018年 | 2019—2023年 |
|---|---|---|
| GVI最大值 | 0.644 55 | 0.640 29 |
| GVI最小值 | 0 | 0 |
| GVI平均值 | 0.133 27 | 0.156 78 |
| GVI标准差 | 0.111 72 | 0.118 85 |
表9 各行政区GVI平均值对比Tab. 9 Comparison of average GVI in different administrative districts |
| 行政区 | 平均GVI | |
|---|---|---|
| 2014—2018年 | 2019—2023年 | |
| 安宁区 | 0.128 412 | 0.163 213 |
| 城关区 | 0.119 871 | 0.138 529 |
| 七里河 | 0.134 930 | 0.158 351 |
| 西固区 | 0.177 110 | 0.201 282 |
表10 研究区GVI变化程度分布Tab. 10 Distribution of GVI change magnitude in study area |
| GVI变化 | GVI差值范围 | 占比/% |
|---|---|---|
| 下降较多 | (-0.41, -0.10] | 2.5 |
| 下降较少 | (-0.1, 0] | 26.5 |
| 上升较少 | (0, 0.10] | 62.5 |
| 上升较多 | (0.10, 0.47] | 8.4 |
表11 GVI与街景指标及社会因素的相关性Tab. 11 Correlation between GVI and street view indicators and social factors |
| 变量 | 皮尔逊相关系数 (z得分) | ||
|---|---|---|---|
| 2014—2018年 | 2019—2023年 | ||
| 街景指标 | 建筑密集度 | -0.387 (0.00* *) | -0.448 (0.00* *) |
| 道路宽阔度 | -0.219 (4.76* *) | -0.157 (1.86* *) | |
| 天空开阔度 | -0.354 (0.00* *) | -0.328 (1.14* *) | |
| 社会因素 | 人口密度(1 km×1 km格网级) | -0.052 (0.421 0) | -0.077 (0.234 0) |
| 人口密度(人口普查街道级) | 0.060 (0.671 0) | 1.819e-05 (0.999 0) | |
注:**显著性水平为 0.01(双尾)。 |
表12 GVI变化与街景指标及社会因素的相关性Tab. 12 Correlation between GVI changes and street view indicators and social factors |
| 变量 | 皮尔逊相关系数 (z得分) | ||
|---|---|---|---|
| 2014—2018年 | 2019—2023年 | ||
| 街景指标 | 建筑密集度 | -0.041 (5.06**) | -0.235 (3.43**) |
| 道路宽阔度 | 0.074 (2.10**) | -0.005 (0.525) | |
| 天空开阔度 | 0.167 (4.18**) | 0.03 (4.6**) | |
| 社会因素 | 人口密度 (1 km×1 km格网级) | 0.183 (0.004**) | 0.105 (0.103) |
| 人口密度 (人口普查街道级) | 0.33 (0.016) | ||
注:**显著性水平为 0.01(双尾)。 |
| [1] |
|
| [2] |
|
| [3] |
|
| [4] |
|
| [5] |
|
| [6] |
|
| [7] |
|
| [8] |
|
| [9] |
|
| [10] |
|
| [11] |
肖希, 韦怡凯, 李敏. 日本城市绿视率计量方法与评价应用[J]. 国际城市规划, 2018, 33(2):98-103.
[
|
| [12] |
华野毓, 钱雨果, 赵文慧, 等. 基于多源数据的绿视率量化方法综述[J]. 生态学报, 2024, 44(23):10953-10963.
[
|
| [13] |
|
| [14] |
刘晓天, 孙冰, 廖超, 等. 基于街景图像的城市街道绿视率计量方法比较分析[J]. 江西农业大学学报, 2020, 42(5):1022-1031.
[
|
| [15] |
|
| [16] |
|
| [17] |
|
| [18] |
|
| [19] |
|
| [20] |
|
| [21] |
|
| [22] |
张丽英, 裴韬, 陈宜金, 等. 基于街景图像的城市环境评价研究综述[J]. 地球信息科学学报, 2019, 21(1):46-58.
[
|
| [23] |
|
| [24] |
|
| [25] |
孟庆岩, 汪雪淼, 孙云晓, 等. 基于街景数据的绿视率模型构建及其影响因子研究[J]. 生态科学, 2020, 39(1): 146-155.
[
|
| [26] |
张佳晖, 孟庆岩, 孙云晓, 等. 城市行道树绿视量指数研究[J]. 地球信息科学学报, 2017, 19(6):838-845.
[
|
| [27] |
彭锐, 刘海霞. 城市道路绿视率自动化计算方法研究[J]. 北京规划建设, 2018(4):61-64.
[
|
| [28] |
彭巍, 唐丽玉, 胡颖, 等. 基于街景图像的福州城区主要道路绿视率研究[J]. 测绘与空间地理信息, 2022, 45(1):62-66.
[
|
| [29] |
张炜, 周昱杏, 杨梦琪. 全景绿视率自动识别和计算研究[J]. 风景园林, 2019, 26(10):89-94.
[
|
| [30] |
|
| [31] |
陶贵鑫, 周宏轩, 王昭清, 等. 道路绿视率不同识别方法比较研究——以徐州市为例[J]. 西北林学院学报, 2024, 39(2):156-165.
[
|
| [32] |
|
| [33] |
|
| [34] |
张永霖, 付晓. 基于深度学习街景影像解译和景感生态学的视域环境定量解读[J]. 生态学报, 2020, 40(22):8191-8198.
[
|
| [35] |
王鸿雁, 车向红, 徐辛超, 等. 利用 DeepLabv3+模型提取分析街景图像绿视率——以北京三环内为例[J]. 测绘通报, 2024(3):88-94.
[
|
| [36] |
|
| [37] |
|
| [38] |
|
| [39] |
|
| [40] |
|
| [41] |
|
| [42] |
|
| [43] |
|
| [44] |
|
| [45] |
|
| [46] |
|
| [47] |
|
| [48] |
|
| [49] |
|
| [50] |
|
| [51] |
刘轩, 粟晓玲, 刘雨翰, 等. 西北地区生态干旱脆弱性评估[J]. 水资源保护, 2023, 39(3):65-73.
[
|
| [52] |
|
| [53] |
|
| [54] |
Oak Ridge National Laboratory. LandScan Global 2014-2022[DB/OL].[2024-10-29]. https://landscan.ornl.gov/.
|
| [55] |
|
| [56] |
高翔, 董贺轩. 街道步行空间绿视率与步行愉悦度的关联研究——基于武汉多类型街道的实证比较[J]. 西部人居环境学刊, 2023, 38(2):52-59.
[
|
| [57] |
齐子吟, 李君轶, 贺哲, 等. 城市街道景观色彩对游客情感感知影响——基于街景图像的研究[J]. 地球信息科学学报, 2024, 26(2):514-529.
[
|
/
| 〈 |
|
〉 |