
Journal of Geo-information Science >
Analysis of Urban Heat Island Environment in a Valley City for Policy Formulation: A Case Study of Xining City in Qinghai Province of China
Received date: 2013-11-07
Request revised date: 2014-02-19
Online published: 2014-07-10
Copyright
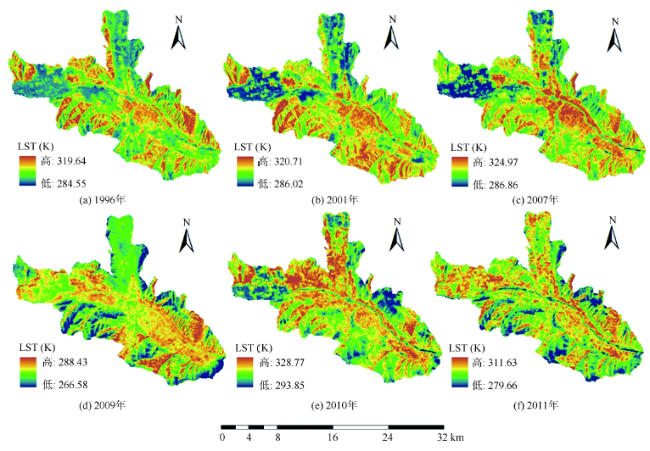
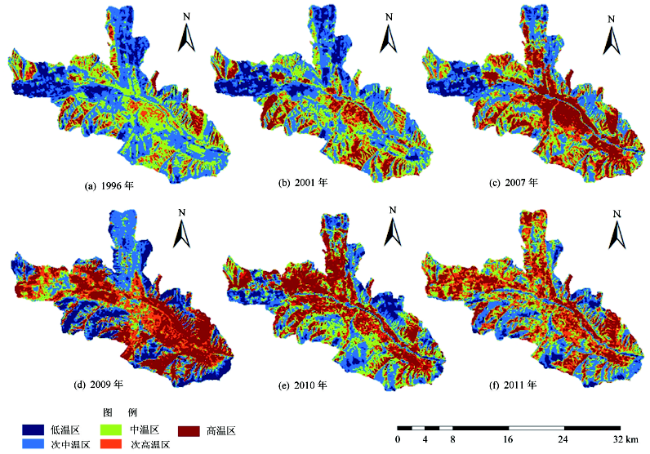
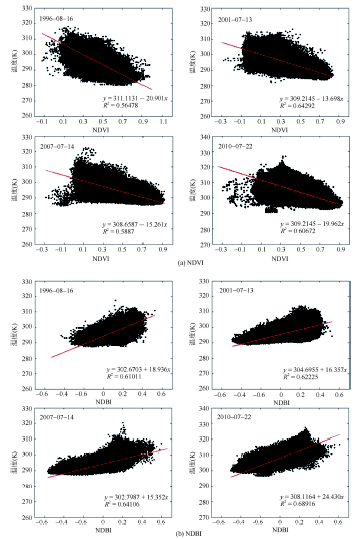
Urban thermal environment is an important part of urban ecosystem, and urban heat island (UHI) effect directly reflects the climate characteristics of the city. It has an important practical significance to analyze comprehensively the urban heat island for studying urban air temperature change resulting from urbanization and environment change, and protecting urban eco-environment .Taking the valley city of Xining as a case study area, six Landsat 5 TM scenes were adopted from USGS website, and meteorological station data were obtained from China Meteorological Data Sharing Service System respectively. Firstly, the six Landsat 5 TM scenes were preprocessed by using ArcGIS 10.0 and ENVI 5.0 and the meteorological station data was processed using EXCEL software. Secondly, based on mono-window algorithm, the land surface temperature (LST) of the study area was retrieved. Then, all LST retrieval results obtained from the six Landsat 5 TM scenes were normalized to 0-1 for comparing the temporal differences of varied urban heat island. Thirdly, all normalized results were divided into five equal interval levels based on density separation technology of ENVI 5.0 software. Finally, the correlations between LST and NDVI as well as LST and NDBI were analyzed respectively. The results show that an obvious urban heat island effect exists in Xining city from 1996 to 2011. In addition, the spatial distribution pattern and extension of the urban heat island is consistent with urban sprawl. The urban heat island area is respectively 54.2 km2 in August 1996, 85.9 km2 in July 2001, 147.1 km2 in July 2007, 166.7 km2 in March 2009, 148.9 km2 in July 2010, and 158.7 km2 in September 2011, showing an expanding trend from 1996 to 2011 in general. Specifically, the heat island area has reduced substantially in the low and medium LST sub-region, whereas the heat island area has increased significantly in the high LST sub-region. The heat island effect is the strongest in winter, and it decreases evidently in the summer, then the autumn. In the spatial pattern of valley city, the land surface temperature is negatively correlated with NDVI, and positively correlated with NDBI. According to the spatio-temporal evolution of urban heat island, with the adoption of analysis of causes and strategic thinking, the constructive strategies and measures to alleviate urban heat island effect are proposed from different aspects, thus providing a scientific reference for decision making to improve the thermal environment of Xining City in the future.
JIA Wei , GAO Xiaohong* . Analysis of Urban Heat Island Environment in a Valley City for Policy Formulation: A Case Study of Xining City in Qinghai Province of China[J]. Journal of Geo-information Science, 2014 , 16(4) : 592 -601 . DOI: 10.3724/SP.J.1047.2014.00592
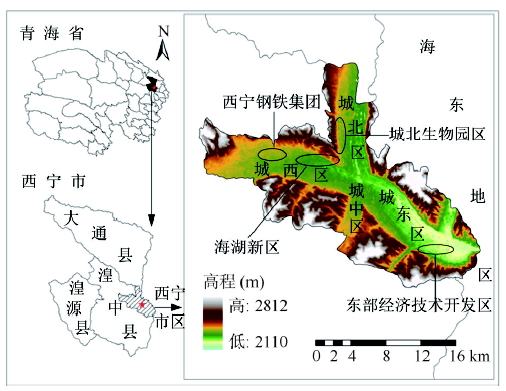
Fig.1 Location map of the study area图1 研究区位置 |
Tab.1 The inversion result of quantitative remote sensing on land surface temperature and related data in Xining City表1 西宁市城市热岛效应定量反演结果及相关数据 |
| 日期 | 观测数据 | 反演参数 | LST定量反演 | ||||||
|---|---|---|---|---|---|---|---|---|---|
| 平均气温(K) | 相对湿度 | 大气平均作用温度(K) | 大气透 射率 | NDVI(均值) | 平均地表温度(K) | 标准差 | |||
| 1996-08-16 2001-07-13 2007-07-14 2009-03-13 2010-07-22 2011-09-11 | 290.45 291.25 289.55 267.05 293.45 287.05 | 69 61 54 61 64 68 | 285.0287 285.7697 284.1951 262.6010 287.8073 281.8796 | 0.926088 0.927551 0.931517 0.944797 0.923621 0.930402 | 0.372558 0.394763 0.448654 0.098554 0.430700 0.312257 | 308.43 309.66 309.02 281.87 310.56 307.59 | 2.72 3.11 3.01 3.64 2.86 2.41 | ||
Fig.2 The inversion result of land surface temperature in Xining City from 1996 to 2011图2 1996-2011年西宁市地表温度(LST)反演图 |
Tab.2 The level of land surface temperature area in Xining City from 1996 to 2011表2 1996-2011年西宁市各地表温度等级的面积统计 |
| 日期 | 低温区面积(km2) | 次中温区面积(km2) | 中温区面积(km2) | 次高温区面积(km2) | 高温区面积(km2) |
|---|---|---|---|---|---|
| 1996-08-16 | 46.4 | 142.7 | 105.3 | 35.9 | 18.3 |
| 2001-07-13 | 45.9 | 127.1 | 89.7 | 46.0 | 39.9 |
| 2007-07-14 | 29.4 | 99.4 | 72.7 | 59.3 | 87.8 |
| 2009-03-13 | 50.8 | 81.2 | 49.9 | 64.2 | 102.5 |
| 2010-07-22 | 31.0 | 80.4 | 88.3 | 56.3 | 92.6 |
| 2011-09-11 | 19.1 | 85.8 | 85.0 | 85.1 | 73.6 |
Fig.3 The grade of land surface temperature in Xining City from 1996 to 2011图3 1996-2011年西宁市地表温度等级图 |
Fig.4 Relationships between land surface temperature and NDVI, NDBI图4 地表温度(LST)与NDVI、NDBI的关系 |
The authors have declared that no competing interests exist.
| [1] |
|
| [2] |
|
| [3] |
|
| [4] |
|
| [5] |
|
| [6] |
|
| [7] |
|
| [8] |
|
| [9] |
|
| [10] |
|
| [11] |
|
| [12] |
|
| [13] |
|
| [14] |
|
| [15] |
|
| [16] |
|
| [17] |
|
| [18] |
|
| [19] |
|
| [20] |
|
| [21] |
|
| [22] |
|
| [23] |
|
| [24] |
|
| [25] |
|
| [26] |
|
| [27] |
|
| [28] |
|
| [29] |
|
/
| 〈 |
|
〉 |