
Journal of Geo-information Science >
Gradient Cellular Automata with the Consideration of Spatial Growth Potentiality for Urban Sprawling Simulation
Received date: 2014-02-28
Request revised date: 2014-04-15
Online published: 2014-09-04
Copyright
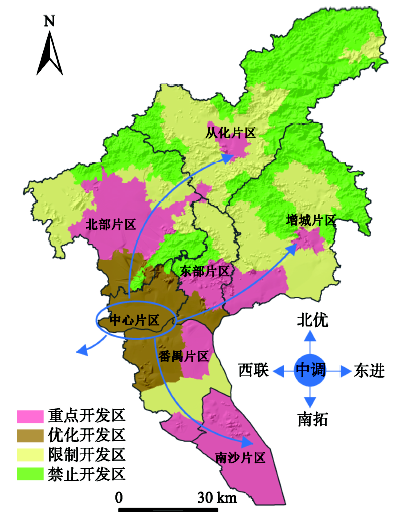
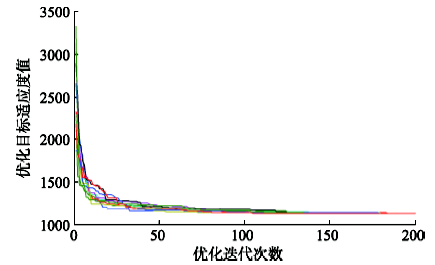
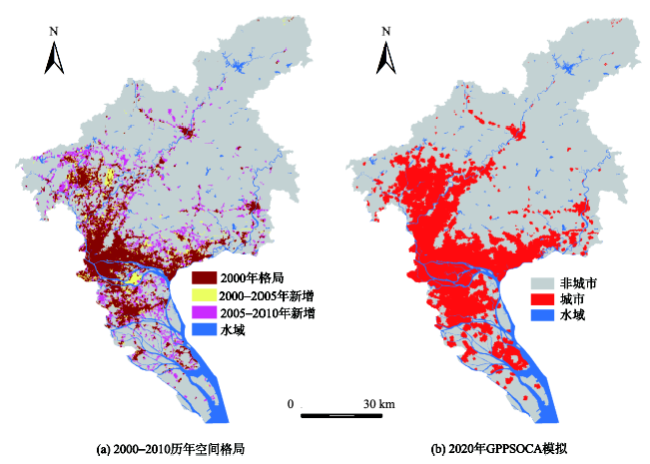
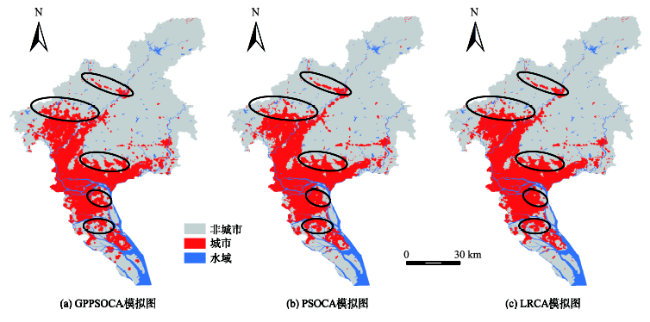
Geography simulation model such as Cellular Automata (CA) is one of the most important tools for simulating and early warning the urban growth. The CA model can simulate urban sprawling accurately only when suitable conversion rules for every cell are achieved. Hence, the core of CA is to derive the conversion rules, and many researchers have been interested in discovering the rules. However, the conversion rules of traditional CA are mainly derived from historic samples, in which both changed samples and unchanged ones are considered for function fitting to retrieve parameters simultaneously. In this approach, it is assumed that if the urban sprawling occurred, samples were labeled as 1; otherwise, samples were accordingly labeled as 0. However, it will result in over fitting for the unchanged samples, because those samples with labels of 0 may have the potentiality to transform in future, especially for those located at the rural-urban fringe. Therefore, we proposed a gradient CA for simulating urban sprawling. In this model, whether or not urban growth would occur was determined by the developing probability instead of its developed or undeveloped status. Accordingly, the unchanged samples were set to the values ranging from 0 to 1. And in this research, the developing potentiality was estimated according to present planning maps. Compared with traditional CA, the gradient CA could avoid the over fitting problem for the unchanged samples to a certain degree. Moreover, the fitting objective was distinguished from traditional CA for its ability in retrieving conversion rules. In addition, particle swarm optimization algorithm was used to obtain the parameters of spatial indices. Finally, Guangzhou City, which locates in the Pearl River Delta of China, was chosen as the study area for model implementation and validation. In this case study, the spatial developing potentiality was allocated referring to the major function zone (MFZ) planning, because MFZ is currently one of the most significant planning policies for Chinese government to control the chaotic urbanization. In order to evaluate the model’s efficiency, a comparison analysis was carried out between the gradient CA and traditional CA. Global and local patterns of the simulation results were analyzed respectively in details. Results demonstrate that the model modified in this paper can perform efficiently and the overall accuracy of the model is greater than 70%, which can provide better and reasonable spatial scenarios for medium-and long-term urban planning.
MA Shifa , AI Bin , ZHAO Kefei . Gradient Cellular Automata with the Consideration of Spatial Growth Potentiality for Urban Sprawling Simulation[J]. Journal of Geo-information Science, 2014 , 16(5) : 727 -734 . DOI: 10.3724/SP.J.1047.2014.00727
Fig.1 Major function zoning of Guangzhou图1 广州市主体功能区格局 |
Fig.2 Parameters optimized by PSO algorithm图2 粒子群优化过程迭代图 |
Tab.1 Coefficients obtained with different algorithms表1 基于不同规则获取方法的系数值 |
| 空间要素β值 | 参数获取方法 | ||
|---|---|---|---|
| GPPSOCA | PSOCA | LRCA | |
| 高程 | -14.642 | -9.706 | -10.060 |
| 离区级中心的距离 | 0.425 | -4.710 | -4.745 |
| 离高速路口的距离 | -3.145 | -0.771 | -2.096 |
| 离大镇中心的距离 | 3.700 | 4.470 | 3.421 |
| 离市级中心的距离 | -2.786 | -0.229 | 0.001 |
| 离港口的距离 | -1.526 | 0.602 | 0.129 |
| 离一般道路的距离 | -1.759 | -20.000 | -11.359 |
| 离小镇中心的距离 | 0.130 | 2.310 | 2.102 |
| 离地铁的距离 | -3.240 | -6.008 | -5.881 |
| 常数项 | 1.984 | -0.071 | 0.109 |
Fig.3 Historic urban growth and the simulation result for 2020a with GPPSOCA图3 广州市历年城市空间格局及模拟图 |
Fig.4 Comparison among different simulation models图4 不同模型模拟格局对比 |
Tab.2 Simulation accuracy of different models表2 不同模型模拟精度定量检测 |
| 模型 | 精度(%) | ||
|---|---|---|---|
| 模拟-城市化 | 城市化-未模拟 | 总体精度 | |
| LRCA | 32.358 | 28.297 | 71.703 |
| PSOCA | 33.490 | 27.165 | 72.835 |
| GPPSOCA | 34.648 | 26.007 | 73.993 |
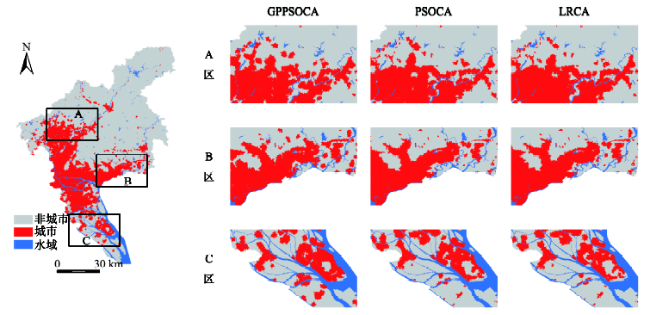
Fig.5 Comparison of local patterns among the three simulations图5 不同模拟结果局部格局对比图 |
The authors have declared that no competing interests exist.
| [1] |
|
| [2] |
|
| [3] |
|
| [4] |
|
| [5] |
|
| [6] |
|
| [7] |
|
| [8] |
|
| [9] |
|
| [10] |
|
| [11] |
|
| [12] |
|
| [13] |
|
| [14] |
|
| [15] |
|
| [16] |
|
| [17] |
|
| [18] |
|
| [19] |
|
| [20] |
|
| [21] |
|
/
| 〈 |
|
〉 |