
Journal of Geo-information Science >
The Temporal and Spatial Trend of China's Regional Consumption Level since the Reform and Opening up
Received date: 2013-12-03
Request revised date: 2014-03-24
Online published: 2014-09-04
Copyright
Regional consumption is an important driving force for the development of economy. The evolution of regional consumption level not only manifests the time sequence variation, but also shows the spatial interaction. While traditional studies consider little of the space-time effect together, this paper characterizes the regional consumption level with the use of per capita consumption retail sales. On the basis of calculating regional consumption level gap, the mutation point of time series values for regional consumption level gap is detected. Furthermore, the change of consumption level in China is divided into two periods of 1978-1986 and 1996-2010. Then, by using the traditional Markov chain and space Markov chain method, we analyzed the characteristics of spatial and temporal evolution pattern for per capita consumption level within the two periods respectively. The results show that: (1) the change of regional consumption level in each study phase shows the phenomenon of “club convergence”. And both the regions with low and high consumption level regions are steadily evolving along with their original types. (2) The variation of regional per capita consumption level is affected by the background of consumption level in adjacent regions, and the convergence process is not spatially independent. Generally, if a region is adjacent to regions with low consumption level, it will suffer from negative influences; if adjacent to regions with high consumption level, it will help increase the number of regions with their consumption level shifting upward and reduce the number of regions with same level transfer. (3) The interactions of regional consumption level between different regions present an obvious east-west differentiation trend. The regions and their neighborhoods with high consumption level that simultaneously shifting upward are mainly distributed in the east of China. The regions and their neighborhoods with consumption level shifting downward are clustered in the west of China. In addition, the central China region indicates a stationary consumption level, while the consumption level of the adjacent regions presents a varied state of convergence.
LI Zaijun , GUAN Weihua , WU Qiyan , PU Yingxia . The Temporal and Spatial Trend of China's Regional Consumption Level since the Reform and Opening up[J]. Journal of Geo-information Science, 2014 , 16(5) : 746 -753 . DOI: 10.3724/SP.J.1047.2014.00746
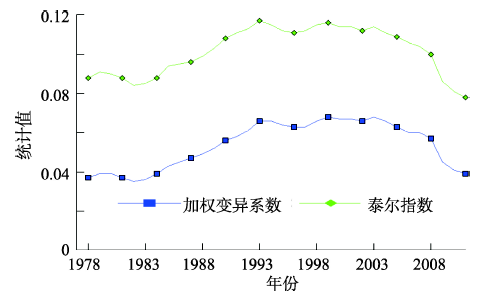
Fig.1 The change of regional differences of social consumption levels in China since 1978图1 1978年以来中国社会消费水平区域差异变动 |
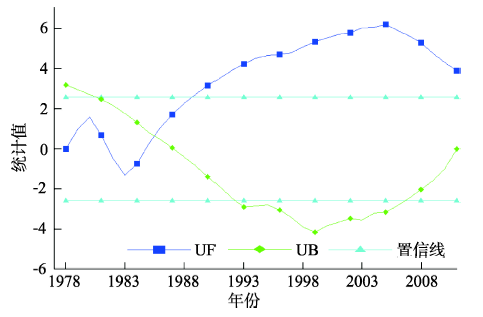
Fig.2 Mann-Kendall statistic curve of weighted variation coefficient of regional differences of social consumption levels in China since 1978图2 1978年以来中国区域消费水平差异加权变异系数的Mann-Kendall统计量曲线(置信线为α=0.01显著性水平临界值) |
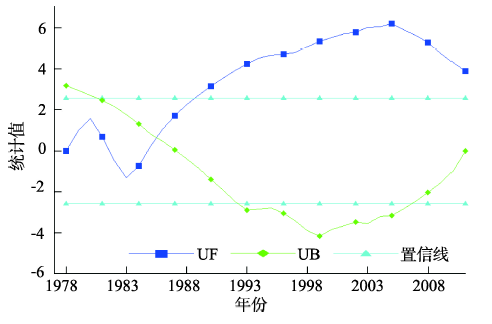
Fig.3 Mann-Kendall statistic curve of Taylor coefficient of regional differences of social consumption levels in China since 1978图3 1978年以来中国区域消费水平差异泰尔指数的Mann-Kendall统计量曲线(置信线为α=0.01显著性水平临界值) |
Tab.1 Markov matrix for per capita consumption class at the regional level in China, 1978-2011表1 1978-2011年间我国人均消费水平类型的马尔科夫矩阵 |
| ti/ti+1 | 1978-1986 | 1986-2011 | ||||||||||
|---|---|---|---|---|---|---|---|---|---|---|---|---|
| n | 1(<75%) | 2(<100%) | 3(<125%) | 4(>125%) | n | 1(<75%) | 2(<100%) | 3(<125%) | 4(>125%) | |||
| 1 | 107 | 0.9626 | 0.0280 | 0.0000 | 0.0093 | 418 | 0.9689 | 0.0311 | 0.0000 | 0.0000 | ||
| 2 | 66 | 0.0455 | 0.9091 | 0.0455 | 0.0000 | 133 | 0.0977 | 0.8571 | 0.0451 | 0.0000 | ||
| 3 | 40 | 0.0250 | 0.0750 | 0.9000 | 0.0000 | 75 | 0.0000 | 0.0400 | 0.8800 | 0.0800 | ||
| 4 | 35 | 0.0000 | 0.0000 | 0.0571 | 0.9429 | 149 | 0.0000 | 0.0000 | 0.0067 | 0.9933 | ||
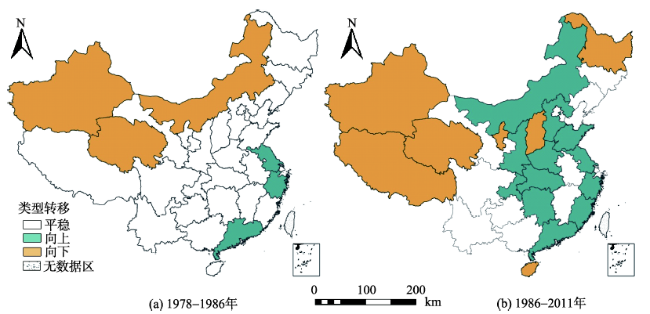
Fig.4 Spatial patterns of per capita consumption class transitions at the regional level in China, 1978-2011图4 1978-2011年我国区域消费水平类型转移的空间分布格局 |
Tab.2 Spatial Markov matrices for per capita consumption class conditioned on its spatial lag at the regional level between 1978 and 2011表2 1978-2011年间我国区域消费水平类型的空间马尔科夫矩阵(以空间滞后为条件) |
| 空间滞后 | ti/ti+1 | 1978-1986 | 1986-2011 | ||||||||||
|---|---|---|---|---|---|---|---|---|---|---|---|---|---|
| n | 1(<75%) | 2(<100%) | 3(<125%) | 4(>125%) | n | 1(<75%) | 2(<100%) | 3(<125%) | 4(>125%) | ||||
| 1 | 1 | 32 | 1.0000 | 0.0000 | 0.0000 | 0.0000 | 214 | 0.9831 | 0.0187 | 0.0000 | 0.0000 | ||
| 2 | 8 | 0.0000 | 1.0000 | 0.0000 | 0.0000 | 30 | 0.0667 | 0.9000 | 0.0333 | 0.0000 | |||
| 3 | 0 | 0.0000 | 0.0000 | 0.0000 | 0.0000 | 3 | 0.0000 | 0.0000 | 0.6667 | 0.3333 | |||
| 4 | 0 | 0.0000 | 0.0000 | 0.0000 | 0.0000 | 14 | 0.0000 | 0.0000 | 0.0000 | 1.0000 | |||
| 2 | 1 | 65 | 0.9385 | 0.0462 | 0.0000 | 0.0154 | 115 | 0.9391 | 0.0609 | 0.0000 | 0.0000 | ||
| 2 | 32 | 0.0938 | 0.8750 | 0.0313 | 0.0000 | 47 | 0.1702 | 0.7872 | 0.0426 | 0.0000 | |||
| 3 | 12 | 0.0833 | 0.1667 | 0.7500 | 0.0000 | 19 | 0.0000 | 0.0526 | 0.8421 | 0.1053 | |||
| 4 | 5 | 0.0000 | 0.0000 | 0.4000 | 0.6000 | 29 | 0.0000 | 0.0000 | 0.0345 | 0.9655 | |||
| 3 | 1 | 2 | 1.0000 | 0.0000 | 0.0000 | 0.0000 | 35 | 1.0000 | 0.0000 | 0.0000 | 0.0000 | ||
| 2 | 7 | 0.0000 | 1.0000 | 0.0000 | 0.0000 | 29 | 0.0000 | 0.9655 | 0.0345 | 0.0000 | |||
| 3 | 12 | 0.0000 | 0.0000 | 1.0000 | 0.0000 | 17 | 0.0000 | 0.0588 | 0.8824 | 0.0588 | |||
| 4 | 14 | 0.0000 | 0.0000 | 0.0000 | 1.0000 | 12 | 0.0000 | 0.0000 | 0.0000 | 1.0000 | |||
| 4 | 1 | 8 | 1.0000 | 0.0000 | 0.0000 | 0.0000 | 27 | 0.9459 | 0.0541 | 0.0000 | 0.0000 | ||
| 2 | 18 | 0.0000 | 0.8889 | 0.1111 | 0.0000 | 17 | 0.1053 | 0.7895 | 0.1053 | 0.0000 | |||
| 3 | 9 | 0.0000 | 0.0000 | 1.0000 | 0.0000 | 35 | 0.0000 | 0.0278 | 0.9167 | 0.0556 | |||
| 4 | 16 | 0.0000 | 0.0000 | 0.0000 | 1.0000 | 94 | 0.0000 | 0.0000 | 0.0000 | 1.0000 | |||
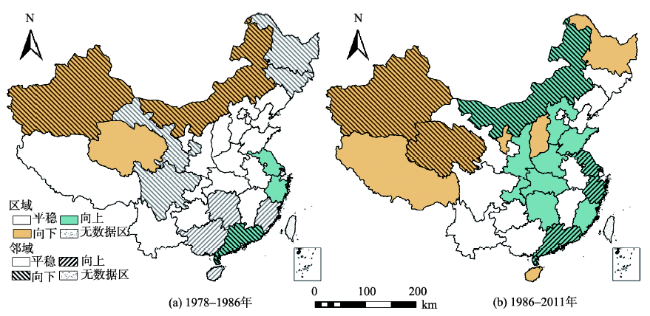
Fig.5 Spatial patterns of per capita consumption class transitions for regions and their neighborhoods at the regional level in China, 1978-2011图5 1978-2011年间我国地区消费水平及邻域类型转移的空间分布格局 |
The authors have declared that no competing interests exist.
| [1] |
|
| [2] |
|
| [3] |
|
| [4] |
|
| [5] |
|
| [6] |
|
| [7] |
|
| [8] |
|
| [9] |
|
| [10] |
|
| [11] |
|
| [12] |
|
| [13] |
|
| [14] |
|
| [15] |
|
| [16] |
|
| [17] |
|
| [18] |
|
| [19] |
|
| [20] |
|
| [21] |
|
| [22] |
|
| [23] |
|
/
| 〈 |
|
〉 |