
Journal of Geo-information Science >
Wetlands Classification and Analysis in Fuzhou Coastal Zone
Received date: 2013-10-23
Request revised date: 2013-11-20
Online published: 2014-09-04
Copyright
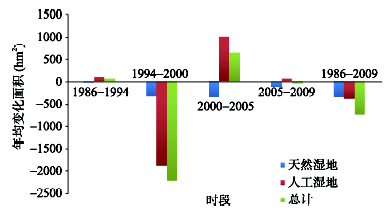
Based on the multi-sensors remote sensing data of Landsat TM acquired in 1986 and 1994, Landsat ETM+ acquired in 2000, CBERS-02 CCD acquired in 2005, and ALOS AVNIR-2 acquired in 2009, the wetlands in Fuzhou coastal zone were classified using stratified decision rules. The coastal wetlands were divided into two categories: natural wetlands and artificial wetlands, from which the natural wetlands include five classes, while the artificial wetlands include three classes. The spatial patterns and dynamic changes of coastal wetlands from 1986 to 2009 were analyzed. The main changes of coastal wetlands happened during 1994 to 2005, and there were only a few changes before 1994 and after 2005. From 1986 to 2009, the total area of wetlands had decreased. The area of natural wetlands had decreased during the whole period, and was mainly transformed into aquacultures and non-wetlands area such as construction lands. The area of artificial wetlands had decreased before 2000 and increased after 2000, in which the area of aquacultures had increased very rapidly, and were mainly transformed from non-wetlands area, paddy fields and natural wetlands. The spatial pattern and dynamic change of coastal zone was jointly affected by local policies adjustment, the driving of economic interests and population increase. The temporal wetlands changes were closely related to the local policies.
WANG XiaoQin , SHI YiFang , WEI Lan , WU Bo . Wetlands Classification and Analysis in Fuzhou Coastal Zone[J]. Journal of Geo-information Science, 2014 , 16(5) : 838 -833 . DOI: 10.3724/SP.J.1047.2014.00833
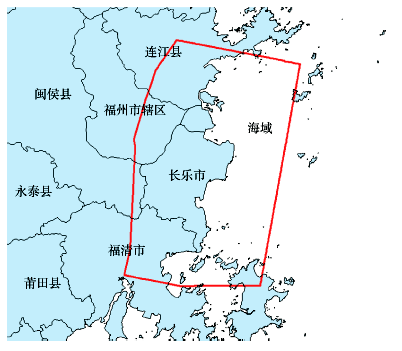
Fig.1 Study area图1 研究区域 |
Tab.1 Remote sensing data used in the study表1 研究所用遥感数据 |
| 卫星/传感器 | 波段数 | 分辨率(m) | 获取时间 |
|---|---|---|---|
| Landsat5 TM Landsat5 TM Landsat7 ETM+ | 6 6 6 | 30 30 30 | 1986-07-25 1994-11-04 2000-05-04 |
| CBERS-02 CCD | 4 | 20 | 2005-07-12 |
| ALOS AVNIR-2 | 4 | 10 | 2009-03-05 |
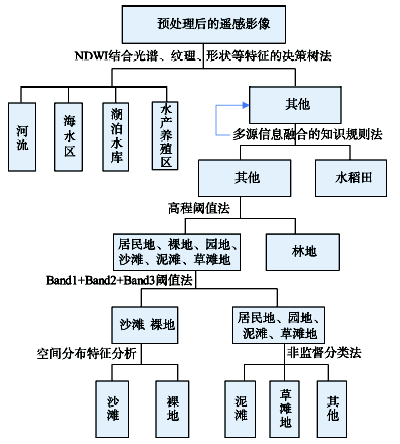
Fig.2 Technical process of wetlands hierarchical classification图2 湿地信息分层分类提取流程 |
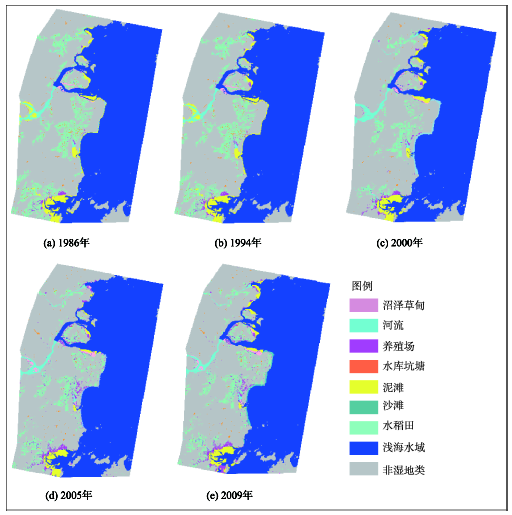
Fig.3 Spatial distribution of wetlands in coastal zone of Fuzhou from 1986 to 2009图3 1986-2009年福州海岸带湿地空间格局 |
Tab.2 Classification accuracy of coastal zone wetlands表2 海岸带湿地提取精度 |
| 年份 | 总体精度(%) | Kappa系数 |
|---|---|---|
| 1986 | 85.00 | 0.8258 |
| 1994 | 85.39 | 0.8304 |
| 2000 | 91.80 | 0.8930 |
| 2005 | 85.40 | 0.8309 |
| 2009 | 95.31 | 0.9329 |
Fig.4 Annual area changes of wetlands图4 湿地年平均变化面积 |
Tab.3 Wetland areas in coastal zone of Fuzhou from 1986 to 2009 (hm2)表3 1986-2009年福州海岸带湿地面积(hm2) |
| 湿地类型 | 年份 | |||||||
|---|---|---|---|---|---|---|---|---|
| 一级 | 二级 | 1986 | 1994 | 2000 | 2005 | 2009 | ||
| 天然湿地 | 海水区 | 181 291.80 | 181 221.60 | 179 125.40 | 178 734.70 | 178 744.50 | ||
| 河流 | 4805.80 | 4808.42 | 4775.51 | 4369.81 | 4414.36 | |||
| 泥滩 | 8942.97 | 8945.88 | 9518.40 | 8345.33 | 7838.72 | |||
| 沙滩 | 769.91 | 751.30 | 839.38 | 643.33 | 669.20 | |||
| 草滩地 | 1924.42 | 1721.50 | 1165.22 | 1567.52 | 1494.65 | |||
| 小计 | 197 734.90 | 197 448.70 | 195 423.91 | 193 660.69 | 193 161.43 | |||
| 人工湿地 | 水稻田 | 25 935.28 | 25 959.50 | 14 176.99 | 16 912.46 | 16 683.85 | ||
| 湖泊水库 | 751.96 | 750.70 | 474.78 | 636.92 | 644.51 | |||
| 水产养殖区 | 1393.70 | 2193.51 | 2960.81 | 5103.10 | 5613.08 | |||
| 小计 | 28 080.94 225 815.84 | 28 903.71 226 352.41 | 17 612.58 213 036.49 | 22 652.48 216 313.17 | 22 941.44 216 102.87 | |||
| 总计 | ||||||||
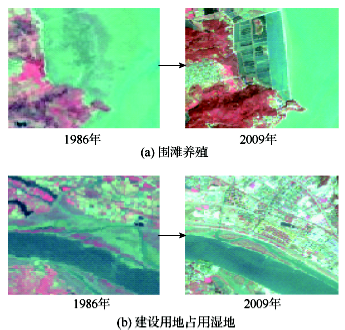
Fig.5 Natural wetlands occupied by artificial wetlands or non-wetlands图5 遥感影像所显示的部分天然湿地被占用情况 |
The authors have declared that no competing interests exist.
| [1] |
|
| [2] |
|
| [3] |
|
| [4] |
|
| [5] |
|
| [6] |
|
| [7] |
|
| [8] |
|
| [9] |
|
| [10] |
|
| [11] |
|
| [12] |
|
| [13] |
|
| [14] |
|
| [15] |
|
| [16] |
|
| [17] |
|
| [18] |
|
| [19] |
|
| [20] |
|
| [21] |
|
| [22] |
|
| [23] |
|
| [24] |
|
| [25] |
|
| [26] |
|
/
| 〈 |
|
〉 |