Orginal Article

A New Method to Detect False Change Polygons in Land Use/Cover Change Map Based on Symmetric Theory Model

  • GAO Xizhang , 1 ,
  • LIU HaiJiang , *, 2 ,
  • LI Baolin 1 ,
  • YUAN Yuecheng 1
Expand
  • 1. State Key Lab of Resources and Environmental Information System, Institute of Geographical Sciences and Natural Resources Research, CAS, Beijing 100101, China
  • 2. China National Environment Monitoring Center, Beijing 100012, China
*Corresponding author: LIU Haijiang, E-mail:

Received date: 2014-01-20

  Request revised date: 2014-06-13

  Online published: 2014-09-04

Copyright

《地球信息科学学报》编辑部 所有

Abstract

Co-registration error between two land use maps based on different dates can cause a considerable overestimation of the land use/cover change. Even a small amount of misregistration markedly reduces the accuracy of land cover change estimates. Without relevant information about misregistration, existing methods cannot work effectively to detect and eliminate the false changes caused by misregistration. In this paper, we propose a methodology (Symmetric Theory) from the viewpoint of the relationship between original land use polygon and the changed polygons to detect the false change caused by misregistration. Symmetric Theory presents that the area of ‘changing from’ and ‘changing to’ polygons overlaid from the original polygon is symmetric in some degree, if true change polygons are eliminated from the changing polygons. Based on this theory, an automated detecting model is designed and developed. A case study was conducted using this method based on two land cover maps from 1980 and 2000, and their simulated misregistration maps for Naiman County, Tongliao City, Inner Mongolia, China (a total area of 8137.6 km2). This study shows that this method can effectively discriminate the spurious land cover changes from true land cover changes with false change detection accuracy ranging from 75.0% to 87.4%, true change detection accuracy ranging from 71.2% to 93.8%, and overall detection accuracy ranging from 73.3% to 92.7%. However, with the image shifts from half to ten pixels (15m to 300m), the ability of detecting false changes decreases with the increase of image misregistration. And when using this method, the SI threshold should be set as 0.2-0.4. If no relevant knowledge is mentioned, 0.3 is the best choice.

Cite this article

GAO Xizhang , LIU HaiJiang , LI Baolin , YUAN Yuecheng . A New Method to Detect False Change Polygons in Land Use/Cover Change Map Based on Symmetric Theory Model[J]. Journal of Geo-information Science, 2014 , 16(5) : 784 -789 . DOI: 10.3724/SP.J.1047.2014.00784

1 引言

近30 a来,土地利用/覆被变化(LUCC)研究逐渐成为全球环境变化研究的前沿和核心课题[1-4]。土地利用/覆被变化数据作为全球环境变化、区域环境质量评价的核心基础数据,一般通过两个或多个时相的土地利用/覆被矢量图间的空间叠加操作来生成两个或多个时相间的土地利用/覆被变化图,通过变化图斑来表达对应的变化地块信息[5]。然而,不同时相的土地利用/覆被图间的空间配准误差会导致产生大量的伪变化图斑,对变化结果产生巨大影响[6-7]。而一旦土地利用/覆被变化检测出现伪信息,环境质量变化驱动力因素分析就易出现偏差,乃至错误。研究表明,当空间配准误差为原始影像分辨率的1/5时,会对变化面积估算结果产生10%左右的误差影响[8]。因此,检测并消除伪变化图斑对提高土地利用/覆被变化数据的精度具有重要意义。
常用的伪变化图斑检测方法主要根据图斑本身的几何特征来判断,认为面积小、形状狭长或是边界曲折的图斑为伪变化图斑。具体方法主要包括面积阈值法[9]、周长面积比方法[10-11]、矩形几何紧凑度法[12],以及边界宽度法[13-15]等。前3种方法使用过程中都需要设置一个区分真伪变化的阈值,该阈值的取值严重影响伪变化图斑检测精度,并且这些阈值在没有空间配准误差信息的情况下,只能根据经验主观确定。边界宽度法则需要根据原始影像校正的均方差[16-19]来确定沿多边形边界的缓冲区宽度,但大量积累的历史数据已经无法获取原始影像图的误差信息。因此,上述方法在依据历史数据进行环境变化研究时受到了很大制约,鉴此,本文提出一种不以先验知识可自动执行的伪变化图斑检测新方法,其可检测由于影像校正误差而引起的伪变化图斑,有效地解决现有土地利用/覆被伪变化检测方法应用中的问题。

2 图斑检测原理及方法

2.1 检测原理

为解释本文所提的检测原理,以图1中的土地利用图斑为例来阐述。图1(a)为2时相原始土地利用/覆被图斑(蓝色线内区域和红色线内区域),现实中土地利用/覆被类型没有发生变化,图斑土地利用/覆被类型为A,其邻接图斑的土地利用/覆被类型为B。图1(b)中土地利用/覆被变化全部由影像偏移误差(空间配准)所导致,变化图斑包括“A转变为B”(“转出”图斑,图中格线图斑)和“B转变为A”(“转入”图斑,图中斜线图斑)2类。从图1(b)看出,这2类伪变化图斑在分布面积上大致相等,可见其具有明显的对称性特征。
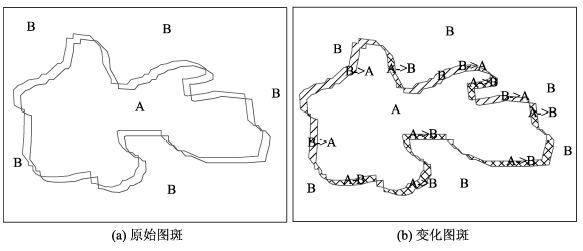
Fig.1 Example of false change polygons caused by misregistration

图1 空间配准误差导致的伪变化图斑示例

针对具有空间偏移误差的土地利用/覆被伪变化图斑,我们提出用面积对称系数(Symmetrical Index,SI)来表征同一原始图斑所产生的2类伪变化图斑的对称程度,其计算公式为:
SI = | A from - A to | A from + A to (1)
式(1)中,Afrom为所有“转入”图斑的面积和;Ato为所有“转出”图斑的面积和。SI的值域为0.0至1.0,该值越小,表明2类变化面积越对称,对应的变化图斑为伪变化图斑的可能性越大;反之,该值越接近于1.0,表明2类变化面积越不对称,对应的变化图斑为真变化图斑的可能性越大。

2.2 检测流程

由于几何校正误差导致的伪变化图斑检测过程,实际上是对土地利用/覆被变化图斑的分类过程,最终要将变化图斑分为真、伪2类。因此,需要设计一套检测处理流程,能将所有的变化图斑自动地分为2类(图2)。
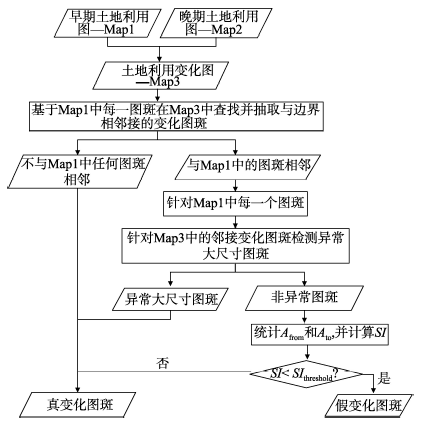
Fig.2 Flow chart of false change detection model based on Symmetric Theory Model

图2 基于面积对称模型的伪变化检测流程图

具体步骤为:(1)将2时相原始土地利用/覆被图进行叠加分析,生成土地利用/覆被变化图;(2)针对早期土地利用/覆被图中的每一原始土地利用/覆被图斑,查找邻接变化图斑,确定所查找的变化图斑的面积及土地利用/覆被变化类型(AfromAto);(3)针对每一原始图斑,采用肖维勒准则法剔除其邻接变化图斑中异常的大尺寸变化图斑(这种异常图斑通常为真变化图斑);(4)针对每一原始图斑,分别统计其转入图斑(Afrom)和转出图斑(Ato)的面积和,并计算SI值;如果SI值小于某一给定阈值,则所有与该原始图斑相邻接的变化图斑都判断为伪变化,否则判断为真变化。(5)针对第(1)步中的预处理结果,没有与任何原始图斑边界邻接的变化图斑,以及第(3)步中剔除异常的大尺寸变化图斑判断为真变化图斑。

3 图斑检测实验分析

3.1 实验数据及处理

本文以内蒙古自治区通辽市奈曼旗1980年和2000年2时相土地利用/覆被图为基础数据进行伪变化数据的模拟和检测。该数据来源于中国科学院土地利用/覆被变化数据库中[20]。研究区总面积为8137.6 km2,其土地利用分类采用一级分类(共分为6类)。1980年土地覆被图中包含4768个图斑,2000年数据中包含5381个图斑(图3),20年间土地利用真实变化面积为1895.2 km2,约占研究区总面积的23%左右。
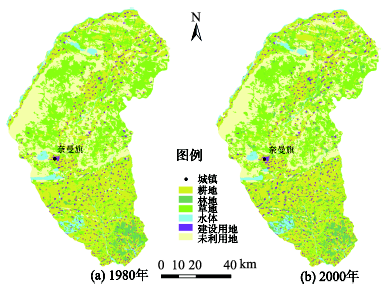
Fig.3 The Land-Use/Cover Map of Naiman County in 1980 and 2000

图3 奈曼旗1980年和2000年土地利用/覆被图

首先,以原始土地利用/覆被数据的影像分辨率(30 m)为基本单位,基于1980年数据向东南方向分别偏移0.5、1、2、3、4、5、6、7、8、9、10个像元距离,产生11幅土地利用/覆被数据,这11幅数据代表有空间几何校正误差的模拟数据。然后,基于1980年原始数据、模拟偏移数据与2000年数据进行空间叠加处理,生成一幅真实的土地利用/覆被变化图及11幅模拟的带有不同程度几何校正误差的土地利用/覆被变化图。

3.2 模型评价方法

本文采用3个指标来评价检测结果:伪变化检测精度、真变化检测精度和总体检测精度。
伪变化检测精度用来反映模型对伪变化图斑的识别能力,为正确检测出的伪变化图斑面积占伪变化图斑总面积的百分比,该值越大表明模型对伪变化图斑的识别能力越强,其计算公式为:
R df = A df A of × 100 % (2)
式(2)中,Rdf为伪变化检测精度;Adf为正确检测出的伪变化图斑面积和;Aof为所有伪变化图斑面积和。
真变化检测精度用来反映模型对真实变化图斑检测的能力,为正确检测出的真变化图斑面积占所有真变化图斑面积的百分比,其值越大表明模型对真变化图斑的识别能力越强,其计算公式为:
R dt = A dt A ot × 100 % (3)
式(3)中,Rdt为真变化检测精度;Adt为正确检测出的真变化图斑面积和;Aot为所有真变化图斑面积和。
总体检测精度用来反映模型对所有变化图斑的识别能力,为正确检测出的伪变化图斑与真变化图斑面积和占所有变化图斑面积的百分比,该值越大表明模型对真/伪变化图斑的综合检测能力越强,其计算公式为:
R do = A df + A dt A of + A ot × 100 % (4)
式(4)中,Rdo为总体检测精度;AdfAdt分别为检出的伪变化和真变化图斑面积和;AofAot分别为全部伪变化和真变化图斑面积总和。从式(4)可看出,只有在RdfRdt都较高时,总体检测精度才会较高,检测模型才更为有效。

3.3 模拟结果与分析

3.3.1 检测精度
为评价检测分类结果,需要获取真实真变化图,以及11幅模拟数据的真实伪变化图。真实真变化图可通过1980年与2000年土地利用/覆被图的空间求交操作来生成,真实伪变化图可通过11幅模拟变化数据与1980年土地利用/覆被图的空间求异操作来生成。基于检测结果图,以及真实真变化图、真实伪变化图,同时,设定不同的SI阈值,可统计不同SI阈值条件下的AdfAdt,与AofAot一起,再通过式(2)、(3)、(4)进一步计算各SI阈值下的RdfRdtRdo表1-3为间隔0.1的SI阈值下11幅模拟数据的RdfRdtRdo结果。
表1-3可看出,各检测精度随着误差距离的增加而下降,但在合理的阈值条件下,当误差距离少于2个像元时,其总体检测精度可达到88%以上;当误差距离少于5个像元时,其总体检测精度可达到81%以上;当误差距离少于10个像元时,其总体检测精度可达到73%以上。同时,对于同一误差下的模拟数据,伪变化检测精度随着SI阈值的增加而增加,如对于偏移5个像元的模拟数据,其Rdf从77.1%升至85.7%;真变化检测精度随着SI阈值的增加而降低,如对于偏移5个像元的模拟数据,其Rdt从83.3%降至70.8%。总体检测精度随着阈值增加先升后降,并在某一个阈值下达到最大值,如对于5个像元误差的模拟数据,其Rdo从80.5%升至81.7%又降至77.6%。从结果可以看出,随着SI阈值的增加,可正确检测出更多的伪变化图斑,导致Rdf增加,同时,也将更多的真变化图斑检测为伪变化图斑,从而导致Rdt下降,因此,总体检出精度RdoRdfRdt二者之间的平衡。
Tab.1 False change detection accuracy with different SI threshold(%)

表1 不同SI阈值下伪变化检测精度(%)

误差
(像元)
SI阈值
0.1 0.2 0.3 0.4 0.5 0.6 0.7 0.8 0.9
0.5 86.30 88.51 89.13 89.56 89.75 89.85 89.95 90.13 90.26
1 84.41 86.65 87.40 87.72 87.99 88.15 88.36 88.47 88.69
2 82.88 84.97 85.96 86.23 86.67 86.84 87.05 87.15 87.29
3 81.14 84.38 85.27 85.90 86.15 86.51 86.65 86.79 86.85
4 80.72 84.23 85.49 86.06 86.42 86.69 86.91 86.98 87.05
5 77.11 82.21 83.57 84.46 84.92 85.32 85.46 85.58 85.66
6 73.92 80.10 82.19 83.06 83.60 83.89 84.16 84.31 84.41
7 69.51 77.72 80.45 81.50 81.94 82.37 82.69 82.83 82.99
8 66.40 74.69 78.72 80.03 80.56 80.94 81.34 81.51 81.75
9 61.10 73.42 77.22 78.86 79.60 80.10 80.50 80.67 80.95
10 58.05 70.97 74.96 76.45 77.31 77.86 78.31 78.61 78.84
Tab.2 True change detection accuracy with different SI threshold(%)

表2 不同SI阈值下真变化检测精度(%)

误差
(像元)
SI阈值
0.1 0.2 0.3 0.4 0.5 0.6 0.7 0.8 0.9
0.5 97.32 96.48 96.35 96.17 95.96 95.65 95.45 94.67 93.05
1 94.77 93.97 93.77 93.32 93.19 92.65 92.51 91.68 89.93
2 90.79 90.03 89.56 88.48 87.83 87.42 86.97 86.15 84.55
3 87.51 86.06 85.16 84.4 83.53 82.71 82.24 81.05 79.18
4 84.52 82.14 80.41 79.41 78.75 78.24 77.62 76.35 73.83
5 83.32 80.19 78.36 77.24 76.28 75.53 74.92 73.71 70.77
6 81.48 78.08 75.69 74.69 73.41 72.74 72.09 70.45 67.68
7 81.03 76.74 74.38 72.68 71.71 70.70 69.49 68.32 66.40
8 80.59 76.02 72.84 71.11 70.02 69.21 67.61 66.36 63.34
9 80.68 74.85 71.89 69.98 68.52 67.56 65.92 64.31 61.48
10 80.10 74.38 71.18 69.33 67.96 67.06 65.81 63.74 60.75
Tab.3 Overall detection accuracy with different SI threshold (%)

表3 不同SI阈值下总体检测精度(%)

误差
(像元)
SI域值
0.1 0.2 0.3 0.4 0.5 0.6 0.7 0.8 0.9
0.5 95.24 95.69 95.64 95.52 95.35 95.08 94.91 94.23 92.78
1 92.16 92.70 92.66 92.34 92.28 91.87 91.78 91.12 89.71
2 88.52 88.53 88.58 87.83 87.50 87.25 86.99 86.44 85.34
3 85.19 85.44 85.52 84.94 84.48 84.10 83.85 83.14 81.98
4 82.93 83.02 83.54 82.20 81.96 81.78 81.51 80.81 79.37
5 80.47 81.12 81.76 80.56 80.25 80.02 79.76 79.16 77.60
6 77.78 79.07 79.87 78.79 78.40 78.20 78.00 77.24 75.87
7 75.12 77.24 77.49 77.21 76.96 76.69 76.27 75.77 74.92
8 73.03 75.31 75.97 75.85 75.63 75.45 74.92 74.42 73.14
9 69.95 74.07 74.81 74.84 74.59 74.43 73.91 73.27 72.15
10 67.73 72.47 73.30 73.32 73.2 73.12 72.82 72.08 70.90
3.3.2 阈值的设定
对于一个独立的原始图斑,理论上SI值应该接近于0,且原始图斑的几何特征在误差偏移方向上越对称,SI越接近于0。但在实际土地利用/覆被变化图中,由于真实土地利用/覆被图斑的几何特征的不对称性和相邻图斑的干扰,SI值都和理论状态有一定的差距,因此,SI的阈值不能设为0。
为确定SI的合理阈值,我们分析0.5~10个像元偏移误差情况下总体检测精度的平均值随SI阈值的变化(图4)。从图4可看出,平均总体检测精度随着阈值的增加先升后降,并在阈值为0.3时达到峰值,平均总体检测精度超过了82%。同时,从表3还可看出,不同偏移距离情况下,检测精度的峰值都出现在0.2-0.4之间,因此可认为0.2-0.4区间为比较合理的阈值范围。

4 结语

针对几何校正误差参数缺失的历史土地利用/覆被数据,本文以自动化检测为目标,运用伪变化图斑面积对称理论,提出了面向因几何校正误差导致的土地利用/覆被伪变化图斑的检测模型和方法。结果表明,在0.2-0.4区间SI阈值条件下,本检测模型针对0.5-10个像元误差的模拟数据,可获得95.6%~73.3%的总体检测精度。但当偏移误差增大时,其总体检测精度显著降低,在10个像元时,其总体检测精度只有70%左右。因此,本模型不建议用于偏移误差超过10个原始影像像元的伪变化检测。在使用本模型时,SI阈值可设为0.2-0.4之间,且偏移误差越小,其阈值可越小,在没有误差先验知识的情况下,建议设为0.3。
本文提出的检测模型的参数可相对固定,以便满足那些无法获取几何校正误差参数的历史土地利用/覆被数据的变化检测要求。同时,本模型的运行无需任何先验及专家知识,能实现伪变化图斑的自动化检测。但由于时间和实验数据的限制,本模型还存在以下不足:(1)研究区边界处的伪变化图斑,由于边界处图斑的非对称性,误检率较高,需采用其他方法进行检测;(2)在真伪变化混合区域,尤其是小面积的真变化区域,该模型检测精度较低。另外,本模型是否对较高分辨率影像生成的土地利用/覆被变化图有效,还需进一步的实验和验证。

The authors have declared that no competing interests exist.

[1]
Mas J F.Change estimates by map comparison: A method to reduce erroneous changes due to positional error[J]. Transactions in GIS, 2005,9(4):619-629.

[2]
Zhou Q, Li B, Kurban A.Trajectory analysis of land cover change in arid environment of China[J]. International Journal of Remote Sensing, 2008,29(4):1093-1107.

[3]
Pedro S, Cidália C F, Mário C, et al.Incorporating the uncertainty of linguistic-scale reference data to assess accuracy of land cover maps using fuzzy intervals[J]. International Journal of Remote Sensing, 2013,34(11):4008-4024.

[4]
Zhou Q, Li B, Kurban A.Spatial pattern analysis of land cover change trajectories in Tarim Basin, northwest China[J]. International Journal of Remote Sensing, 2008,29(19):5495-5509.

[5]
Chrisman N R.Modelling error in overlaid maps[M]. Accuracy of spatial databases. London: CRC Press, 1989: 21-33.

[6]
Salas W, Boles S, Frolking S, et al.The perimeter/area ratio as an index of misregistration bias in land cover change estimates[J]. International Journal of Remote Sensing, 2003,24(5):1165-1170.

[7]
Plewe B.The Nature of Uncertainty in Historical Geographic Information[J]. Transactions in GIS, 2002,6(4):431-456.

[8]
Dai X, Khorram S.The effects of image misregistration on the accuracy of remotely sensed change detection[J]. IEEE Transactions on Geoscience and Remote Sensing, 1998,36(5):1566-1577.

[9]
Veregin H.Error modeling for the map overlay operation[M]. The Accuracy of Spatial Databases. CA: NCGIA, 1989:3-18.

[10]
Rybaczuk K.Using information based rules for sliver polygon removal in GISs[M]. Geographic Information Systems, Spatial Modelling, and Policy Evaluation. New York: Springer-Verlag, 1993:85-102.

[11]
Farina A.Principles and Methods in Landscape Ecology[M]. London: Chapman &Hall, 1998:235.

[12]
Unwin D.Introductory Spatial Analysis[M]. London: Methuen, 1981:95-102.

[13]
Chrisman N, Lester M.A Diagnostic Test for Error in Categorical Maps[C]. 51st Annual Convention of the American Congress on Surveying and Mapping, Baltimore, 1991:330-348.

[14]
Chrisman N R.A theory of cartographic error and its measurement in digital databases[C]. Proceedings of Auto-Carto,Virginia, 1982:159-168.

[15]
Goodchild M F.Data models and data quality: problems and prospects[M]. Environmental Modeling with GIS. New York: Oxford University Press,1993:94-102.

[16]
Mas J F.Change estimates by map comparison: a method to reduce erroneous changes due to positional error[J]. Transactions in GIS, 2005,9(4):619-629.

[17]
Veregin H.Integration of simulation modeling and error propagation for the buffer operation in GIS[J]. Photogrammetric Engineering and Remote Sensing,1994,60(4):427-435.

[18]
Aspinall R J, Pearson D M.Describing and managing uncertainty of categorical maps in GIS[J].Innovations in GIS,1995,2:71-83.

[19]
Edwards G, Lowell K.Modeling uncertainty in photo interpreted boundaries[J]. Photogrammetric Engineering and Remote Sensing,1996,62(4):377-390.

[20]
Liu J Y, Liu M L, Tian H Q, et al.Spatial and temporal patterns of China's cropland during 1990-2000: An analysis based on Landsat TM data[J]. Remote Sensing of Environment,2005,98(4):442-456.

Outlines

/