
Journal of Geo-information Science >
The Impact of Road Development on Landscape Pattern Change in Rapidly Urbanizing Area
Received date: 2013-12-30
Request revised date: 2014-04-05
Online published: 2014-11-01
Copyright
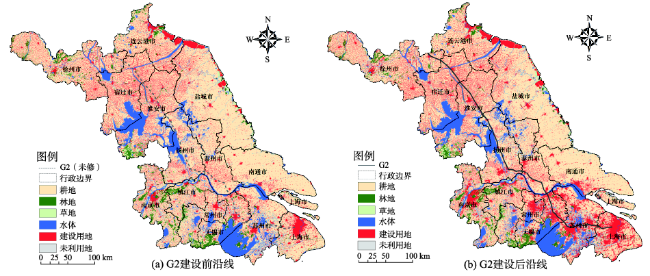
Understanding the mechanism of how road development lays profound impacts on the landscape change is significant for regional sustainable development. This paper takes the YRD section of Beijing-Shanghai Expressway as a case, analyzes the remote sensing images in 1995, 2000, 2005 and 2010,and utilizes buffer zone analysis method to estimate the change rate of the landscape quantity structure and landscape pattern index in different periods and regions. Meanwhile, the correlation analysis and nonlinear regression methods are adopted to investigate the relationship between the change rate of landscape pattern and the buffer zone distance. The results from this study indicated the following points: firstly, the construction of G2 expressway generated an axial impact on landscape pattern change. In rapidly urbanizing areas, there is a negative correlation between the change rate of landscape pattern and the buffer distance, which is different from the case of Qinghai-Tibet Highway. Secondly, there is a significant impact of main roads on the succession rule of landscape pattern along the rapidly urbanizing areas, which has broader and stronger effects than the roads in ecologically fragile areas. Finally, the construction of main roads has different temporal and spatial gradient impacts on the succession rule of landscape pattern. With the development of urbanization, the road's effects on the landscape pattern become more obvious. The influence range of G2 is expanding, which was increased from 6 km during the period of 2000-2005 to 9 km during 2005-2010. In addition, in YRD region, the axial affection is more remarkable in cities with low degree of urbanization than those with high degree of urbanization. By combining buffer zone analysis, correlation analysis and nonlinear regression, as well as calculating the change rate of landscape pattern characteristics indices in different periods and regions, we could effectively assess the influence degree and scope of main roads on the landscape pattern change along the roads.
CAO Wuxing , LUO Feixiong , HAN Ji , WU Caiyan , XIANG Weining . The Impact of Road Development on Landscape Pattern Change in Rapidly Urbanizing Area[J]. Journal of Geo-information Science, 2014 , 16(6) : 898 -906 . DOI: 10.3724/SP.J.1047.2014.00898
Fig. 1 The location of G2 and landscape pattern along the roads图1 G2地理位置及沿线景观示意图 |
Tab. 1 Introduction of research indices表1 研究指标介绍 |
| 指标名称 | 计算公式 | 定义描述 |
|---|---|---|
| 土地利用动态度 | 和分别为研究期初和期末某种土地利用类型的面积,T为研究时段长度,当T设为年时,K为某种土地利用类型面积的年变化率 | |
| 综合土地利用动态度 | 为监测起始时刻第i类土地利用类型的面积;为监测时段第i类土地利用类型转换为第j类土地利用类型的面积;T为检测时段长度 | |
| 土地利用程度综合指数 | 取值100到400,为第i级的土地利用程度分级指数;为第i级土地利用程度分级面积百分比 | |
| 斑块密度 | N代表斑块数,A为区域面积,定义为每km2的斑块数,取值无上限 | |
| 分维数 | 反映斑块的复杂程度 | |
| 多样性指数 | 为斑块i在总面积中的比重,反映景观中各类斑块的复杂性和变异性的度量 |
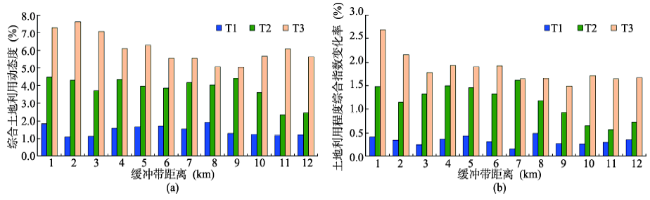
Fig. 2 The change of landscape quantity structure characteristic index of buffer zones图2 缓冲带不同时期景观数量结构特征指数变化率 |
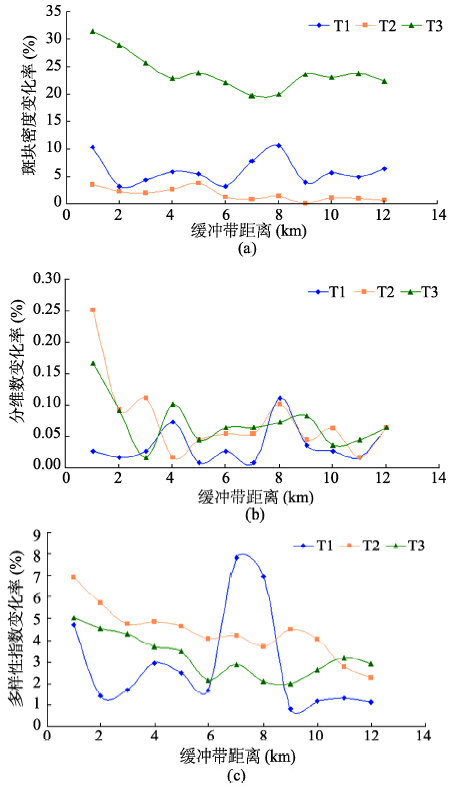
Fig. 3 The change of landscape pattern index of buffer zones图3 缓冲带不同时期景观格局指数变化率 |
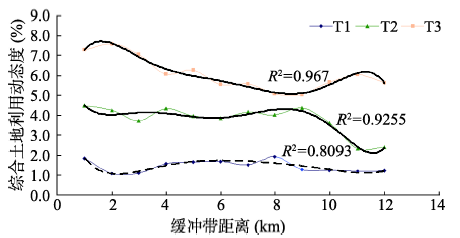
Fig. 4 The fitting curves of LC value in buffer zones within different periods图4 不同时期道路缓冲带LC值变化拟合曲线 |
Tab. 2 Correlation between the buffer distance and the change rate of landscape quantity structure characteristic index表2 缓冲带距离与景观数量结构特征指数变化率的相关系数及显著性 |
| 时段 | 土地利用程度综合指数 | 综合土地利用动态度 |
|---|---|---|
| T1 | -0.207 | -0.262 |
| T2 | -0.760(P<0.01) | -0.709(P<0.01) |
| T3 | -0.772(P<0.01) | -0.761(P<0.01) |
Tab. 3 Correlation between the buffer distance and landscape dynamic degree表3 缓冲带距离与各景观动态度变化率的相关系数及显著性 |
| 景观类型 | T1 | T2 | T3 |
|---|---|---|---|
| 整体景观 | -0.262 | -0.709(P<0.01) | -0.761(P<0.01) |
| 耕地 | -0.468(P<0.05) | -0.719(P<0.01) | -0.832(P<0.01) |
| 林地 | -0.120 | -0.532(P<0.05) | -0.321 |
| 水体 | -0.507(P<0.05) | -0.453(P<0.05) | -0.644(P<0.05) |
| 建设用地 | -0.024 | -0.787(P<0.01) | -0.703(P<0.01) |
Tab. 4 Correlation between the buffer distance and the change rate of landscape pattern index表4 缓冲带距离与景观格局指数变化率的相关系数及显著性 |
| 景观指数 | T1 | T2 | T3 |
|---|---|---|---|
| 斑块密度 | -0.038 | -0.748(P<0.01) | -0.655(P<0.05) |
| 分维数 | -0.210 | -0.557(P<0.05) | -0.469(P<0.05) |
| 多样性指数 | -0.187 | -0.898(P<0.01) | -0.745(P<0.01) |
Tab. 5 Correlation between the buffer distance and landscape dynamic degree in different regions表5 不同地域段景观动态度与缓冲带距离相关系数及显著性 |
| 景观类型 | 苏北段 | 苏南段 | 上海段 |
|---|---|---|---|
| 整体景观 | -0.445(P<0.05) | -0.915(P<0.01) | -0.545(P<0.05) |
| 耕地 | -0.754(P<0.01) | -0.834(P<0.01) | -0.409(P<0.05) |
| 林地 | -0.065 | -0.486(P<0.05) | -0.509(P<0.05) |
| 水体 | -0.839(P<0.01) | -0.853(P<0.01) | -0.563(P<0.05) |
| 建设用地 | -0.788(P<0.01) | -0.588(P<0.05) | -0.488(P<0.05) |
The authors have declared that no competing interests exist.
| [1] |
|
| [2] |
|
| [3] |
|
| [4] |
|
| [5] |
|
| [6] |
|
| [7] |
|
| [8] |
|
| [9] |
|
| [10] |
|
| [11] |
|
| [12] |
|
| [13] |
|
| [14] |
|
| [15] |
|
| [16] |
|
| [17] |
|
| [18] |
|
| [19] |
|
| [20] |
|
| [21] |
|
| [22] |
|
| [23] |
|
| [24] |
|
| [25] |
|
| [26] |
|
| [27] |
|
| [28] |
|
| [29] |
|
| [30] |
|
| [31] |
|
| [32] |
|
/
| 〈 |
|
〉 |