
Journal of Geo-information Science >
Spatio-temporal Pattern of NPP and Related Analyses with Terrain Factors in Wuling Mountainous Area
Received date: 2013-01-06
Request revised date: 2014-03-24
Online published: 2014-11-01
Copyright
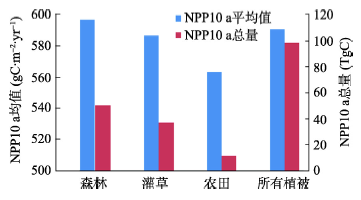
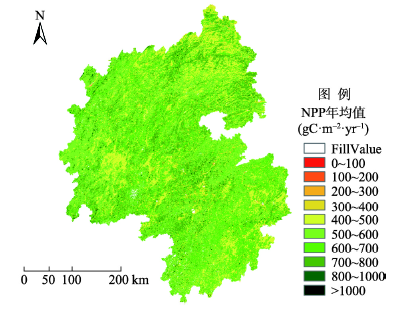
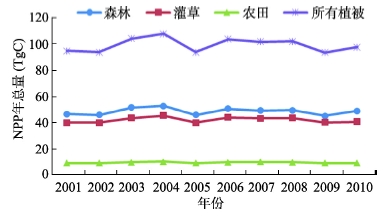
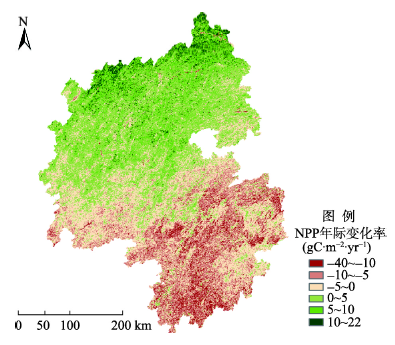
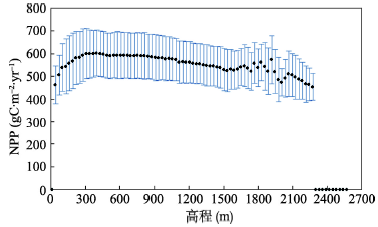
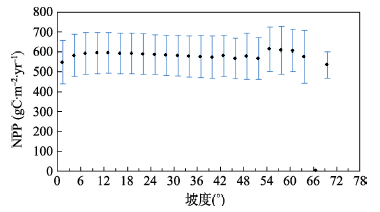
Based on MODIS NPP data, terrain data and land cover map, spatio-temporal pattern of the NPP in Wuling mountainous area during 2001-2010 and its relationship with the elevation and the slope were analyzed using regression analysis and classification statistics. Results showed that the average annual NPP of the study area from 2001 to 2010 was 590.72 gC·m-2·yr-1. The mean NPP of forest, shrub/grassland and cropland were 596.79 gC·m-2·yr-1, 586.98 gC·m-2·yr-1 and 563.31 gC·m-2·yr-1 respectively. During 2001-2010, the average annual total NPP of Wuling mountainous area was 98.90 TgC·yr-1, ranging from 92.79 TgC·yr-1 to 106.99 TgC·yr-1. Besides, the spatial pattern of interannual variability of NPP in the north of our study area presented a significant increase trend, while in the south it indicated an opposite tendency. According to the relationships between the mean NPP and the elevation as well as the slope in the case of 30 m and 3° respectively, NPP increased with the altitude and slope first, then decreased slowly. But when the elevation went above 1500 m or the slope was greater than 50°, the mean NPP would present large fluctuations. However, as a whole, the mean NPP increased with the altitude and the slope first, then decreased again. Additionally, the mean NPP within the elevation range of 200~1000 m and the slope range of 5~25° were relatively high, but it decreased gradually from the range of 500 m and above, and had a trend of increase when the slope went greater than 50°, which reflected the erosion intensity was weakened when the slope was greater than a certain threshold.
SUN Qingling , FENG Xianfeng , XIAO Xiao . Spatio-temporal Pattern of NPP and Related Analyses with Terrain Factors in Wuling Mountainous Area[J]. Journal of Geo-information Science, 2014 , 16(6) : 915 -924 . DOI: 10.3724/SP.J.1047.2014.00915
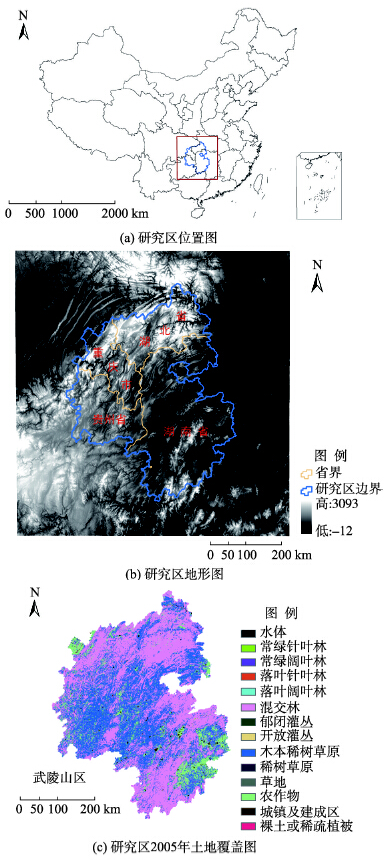
Fig. 1 Location, terrain and land cover maps of the study area in 2005图1 研究区位置、地形及2005年土地覆盖图 |
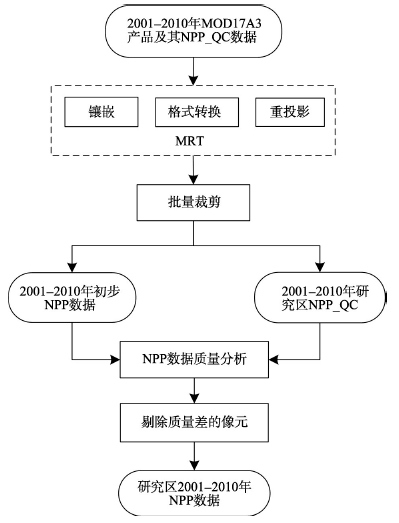
Fig. 2 The processing procedure of MODIS NPP data图2 MODIS NPP数据的处理流程 |
Tab. 1 Statistics of 2001-2010 MODIS NPP_QC data表1 2001-2010年MODIS NPP产品反演质量的统计信息 |
| 年份 | NPP反演结果的可信度(像元比例:%) | |||
|---|---|---|---|---|
| 高 | 中 | 低 | 反演失败 | |
| 2001 | 0.11 | 92.44 | 7.45 | 0.00 |
| 2002 | 0.23 | 94.79 | 4.98 | 0.00 |
| 2003 | 0.19 | 87.20 | 12.61 | 0.00 |
| 2004 | 0.39 | 95.43 | 4.18 | 0.00 |
| 2005 | 0.18 | 85.43 | 14.39 | 0.00 |
| 2006 | 0.19 | 88.72 | 11.09 | 0.00 |
| 2007 | 0.19 | 91.78 | 8.03 | 0.00 |
| 2008 | 0.19 | 91.74 | 8.07 | 0.00 |
| 2009 | 0.19 | 89.38 | 10.43 | 0.00 |
| 2010 | 0.05 | 92.16 | 7.79 | 0.00 |
Tab. 2 Interval divisions of elevation and slope within Wuling mountainous area表2 武陵山区高程及坡度的区间划分 |
| 地形因子 | 区间划分 | 区间含义 | 划分依据 |
|---|---|---|---|
| 高程 | ≤200 m | 平原地区 | 文献[29]中的高程分级标准,结合武陵山区的实际情况细化 |
| 200~500 m | 丘陵地区 | ||
| 500~1000 m | 低山 | ||
| 1000~1500 m | 中山 | ||
| >1500 m | 研究区海拔较高区域 | ||
| 坡度 | ≤2° | 平原至微倾斜平原 | 国际地理学会地貌调查与制图委员会对坡地的分级标准[30],结合研究区具体情况微调 |
| 2~5° | 缓坡地 | ||
| 5~15° | 斜坡地 | ||
| 15~25° | 陡坡地 | ||
| 25~35° | 急坡 | ||
| 35~50° | 急陡坡 | ||
| >50° | 垂直坡 |
Fig. 4 Mean and total annual NPP for different vegetation types in Wuling mountainous area图4 2001-2010年武陵山区不同植被类型的平均NPP及其总量 |
Fig. 3 Spatial distribution of mean NPP in Wuling mountainous area during 2001-2010图3 武陵山区2001-2010年平均植被NPP的空间分布图 |
Fig. 5 Dynamic changes of total annual NPP in Wuling mountainous area during 2001-2010图5 2001-2010年武陵山区NPP总量变化动态 |
Fig. 6 The spatial pattern of NPP interannual variability in Wuling mountainous area图6 武陵山区植被NPP绝对年际变化率的空间格局 |
Fig. 7 Map of the relative NPP interannual variability overlaid on DEM data图7 NPP相对年际变化率与DEM数据叠加图 |
Fig. 8 Relationship between NPP and elevation图8 植被NPP与高程间的关系 |
Fig. 9 Relationship between NPP and slope图9 植被NPP与坡度间的关系 |
Tab. 3 Comparison of NPPs in different elevation ranges in Wuling mountainous area表3 武陵山区不同高程带的植被NPP 分级比较 |
| 统计量 | 高程(m) | ||||
|---|---|---|---|---|---|
| ≤200 | 200~500 | 500~1000 | 1000~1500 | >1500 | |
| 面积比例(%) | 4.32 | 30.68 | 43.34 | 18.03 | 3.63 |
| 平均NPP(gC·m-2·yr-1) | 557.35 | 602.26 | 595.76 | 567.66 | 535.10 |
| NPP总量(TgC·yr-1) | 3.05 | 30.28 | 47.36 | 14.91 | 3.23 |
Tab. 4 Comparison of NPPs in different slope ranges in Wuling mountainous area表4 武陵山区不同坡度带的植被NPP分级比较 |
| 统计量 | 坡度(°) | ||||||
|---|---|---|---|---|---|---|---|
| ≤2 | 2~5 | 5~15 | 15~25 | 25~35 | 35~50 | >50 | |
| 面积比例(%) | 6.64 | 10.09 | 39.78 | 29.75 | 11.09 | 2.49 | 0.16 |
| 平均NPP(gC·m-2·yr-1) | 549.95 | 583.54 | 595.01 | 592.65 | 583.97 | 577.94 | 613.06 |
| NPP总量(TgC·yr-1) | 4.15 | 9.03 | 43.05 | 30.34 | 9.90 | 2.09 | 0.10 |
The authors have declared that no competing interests exist.
| [1] |
|
| [2] |
|
| [3] |
|
| [4] |
|
| [5] |
|
| [6] |
|
| [7] |
|
| [8] |
|
| [9] |
|
| [10] |
|
| [11] |
|
| [12] |
|
| [13] |
|
| [14] |
|
| [15] |
|
| [16] |
|
| [17] |
|
| [18] |
|
| [19] |
|
| [20] |
|
| [21] |
|
| [22] |
|
| [23] |
|
| [24] |
|
| [25] |
|
| [26] |
|
| [27] |
|
| [28] |
|
| [29] |
|
| [30] |
|
| [31] |
|
/
| 〈 |
|
〉 |
