
Detection and Analysis of Qinghai-Tibet Plateau Lake Area from 2000 to 2013
Received date: 2014-02-10
Request revised date: 2014-04-11
Online published: 2015-01-05
Copyright
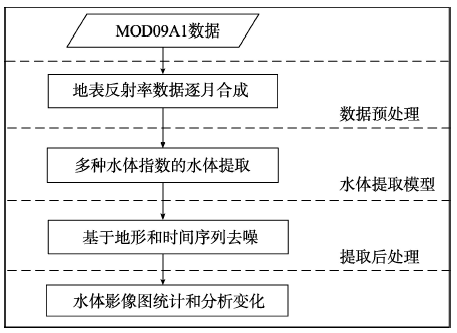
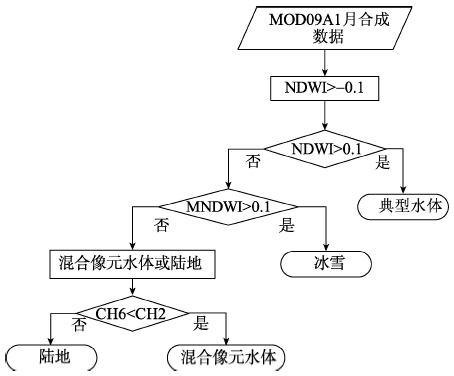
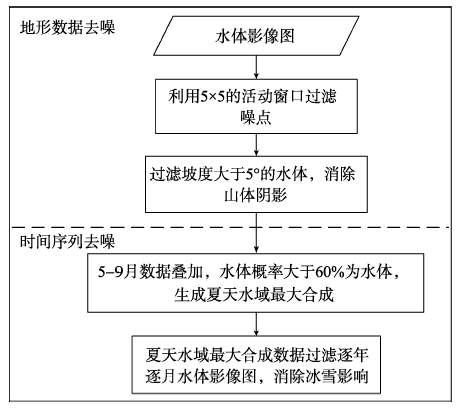
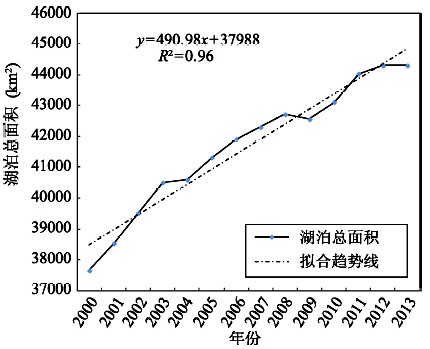
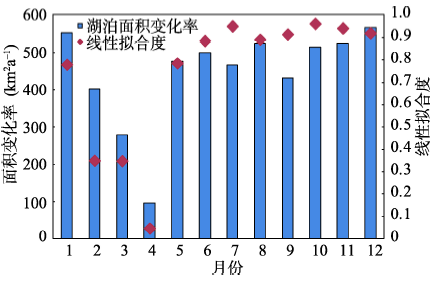
Qinghai-Tibet plateau is the world's highest and largest plateau which is surrounded by massive mountain ranges. There are plenty of lakes and glaciers covering this area, and the variation of lake area is closely related to the regional and global climate changes. This paper presents a method using MODIS observations to quantify lake area in each month in Qinghai-Tibet plateau for 14 years, and then analyzes the change of lake area at both monthly and annually scales. MODIS surface reflectance data (MOD09A1) acquired within the period of each month are retrieved and composited to produce the optimal and cloud-free SR data of the month, which are adopted as the input data. In order to achieve better accuracy on water detection, multiple water indices are combined, and then the DEM and summer season water maps are adopted to remove noisy pixels caused by cloud, shadow, snow and ice. With this approach, the monthly and annually lake area is derived for Qinghai-Tibet plateau from 2000 to 2013.Subsequently,the accuracy of these results are evaluated by correlation coefficient calculated with respect to the artificial interpreted Landsat products assigned as reference for Selin Co lake and Zhuonai lake, respectively. The comparisons show high consistency on both spatial and temporal aspects(R2 is 0.99 and 0.97). Finally, the variation tendency of lakes in Qinghai-Tibet plateau is analyzed, the results show: (1) a stable increase is obvious (R2 is 0.96) for the lake area during the past 14 years with an average annual increase rate of 490.98 km2a-1; (2)monthly increment indicates lake expansion is unlikely due to seasonality in Qinghai-Tibet plateau. Stable increases (R2> 0.78, increase rate > 400 km2a-1) are also found in every month of the year except February, March and April.
Key words: MODIS; Qinghai-Tibet plateau; lakes change; lakes detection
CHE Xianghong , FENG Min , JIANG Hao , XIAO Tong , WANG Changzuo , JIA Bei , BAI Yan . Detection and Analysis of Qinghai-Tibet Plateau Lake Area from 2000 to 2013[J]. Journal of Geo-information Science, 2015 , 17(1) : 99 . DOI: 10.3724/SP.J.1047.2015.00099
Tab. 1 Part of the channel information of MODIS表1 MODIS部分通道信息 |
| 波段(地面分辨率) | 光谱范围(nm) | 光谱范畴 | 主要应用领域 |
|---|---|---|---|
| B1(250 m) | 620~670 | 可见光(红) | 植物叶绿素吸收 |
| B2(250 m) | 841~876 | 近红外 | 云与植物,土地被 |
| B3(500 m) | 459~479 | 可见光(蓝) | 土壤植被差异 |
| B4(500 m) | 545~565 | 可见光(绿) | 绿色植物 |
| B5(500 m) | 1230~1250 | 近红外 | 叶子/冠层差异 |
| B6(500 m) | 1628~1652 | 短波红外 | 雪/云差异 |
| B7(500 m) | 2105~2135 | 短波红外 | 土地与云特性 |
Fig. 1 Flow chart of water extraction from MODIS images图1 MODIS影像水体提取流程图 |
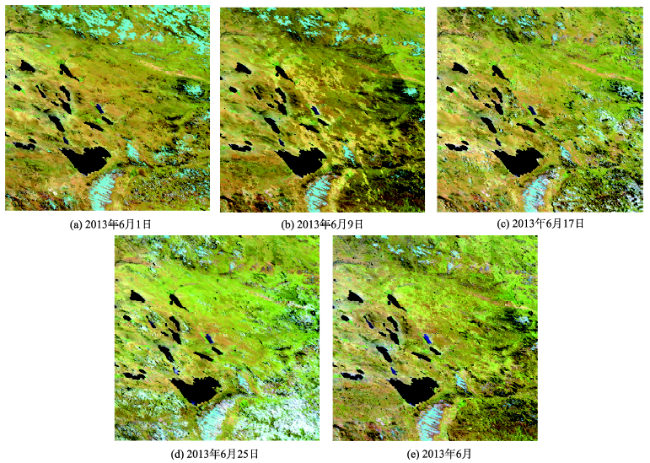
Fig. 2 Comparison of images before and after the application of best-pixel composition图2 影像最优合成前后对比图 |
Fig. 3 Flow chart of lake detection based on multiple water indices图3 基于多种水体指数湖泊提取方法流程图 |
Fig. 4 Flow chart of noisy pixels removal based on topographic data and time series analysis图4 基于地形数据与时间序列的去噪流程图 |
Tab. 2 Comparison of water area derived from Landsat and MODIS data for SelinCo lake表2 MODIS与Landsat提取色林错湖泊面积比较 |
| 数据源 | 时间 | 面积(km2) | 数据源 | 时间 | 面积(km2) |
|---|---|---|---|---|---|
| Landsat | 2000-10-17 | 1934.41 | MODIS | 2000-10 | 1930.29 |
| 2005-11-14 | 2244.81 | 2005-11 | 2243.00 | ||
| 2006-11-17 | 2254.73 | 2006-11 | 2282.27 | ||
| 2007-10-03 | 2275.74 | 2007-10 | 2291.71 | ||
| 2010-05-04 | 2304.73 | 2010-05 | 2321.33 | ||
| 2011-08-27 | 2353.02 | 2011-08 | 2343.87 | ||
| 2013-05-28 | 2379.57 | 2013-05 | 2360.82 |
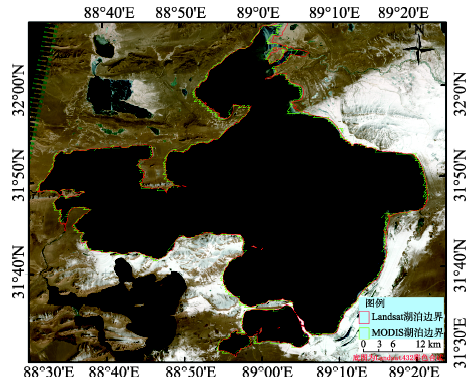
Fig. 5 Comparison ofspatial distributions derived from Landsat and MODIS data for Selin Co lake图5 MODIS与Landsat提取色林错湖泊空间分布对比 |
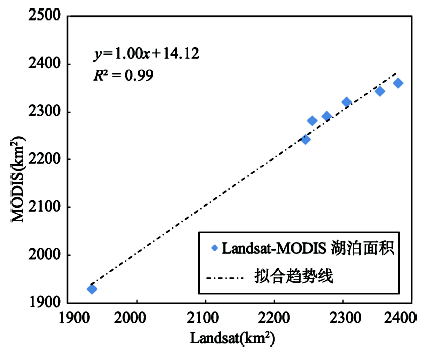
Fig. 6 Scatterplot of water area derived from Landsat and MODIS data for Selin Co lake图6 MODIS与Landsat提取色林错湖泊面积散点图 |
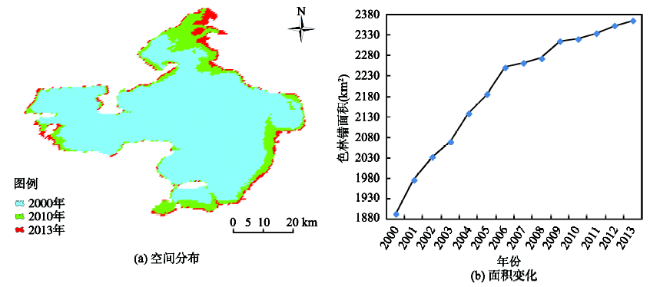
Fig. 7 Spatial and temporal changes of Selin Co lake图7 色林错水域面积变化 |
Tab. 3 Comparison of water area derived from Landsat and MODIS data for Zhuonai lake表3 MODIS与Landsat提取卓乃湖湖泊面积比较 |
| 数据源 | 时间 | 面积(km2) | 数据源 | 时间 | 面积(km2) |
|---|---|---|---|---|---|
| Landsat | 2000-04-15 | 254.73 | MODIS | 2000-04 | 239.73 |
| 2003-10-17 | 256.11 | 2003-10 | 256.04 | ||
| 2005-03-12 | 255.92 | 2005-03 | 242.09 | ||
| 2006-09-07 | 259.16 | 2006-09 | 261.62 | ||
| 2007-07-24 | 261.89 | 2007-07 | 255.18 | ||
| 2010-04-27 | 264.09 | 2010-04 | 258.83 | ||
| 2013-08-09 | 159.44 | 2013-08 | 162.04 |
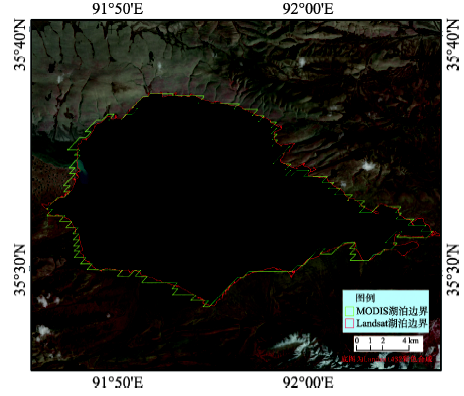
Fig. 8 Comparison of spatial distributions derived from Landsat and MODIS data for Zhuonai lake图8 MODIS与Landsat提取卓乃湖湖泊空间分布对比 |
Fig. 9 Scatterplot of water area derived from Landsat and MODIS data for Zhuonai lake图9 MODIS与Landsat提取卓乃湖湖泊面积散点图 |
Fig. 10 Spatial and temporal changes of Zhuonai lake图10 卓乃湖水域面积时空变化 |
Fig. 11 Composited map representing lakes in the summer for Qinghai-Tibet plateau in 2012图11 青藏高原地区2012年夏天水域最大合成图 |
Fig. 12 Changes of the total area of lakes in Qinghai-Tibet plateau图12 青藏高原湖泊总面积变化趋势 |
Fig. 13 Monthly changes of lake area in Qinghai-Tibet plateau from 2000 to 2013图13 2000至2013年青藏高原湖泊逐月面积变化图 |
The authors have declared that no competing interests exist.
| [1] |
|
| [2] |
|
| [3] |
|
| [4] |
|
| [5] |
|
| [6] |
|
| [7] |
|
| [8] |
|
| [9] |
|
| [10] |
|
| [11] |
|
| [12] |
|
| [13] |
|
| [14] |
|
| [15] |
|
| [16] |
|
| [17] |
|
| [18] |
|
| [19] |
|
| [20] |
|
| [21] |
|
| [22] |
|
| [23] |
|
| [24] |
|
| [25] |
|
| [26] |
|
/
| 〈 |
|
〉 |


