
Journal of Geo-information Science >
Spatio-temporal and Multi-dimensional Visualizations for the Simulation Result of CALPUFF Model
Received date: 2014-04-24
Request revised date: 2014-06-17
Online published: 2015-02-10
Copyright
The spatio-temporal and multi-dimensional visualization of atmospheric pollution dispersion simulation result can effectively demonstrate the spatial distribution of air pollution dispersion, which could provide an important reference to the quick analysis and effective emergency decision-making.The CALPUFF model can effectively simulate the diffusion process of pollution with respect to changes of time and space.The existing visual expression methods for atmospheric pollution simulations havesome common deficiencies, such as the ineffective integration of geographic information, the missing of important dimension features, etc. In this paper, the authors firstly analyzed both the CALPUFF model and its integration with component GIS, which provides a technical support for the integration of simulation results and geographical information. Secondly, with the support of GIS visualization technology, the preprocessing and vector plotting method for the simulated wind field results from CALPUFF model was given, and the preprocessing and raster rendering method for the simulated density field results from CALPUFF model was also provided. Thirdly, based on the three-dimensional terrain scene, the visualization method for atmospheric pollution dispersion was discussed. The integrated visual expression strategy of the CALPUFF model simulation results and the three-dimensional terrain scenes was then obtained. Finally, we took the Fuzhou City as a study area, and the three-dimensional terrain scenes of Fuzhou was constructed using the component GIS. According to the framework of WPF(Windows Presentation Foundation), the spatial and temporal multi-dimensional visualization simulation of wind fields and density fields was implemented. The experiment result shows that the spatial and temporal multi-dimensional visualization method given in the paper can be effectively integrated with the three-dimensional terrain scenes, and can also simultaneously achieve the processes of dynamic diffusion within the temporal dimension and multi-level distribution within the spatial dimension for the simulation results. The spatial and temporal multi-dimensional visualizations method can provide a good reference to other studies and applications.
WU Qunyong , HUANG Junyi , SHENG Ling , TANG Shuguang , WANG Qingeng , SUN Zhenhai . Spatio-temporal and Multi-dimensional Visualizations for the Simulation Result of CALPUFF Model[J]. Journal of Geo-information Science, 2015 , 17(2) : 206 -214 . DOI: 10.3724/SP.J.1047.2015.00206
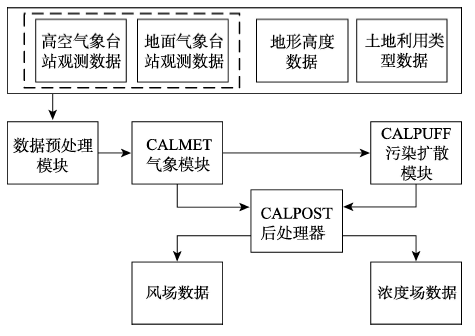
Fig. 1 The workflow of CALLPUFF model图1 CALPUFF模型工作流程图 |
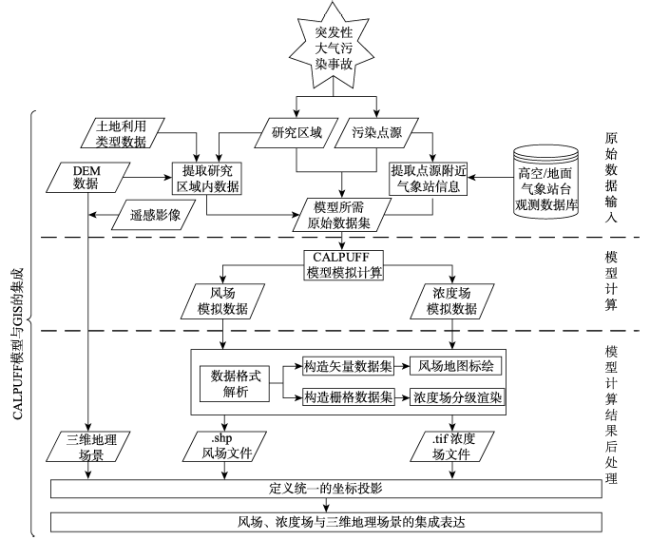
Fig. 2 The integrated framework of CALLPUFF model and GIS图2 CALPUFF模型与GIS紧密集成的流程 |
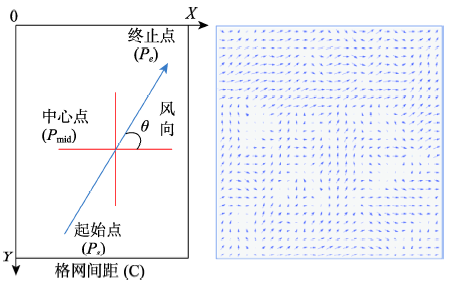
Fig. 3 The wind direction and velocity expressions and the wind field plotings in a grid unit图3 网格单元内的风向、风速表达及风场绘制 |
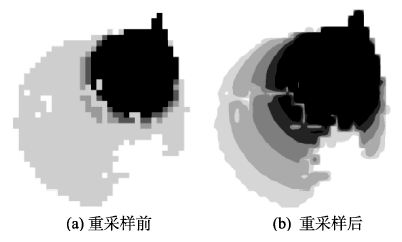
Fig. 4 Comparison of the before-and-after raster data of density field using bilinear interpolation method图4 浓度场栅格数据双线性内插法前后对比 |
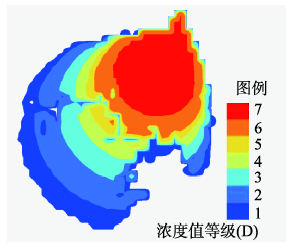
Fig. 5 The multi-level rendering according to the density of raster data图5 栅格数据浓度值分级渲染效果 |
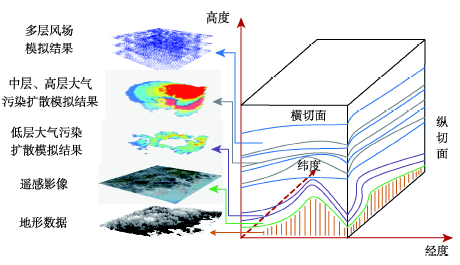
Fig. 6 The sketch map for spatial distribution of wind fields, density fields and 3D terrain图6 多层风场、浓度场与三维地形场景的空间分布集成示意图 |
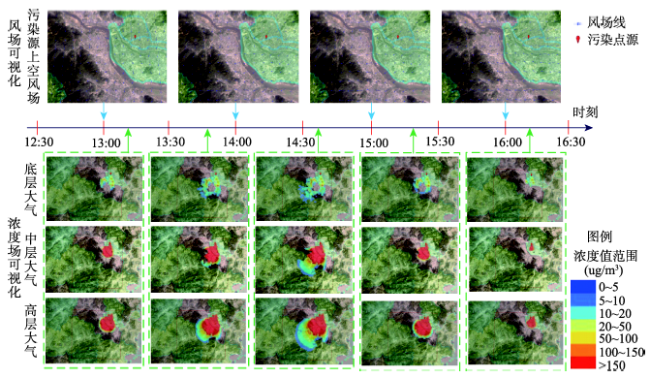
Fig. 7 The picture-based animation of wind field and density field图7 基于图片的风场与浓度场动画模拟 |
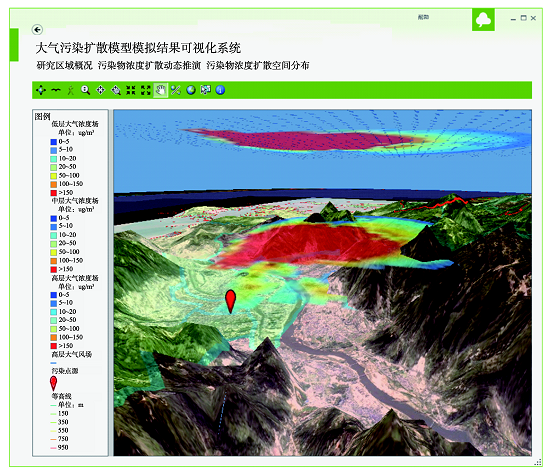
Fig. 8 Interface of the spatial multilayer distribution of wind fields and density fields图8 风场与浓度场空间层级分布的系统显示界面 |
The authors have declared that no competing interests exist.
| [1] |
|
| [2] |
|
| [3] |
|
| [4] |
|
| [5] |
|
| [6] |
|
| [7] |
|
| [8] |
|
| [9] |
|
| [10] |
|
| [11] |
|
| [12] |
|
| [13] |
|
| [14] |
|
| [15] |
|
| [16] |
|
| [17] |
|
| [18] |
|
| [19] |
|
| [20] |
|
| [21] |
|
| [22] |
|
/
| 〈 |
|
〉 |