
Journal of Geo-information Science >
Analysis on Wetland evolution and Its Driving Factors of Dunhuang Xihu Nature Protection Area
Received date: 2014-08-06
Request revised date: 2014-09-19
Online published: 2015-02-10
Copyright
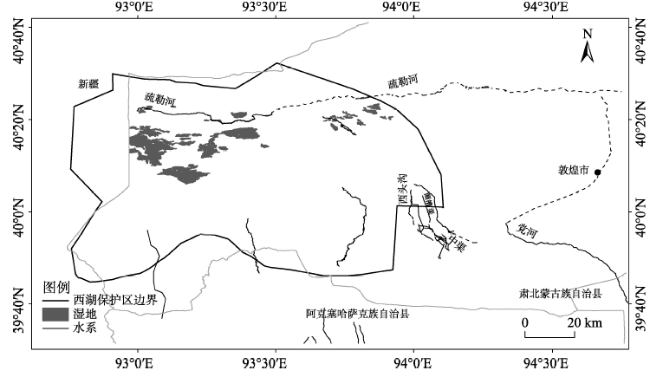
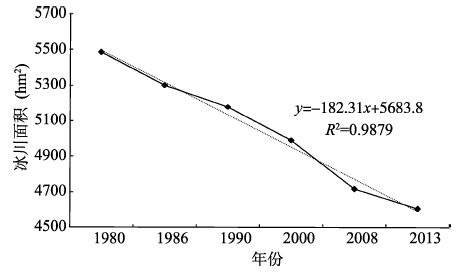
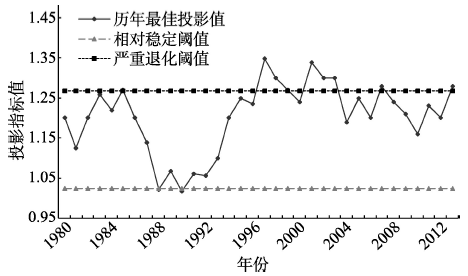
Xihu national nature protection area, the natural barrier of Dunhuang oasis, is located in the west of Hexi Corridor. Due to the climatic change and overdevelopment of land and water resources, the ecological environment problems such as wetland degradation and desertification have become more severe in the recent decades. The area of wetland, interpreted by multi-temporal remote sensing images, has decreased by 42.5%, from 17.2 thousands hm2 to 9.9 thousands hm2 from 1989 to 2013. The wetland evolution has a tendency of fragmentation, with its patch number increasing from 32 to 51 and the mean patch area declining from 537 hm2 to 213 hm2. The centroid of wetland moved southwest for about 11.59 km. It reveals that the wetland has a tendency of slowly moving to the southwest due to the development of Dunhuang city that located in the east of the wetland. The factor analysis is used to classify the driving factors related to wetland evaluation. Lastly, projection pursuit model is developed to analyze the influence of various driving factors on the wetland evaluation. The modeling result simultaneously illustrates that the wetland was in rapidly degenerated state during 23 years of the period between 1980 and 2013. The result also indicates that over-utilization of surface water and groundwater for agricultural land development is the radical reason of wetland degradation. The secondary motivation factors are glacier depletion and runoff decline caused by climatic change. In the 1990s, the wetland could keep a relatively steady state with the agricultural acreage remaining at 27 thousands hm2. Therefore, it is suggested that the scale of land use should be kept at this level, or the use of surface water and groundwater should be reduced to the level in the early 1990s through the applications of saving water, changing crop type, as well as transferring water from nearby basins. The research results could provide considerable supports to wetland protection and the integrated river-basin development planning and management.
Key words: remote sensing monitoring; wetland; factor analysis; projection pursuit
DUAN Hao , PAN Shibing , LI Lin , YUAN Haifeng . Analysis on Wetland evolution and Its Driving Factors of Dunhuang Xihu Nature Protection Area[J]. Journal of Geo-information Science, 2015 , 17(2) : 222 -228 . DOI: 10.3724/SP.J.1047.2015.00222
Fig. 1 The geographic location of Xihu national nature protection area in Dunhuang图1 敦煌西湖国家级自然保护区地理位置图 |
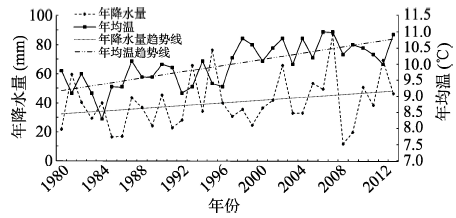
Fig. 2 The precipitation and mean temperature variation of Dunhuang city图2 敦煌市降水及年平均气温变化 |
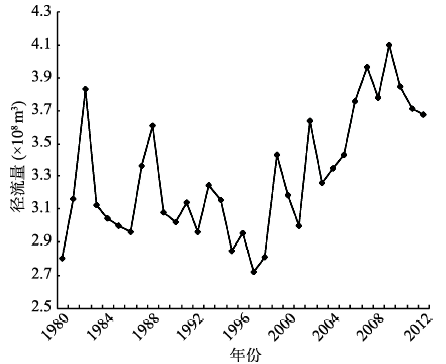
Fig. 3 The variation of Dang river runoff at Shazaoyuan hydrologic station图3 党河沙枣园水文站来水变化 |
Fig. 4 The variation of glacier area in east Altun Mountains图4 阿尔金山东段冰川面积变化 |
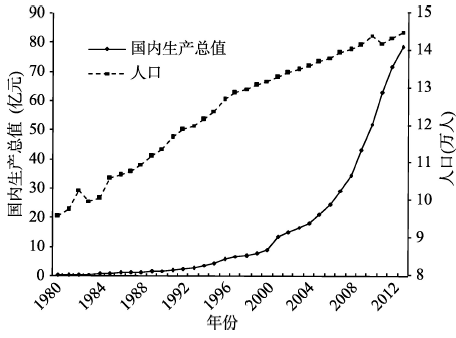
Fig. 5 Population and GDP change of Dunhuang city图5 敦煌市人口和国内生产总值变化 |
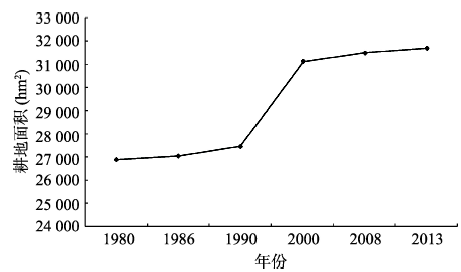
Fig. 6 Cultivated area change of Dunhuang city from 1980 to 2013图6 1980-2013年间敦煌市耕地面积变化 |
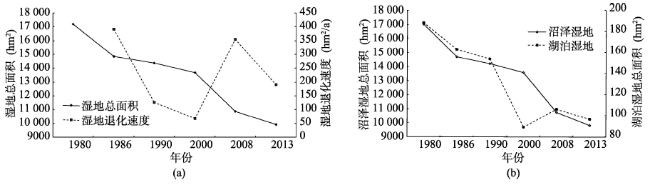
Fig. 7 Area change of wetland in Xihu nature protection area from 1980 to 2013图7 1980-2013年间西湖自然保护区湿地面积变化 |
Tab. 1 Land use transfer matrix of Xihu protection area from 1980 to 2013 (hm2)表1 1980-2013年间西湖保护区的土地利用转移矩阵(hm2) |
| 1980年 | 2013年 | ||||||||||||
|---|---|---|---|---|---|---|---|---|---|---|---|---|---|
| 有林地 | 灌木林地 | 高覆盖度草地 | 中覆盖度草地 | 低覆盖度草地 | 沙地 | 戈壁 | 盐碱地 | 湿地 | 裸土地 | 裸岩石砾地 | 平原区旱地 | 总计 | |
| 有林地 | 30 | 30 | |||||||||||
| 灌木林地 | 1210 | 250 | 6 | 105 | 449 | 2020 | |||||||
| 高覆盖度草地 | 6502 | 502 | 134 | 438 | 7576 | ||||||||
| 中覆盖度草地 | 11 512 | 1536 | 29 | 13 077 | |||||||||
| 低覆盖度草地 | 39 012 | 2036 | 317 | 41 365 | |||||||||
| 沙地 | 2 | 278 610 | 325 | 278 937 | |||||||||
| 戈壁 | 196 600 | 196 600 | |||||||||||
| 盐碱地 | 65 | 9 | 94 050 | 94 124 | |||||||||
| 湿地 | 4791 | 1734 | 486 | 314 | 9901 | 17 226 | |||||||
| 裸土地 | 67 | 17 | 84 | ||||||||||
| 裸岩石砾地 | 20 314 | 20 314 | |||||||||||
| 平原区旱地 | 187 | 187 | |||||||||||
| 总计 | 30 | 1210 | 11 543 | 13 754 | 41 235 | 280 900 | 197 200 | 94 079 | 9901 | 172 | 20 331 | 1074 | 671 540 |
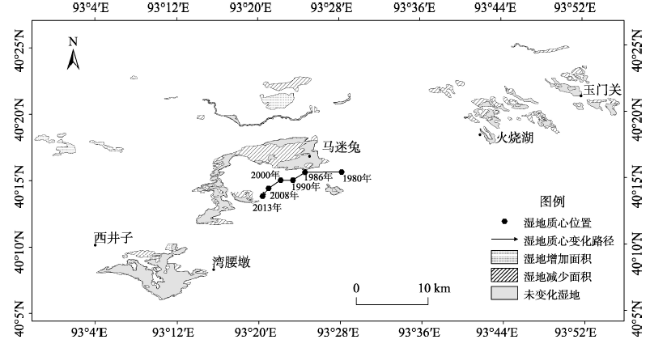
Fig. 8 The wetland evolution process in Xihu protection area from 1980 to 2013图8 1980-2013年间西湖保护区湿地演化过程 |
Tab. 2 Eigen value, explained variance and accumulated variance of the principal components表2 主成分的特征值、解释方差和累计方差表 |
| 成分 | 命名 | 特征值 | 方差百分比(%) | 累计百分率(%) |
|---|---|---|---|---|
| 成分1 | 生产力因子 | 3.731 | 52.384 | 52.384 |
| 成分2 | 水文因子 | 1.148 | 17.764 | 70.148 |
| 成分3 | 气候变化因子 | 0.894 | 12.523 | 82.671 |
Fig. 9 Projection pursuit index of wetland degeneration in Xihu protection area in Dunhuang图9 敦煌西湖保护区湿地退化投影寻踪指标 |
The authors have declared that no competing interests exist.
| [1] |
|
| [2] |
|
| [3] |
|
| [4] |
|
| [5] |
|
| [6] |
|
| [7] |
|
| [8] |
|
| [9] |
|
| [10] |
|
| [11] |
|
| [12] |
|
| [13] |
|
| [14] |
|
| [15] |
|
| [16] |
|
| [17] |
|
| [18] |
|
| [19] |
|
| [20] |
|
| [21] |
|
| [22] |
|
| [23] |
|
| [24] |
|
| [25] |
|
/
| 〈 |
|
〉 |