Orginal Article

Study on Calculating Cloud-Top Height from ASTER Images Using Photogrammetry

  • HE Yongjian , 1 ,
  • ZHANG Yalin 2 ,
  • QIU Xinfa , 1, * ,
  • CAO Yun 1
Expand
  • 1. School of geography and Remote sensing, Nanjing University of Information Science and Technology, Nanjing 210044, China
  • 2. Centre for Climate of ShanXi Province, Taiyuan 030006, China
*Corresponding author: QIU Xinfa, E-mail:

Received date: 2014-06-03

  Request revised date: 2014-08-14

  Online published: 2015-02-10

Copyright

《地球信息科学学报》编辑部 所有

Abstract

Cloud-top height is an important factor in weather forecasting and monitoring. Accurate cloud-top height has important scientific significance for improving the quality of both weather analyses and numerical weather prediction. The geometric method to calculate cloud-top height using stereo image pair obtained from meteorological satellites has been recognized as providing relatively high precision, and has practical importance. However, this method does not fully consider cloud movement and typically assumes ideal ellipsoids in theory. Thus, the calculated cloud-top height still has a relatively large error in practice. In this study, cloud-movement speed was introduced into the collinearity equation of photogrammetry. We established a model to calculate the cloud-top height from the ASTER images (3B and 3N) with digital photogrammetry and remote sensing technology. Firstly, we created a stereo pair from ASTER images obtained on 25th September 2012. Then, the cloud-movement speed was calculated through matching cloud points. Finally, the cloud-top heights with and without consideration of wind speed were both calculated. Compared with ground control points, the model error is determined to be within two pixels (about 30 meter). We further compared our results with MISR products, and found that the cloud-top height determined without using wind speed is consistent with the height obtained from MISR, the difference between them is about 300 meters. Our cloud-top height determined with wind speed considered, however is about 1400 meters higher than that of MISR without wind considered. Marchand and Naud had identified in their research that the cloud-top height obtained from MISR is about 1000 meters lower than Lidar observation. This implies that our results with consideration of wind speed are closer to the Lidar observations. Due to the fact that our method for determining cloud-top height is dependent on the cloud moving speed, and the results with wind speed included have led to a good estimation of cloud-top height, we conclude that the wind speed should be included in algorithms for cloud-top height determination.

Cite this article

HE Yongjian , ZHANG Yalin , QIU Xinfa , CAO Yun . Study on Calculating Cloud-Top Height from ASTER Images Using Photogrammetry[J]. Journal of Geo-information Science, 2015 , 17(2) : 229 -235 . DOI: 10.3724/SP.J.1047.2015.00229

1 引言

卫星资料反演的云顶高度是天气学、气候学的重要科学资料,是影响天气预报、天气监测及航空安全保障等实际应用的重要因子[1]。准确的云顶高度将会大大提高天气分析和数值预报的质量,具有重要的科学意义[2]。目前,云顶高度解算的精度尚存在较多问题,限制了云顶高度的实际应用,如何提高云顶高度已成为卫星气象学的一项待解难题。
目前,亮温法是反演云顶高度主要方法之一,该方法依赖于云的发射率、周围温度及递减率等云物理参数,还需假定云满足局部热力学平衡条件,计算的云顶高度会有1~2 km误差甚至更大。因此,Hasler提出了采用立体像对几何方法解算云顶高度,该方法被公认为目前精度较高的方法,具有重要实用价值[3]
立体像对几何方法解算云顶高度主要有双星立体观测法和单星多角度观测法。双星立体观测法通常采用2张静止卫星拍摄的影像组成立体像对,利用卫星-球心-投影云-真云的平面和球面三角几何关系,以及影像匹配技术解算云顶高度。Minzner等[4-5]采用SMS/GOES影像建立立体像对,解算云顶高度的误差为0.2~0.5 km。Bryson[6]利用SMS影像实现了云顶高度解算。Hasler等[7]实现了计算机云顶高度自动解算。Wylie等[8]、Takashima等[9]、Campbell等[10]、Fujita[11]、王洪庆、黄磊、吕胜辉等[12-14]也先后采用不同静止卫星影像实现了云顶高度解算。由于2张影像是非同时拍摄,解算模型没有顾及云的移动,再加上采用了假设的理想椭球体,导致解算的云顶高度误差较大,静止卫星影像较低分辨率也为云顶高度批量解算带来了困难。
单星多角度观测是指利用极轨卫星搭载多个观测仪器,从多个角度对目标进行观测,并成为遥感研究的一个新趋势[15],也为云顶高度观测提供了新的途径。欧盟1997年实施了CLOUDMAP计划,采用了多种多角度观测平台获取云的信息,包括ERS-2上的ATSR、机载的AirMISR、TERRA上的MISR、MIR上的MOMS,证明了它们的立体观测能力,也首次表明立体观测技术步入业务化的潜力[16]。在CLOUDMAP2计划中,EUMETSAT开展了多种计算云顶高度方法的比较研究,得到AATSR云顶高度测定精度为±700 m[17]。NASA利用搭载在TERRA上的MISR影像解算云顶高度,提供了考虑风速和未考虑风速的两种云顶高度产品,Moroney认为MISR云顶高度误差在560 m左右[18]。单星多角度观测解算方法是在卫星-球心-投影云-真云的平面和球面三角几何关系基础上,引入云迹风,即采用重投影技术和模糊识别法先解算风速,然后在较大区域内采用了同一风速(最大或平均风速)修正解算的云顶高度[19],由于在较大区域内采用了同一风速,从而对云顶高度解算引入新的误差并影响算法的稳定性。
卫星遥感影像的数字摄影测量技术是遥感技术和摄影测量学理论的有效结合,通常用于解算地面静态目标。由于云为动态目标,国内外尚无利用摄影测量共线方程解算云顶高度。因此,本文选用极轨卫星Terra分辨率高达15 m的ASTER传感器影像建立立体像对,通过数字摄影测量理论和云迹风解算方法,综合考虑云移动对云顶高度解算的影响,建立了针对ASTER线阵影像的云顶高度解算模型,并进行了ASTER影像云顶高度的几何反演。

2 模型实验数据及研究区背景

高级星载热发射反射辐射计(Advanced Spaceborne Thermal Emission and Reflection Radiometer, ASTER)是Terra卫星上载有的5种对地观测仪器之一,由美国NASA与日本通产省METI(经贸及工业部)合作研制,并提供数据平台服务等。ASTER包括了从可见光到热红外共14个光谱通道。可见光波段共有2个角度3N、3B,以同步同轨(simultaneous along-track)方式成像,2个线性阵列相机分别于2个角度记录相同波段范围的立体影像资料,其中,3N为星下点垂直成像波段(nadir),3B为后视成像波段(backward),观测天顶角为27.6[20]。本文采用其L1B级数据,该数据经过辐射校正,分辨率为15 m。
为利于确定地面控制点和检查点,并能有效验证模型的精度,本文研究区选取位于西藏阿里地区普兰县附近的拉昂错湖和玛旁雍错湖以北,接近于中国、印度及尼泊尔三国交界处。该研究区平均海拔4000~5000 m,多分布小型湖泊水体,并穿插有数条小山脉,易选取地面控制点。由于其高海拔,该地区空气干燥、稀薄,太阳辐射较强,气温偏低,少降水。影像所在地面之上,有成片云团及少量雪覆盖。图1为2012年9月25日ASTER影像研究区概况,其中蓝色区域为本文的实验云区,其面积约4×10⁴ m2。本文共选取36控制点用于模型参数,16对检查点用于模型误差检验(图1)。
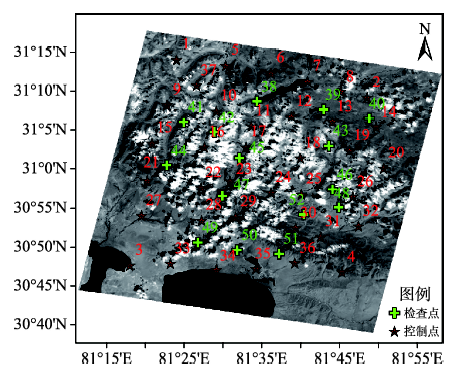
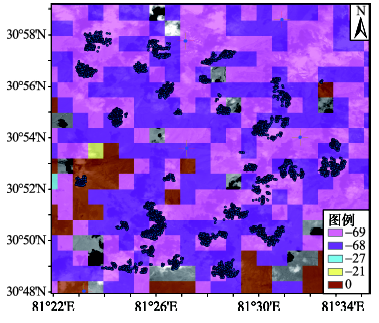
Fig. 1 Map of control-points and ASTER image

图1 ASTER影像及控制点分布图

3 云顶高度解算模型

ASTER为线阵扫描方式,由摄影测量理论可知其3N影像的一条扫描线的共线方程为:
x = - f a 1 ( X A - X Si ) + b 1 ( Y A - Y Si ) + c 1 ( Z A - Z Si ) a 3 ( X A - X Si ) + b 3 ( Y A - Y Si ) + c 3 ( Z A - Z Si ) 0 = - f a 2 ( X A - X Si ) + b 2 ( Y A - Y Si ) + c 2 ( Z A - Z Si ) a 3 ( X A - X Si ) + b 3 ( Y A - Y Si ) + c 3 ( Z A - Z Si ) (1)
式(1)中,(x,0)为像片坐标系中像点;XA,YAZA为对应的地面点坐标;XSi,YSiZSi为对应行的外方位元素的线元素,a1,a2,a3,b1,b2,b3,c1,c2,c3为有个角元素的旋转矩阵;-f为相机主距。
倾斜角度3B(倾角为 θ )的共线方程为:
x cosθ = - f a 1 ( X A - X Si ) + b 1 ( Y A - Y Si ) + c 1 ( Z A - Z Si ) a 3 ( X A - X Si ) + b 3 ( Y A - Y Si ) + c 3 ( Z A - Z Si ) ftanθ = - f a 2 ( X A - X Si ) + b 2 ( Y A - Y Si ) + c 2 ( Z A - Z Si ) a 3 ( X A - X Si ) + b 3 ( Y A - Y Si ) + c 3 ( Z A - Z Si ) (2)
卫星在成像过程中,因其位置不断发生变化,每个扫描线的外方位元素也不相同,因此,该方程不能适合整幅影像。根据线阵影像解算相关文献[21]-[23],可认为行与行之间的定向元素为线性关系,因此,本文采用一次线性关系构建符合整幅影像的共线方程,公式为:
X si = X s 0 + i × Δ X s 1 Y si = Y s 0 + i × Δ Y s 1 Z si = Z s 0 + i × Δ Z s 1 φ i = φ 0 + i × Δ φ 1 ω i = ω 0 + i × Δ ω 1 κ i = κ 0 + i × Δ κ 1 (3)
式(3)中, X s 0 Y s 0 k 0 为中心行的外方位元素; Δ X s 1 Δ Y s 1 Δ k 1 为外方位元素变化率;Xsi,Ysi…,ki为第i行的外方位元素,i为行号。
图2可知,当3N传感器成像时,云处于“位置1”,在3B传感器成像时,由于云发生了移动,其位于“位置2”,若不考虑云的移动,则解算的云顶高度为 Z ,若考虑云的移动,则解算的云顶高度为 Z ,由于卫星位置较高,因此,云的微小移动,导致解算误差较大。
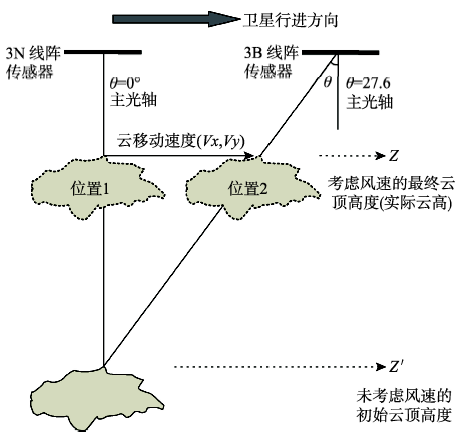
Fig. 2 Framework of calculating cloud-top height using stereo image pair with and without the consideration of wind speed

图2 考虑和不考虑风速条件下的双像立体云顶高度示意图

设云在 XY 方向的移动速度分别为 V x , V y ,则:
整理后得:
F 1 = f [ a 1 ( X A - X Si ) + b 1 ( Y A - Y Si ) + c 1 ( Z A - Z Si ) ] + x 1 [ a 3 ( X A - X Si ) + b 3 ( Y A - Y Si ) + c 3 ( Z A - Z Si ) ] F 2 = f [ a 2 ( X A - X Si ) + b 2 ( Y A - Y Si ) + c 2 ( Z A - Z Si ) ] + y 1 [ a 3 ( X A - X Si ) + b 3 ( Y A - Y Si ) + c 3 ( Z A - Z Si ) ] F 3 = f 2 [ a 1 ' ( X A + t × V X - X Si ' ) + b 1 ' ( Y A + t × V Y - Y Si ' ) + c 1 ' ( Z A - Z si ' ) ] + x 2 [ a 3 ' ( X A + t × V X - X Si ' ) + b 3 ' ( Y A + t × V Y - Y Si ' ) + c 3 ' ( Z A - Z si ' ) ] F 4 = f 2 [ a 2 ' ( X A + t × V X - X Si ' ) + b 2 ' ( Y A + t × V Y - Y Si ' ) + c 2 ' ( Z A - Z si ' ) ] + y 2 [ a 3 ( X A + t × V X - X Si ' ) + b 3 ' ( Y A + t × V Y - Y Si ' ) + c 3 ' ( Z A - Z si ' ) ] (5)
式(4)和(5)中, t 为3N、3B传感器扫描同一点的时间间隔。解算时,首先利用相关系数法对3N和3B影像逐像元解算同名云点的云迹风[24-25],从而获得云移动速度,并将云移动速度代入式(4)中,利用最小二乘法解求云顶高度。

4 云顶高度解算模型实验与结果分析

4.1 模型实验

本文利用相关系数法进行了同名云点匹配,共获得同名云点3080对,并利用逆向匹配进行误差检验,两者偏差超过2个像元即为错误点数,因此,确定错误点195对,匹配成功率93.67%。其分布如图3所示,其影像图为重采样图,依据DEM,利用摄影测量影像纠正反解法和双线性内插方法获得。
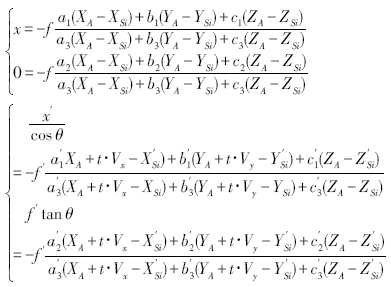
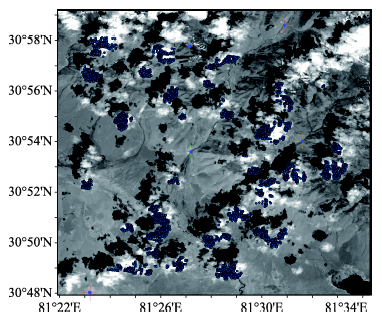
Fig. 3 Distribution of matched cloud points

图3 云匹配分布图

本文分别利用式(1)、(2)、(4),依据地面控制点,进行了定向元素的解算,再利用匹配的同名云点进行了不考虑风速的云顶高度(简称无风云高)和考虑风速云顶高度(简称有风云高)解算,并将解算的云顶高度减去该点的实际海拔,得到相对云顶高度,如表1所示,计算的无风云高有97.68%分布在1100~2100 m之间,而有风云高97.57%分布在2400~3900 m之间,后者平均高出前者1400 m左右。
Tab. 1 Statistical results of calculated cloud-top heights with and without the consideration of wind speed

表1 计算的无风云高和有风云高概况统计

最大值(m) 最小值(m) 平均值(m) 云高范围(m) 对应云点个数(个)
无风云高 2490.32 531.81 1715.53 500~1100 13
1100~1600 778
1600~2100 2040
2100~2500 54
有风云高 4191.69 1936.0 3087.10 1900~2400 39
2400~2900 725
2900~3400 1671
3400~3900 419
3900~4200 31

4.2 云顶高度解算误差分析

为了有效检验模型的稳定性和云顶高度的误差,本文进行了2级验证:(1)利用地面控制点对模型误差进行检验;(2)利用MISR云高产品对本文解算云顶高度检验。
(1)控制点对模型误差的检验
为了验证模型的误差,本文利用52对地面控制点(其中,36对控制点参与了模型外方位元素解算,16对控制点作为检查点)进行模型误差验证,并将其误差分为X,Y,Z 3个方向进行分析,其误差分布如图4所示。
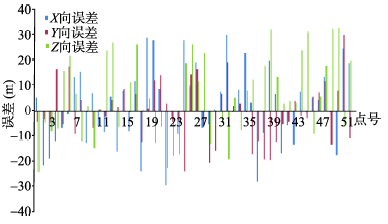
Fig. 4 Error distribution of the simulated control-points in X, Y, Z directions

图4 模型解算的控制点X,Y,Z 3个方向绝对误差分布

图4看出,3个方向误差分布没有明显的规律及相关性,但全都控制在-30~35 m之间,即2个像元之内,因此,认为模型稳定性较好,误差小于2个像元。
(2)MISR云高产品对模型解算云高的检验
本文利用MISR多角度云顶高度产品进行了云顶高度对比分析。MISR传感器与ASTER传感器一同搭载在Terra卫星上,二者同时经过同一地区,故可获得与ASTER影像同时相、同地区的MISR云高产品,这使得二者在观测时间上、空间上有较高的可比性。MISR云高产品包括不考虑风速(简称MISR无风云高)和考虑风速云顶高度(简称MISR有风云高)产品(以下所有云顶高度均为减去地形高度的相对云高),空间分辨率为1.1 km[19,26-27]
图5、6可知,本文解算无风云顶高度与MISR的不考虑风速的云顶高度基本一致,二者的差值主要集中在-300~300 m的差值区,其平均差值为27.66 m。其中部分解算结果与MISR无风云高有一个像元的偏差,主要因为本文云顶高度解算结果是在15 m空间分辨率的影像下,解算结果更加精细,而MISR云高产品为1.1 km分辨率,云团范围估计粗略,难以覆盖不规则范围的云团位置,造成较大偏差,甚至在某些有云区域MISR无法给出云顶高度;由图7表2可知,解算有风云顶高度明显高于MISR解算的云顶高度,最大差值为2002.47 m,平均差值为1431.41 m,这主要在解算过程中引入风速,使得解算的云顶高度增大。
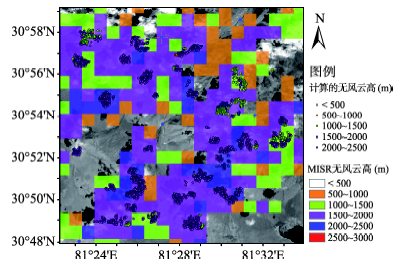
Fig.5 Comparison of the calculated and MISR produced cloud-top heights without consideration of wind speed

图5 计算的无风云高与MISR无风云高产品对比图

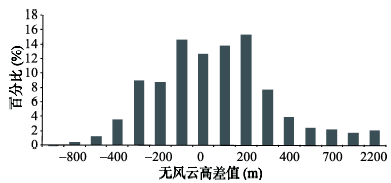
Fig. 6 Statistical distribution of the difference between the calculated and MISR produced cloud-top heights without consideration of wind speed

图6 无风云高与MISR无风云高差值分布统计图

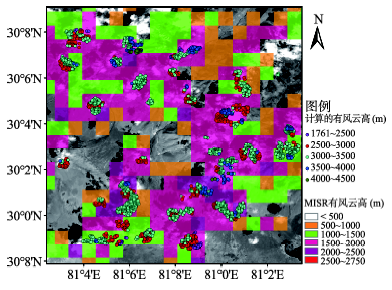
Fig. 7 Comparison of calculated and MISR produced cloud-top heights without consideration of wind speed

图7 计算的有风云高与MISR有风云高产品对比图

Tab. 2 Statistics of the difference between calculated and MISR produced cloud-top heights without consideration of wind speed

表2 计算的有风云高与MISR有风计算云高及二者差值统计

云高差值 (m) 云高差值范围 (m) 对应云点比例(%)
最大值 2002.47 700~1000 2.98
1000~1200 15.25
最小值 796.37 1200~1400 40.10
1400~1600 26.38
平均值 1431.41 1600~1800 12.65
1800~2000 2.63
图8可知,MISR考虑风速结果与未考虑风速结果相近,且比无风云高低。Marchand[28]将MISR的云顶高度产品,包括无风、有风云高分为低云、中云和高云,与美国三部地基雷达产品作了对比分析,认为MISR反演的云顶高度普遍偏低,其中未考虑风速的云顶高度的标准偏差为1000~1300 m,而考虑风速的云顶高度的标准偏差多小于1000 m。Naud[29]利用SIRTA激光雷达云高数据与MISR云高数据对比认为,MISR云高数据普遍偏低,中高云尤为明显,其高差也在1000 m左右,因此,可证明本文解算的结果接近地基雷达产品。
Fig. 8 Distribution map of the difference between MISR cloud-top heights with wind speed considered and without wind speed considered

图8 MISR有风和无风云高产品云高差值分布图

5 结论

本文详细分析了云顶高度和云移动速度之间的关系,依据摄影测量理论共线方程,将风速在X,Y,Z 3个方向的分量(VX,VY,VZ)引入到线阵共线方程,建立了云顶高度解算模型,并利用ASTER影像进行了解算实验。得出如下结论:
(1)通过地面控制点解算,模型的误差在2个像元(30 m)内;
(2)不考虑风速的解算结果与MISR的云高产品基本一致,其误差大多控制在300 m内;
(3)本文解算考虑风速的云高比MISR的云高高出1400 m左右,根据Marchand和Naud的结论,本文解算的考虑风速云顶高度结果更接近实际值。
本文不足之处:由于风速和云顶高度为独立解算,因此,风速解算的误差为云顶高度带来新的不确定性误差,如何建立云顶高度和云移动速度联立解算模型有待于进一步研究;模型参数的解算依赖于地面控制点,不利于大面积云的解算,无控制点解算方案有待于进一步改进。

The authors have declared that no competing interests exist.

[1]
林琳,黄思训,杜华栋.MODIS数据的云顶高度反演[J].地球信息科学,2006,8(2):106-109.

[2]
黄磊. 基于图像匹配和模式识别技术的卫星资料应用[D].北京:北京大学,2007:1-36.

[3]
Hasler A F.Stereographic observations from satellites: An important new tool for the atmospheric science[J]. Bulletin American Meteorological Society, 1981,62(2):194-212.

[4]
Minzner R A, Shenk W E, Steranka J, et al.Cloud heights determined stereographically from imagery recorded simultaneously by two synchronous meteorological satellites, SMS-1 and SMS-2[J]. EOS, 1976, 57(8): 593-593.

[5]
Minzner R A, Shenk W E, Steranka J, et al.Stereographic cloud heights from imagery of SMS/GOES satellites[J]. Geophisical Research letter, 1978,5(1):21-24.

[6]
Bryson W.Cloud height determination from geosynchronous satellite images[D]. Wisconsin: University of Wisconsin, 1978:1-32.

[7]
Hasler A F, Strong J, Woodward R H, et al.Automatic analysis of stereoscopic satellite image pairs for determination of cloud-top height and structure[J]. Journal of Applied Meteorology, 1991,30(3):257-281.

[8]
Wylie D P, Santek D, Starr D O.Cloud-Top heights from GOES-8 and GOES-9 stereoscopic imagery[J]. Journal of Applied Meteorology, 1998,37(4):405-413.

[9]
Takashima T, Takayama Y, Matsuura K, et al.Cloud height determination by satellite stereography[J]. Papers in Meteorology and Geophysics, 1982,33(2):65-78.

[10]
Campbell G G, Holmlund K.Geometric cloud heights from Meteosat and AVHRR[C]. Fifth International Winds Workshop,EUM, 2000:109-115.

[11]
Fujita T T.Principle of stereoscopic height computations and their applications to stratospheric cirrus over sever thunderstorms[J]. Journal of the Meteorological Society of Japan, 1982,60:355-368.

[12]
Wang H q, Lv S H, Zhang Y, et al. Determination of cloud-top height from stereoscopic observation[J]. Progress in Natural Science, 2002,12(9):689-694.

[13]
王洪庆,吕胜辉,张焱,等.双星立体观测的云顶高度反演//. 中国气象学会2003 年年会“地球气候和环境系统的探测与研究”分会论文集[M].北京:气象出版社,2003:107-110.

[14]
黄磊,吕胜辉,张焱,等.双星立体观测云顶高度几何反演方法[J].北京大学学报(自然科学版),2008,44(1):129-134.

[15]
Seiz G, Poli D, Gruen A.Stereo cloud-top heights from MISR and AATSR for validation of Eumetsat cloud-top height products[C]. Prague: Eumetsat Users, Conference, 2004:1-6.

[16]
Diner D J, Asner G P, Davies R, et al.New directions in Earth observing: Scientific applications of multiangle remote sensing[J]. Bulletin American Meteorological Society, 1999,80(11):2209-2228.

[17]
EU. CLOUDMAP-Cirrus and Contrail cloud-top maps from satellites for Weather Forecasting and Climate Change Analysis: Final Report[R].EU Contract no ENV4 CT97-0399, 2001.

[18]
Moroney C, Davies R, Muller J P.Operational retrieval of cloud-top heights using MISR data[J]. IEEE Transactions on Geoscience and Remote Sensing, 2002,40(7):1532-1540.

[19]
Mueller K, Garay M J, Girolamo L D, et al. MISR Cloud Motion Vector Product Algorithm Theoretical Basis[DB/OL]. 2010-7-10.

[20]
Fujisada H, Sakuma H, Oilo A, et al.Design and preflight performance of ASTER instrument protoflight model[J]. IEEE Transactions on Geoscience and Remote Sensing, 1998,36(4):1152-1160.

[21]
Krupnik A.Accuracy assessment of automatically derived digital elevation models from spot images[J]. Photogrammetric Engineering and Remote Sensing, 2000,8:1017-1023.

[22]
张祖勋,张剑清.数字摄影测量学[M].武汉:武汉大学出版社,1997:1-141.

[23]
李德仁,周月琴,金为铣.摄影测量与遥感概论[M].北京:测绘科学出版社,2004:1-120.

[24]
陈华,许健民,张其松,等.用高度调整法进行云迹风高度的质量控制[J].气象科学,1999,19(l):20-25.

[25]
王振会,汤达章,傅德胜.图像相关分析法判别因子的比较与实验[J].气象科学,1992,l2(l):72-79.

[26]
Diner D J. MISR Experiment Overview[DB/OL]. 2010-11-25

[27]
Moroney C, Mueller K. MISR Data Product Specification for the MISR Level 2 Cloud Product[DB/OL]. 2012-4-5.

[28]
Marchand R T, Ackerman T P, Moroney C. An assessment of Multiangle Imaging Spectroradiometer (MISR) stereo-derived cloud top heights and cloud top winds using ground-based radar, lidar, microwave radiometers[J]. Journal of Geophysical Research, 2007 112:D06204(1-20).

[29]
Naud C, Muller J P,Haeffelin M, et al.Assessment of MISR and MODIS cloud top heights through intercomparison with a back-scattering lidar at SIRTA[J]. Geophysical Research Letters, 2004,31(L04114).

Outlines

/