
Journal of Geo-information Science >
Study on the Change of Ecosystem in Xinjiang from 2000 to 2010
Received date: 2014-04-22
Request revised date: 2014-06-10
Online published: 2015-03-10
Copyright
In this paper, the spatial pattern, trend and driving forces of ecosystem change of Xinjiang from 2000 to 2010 are derived based on the remote sense data (Landsat TM/ETM+ and HJ-1 CCD). During this period, urban construction area, cropland and wetland had expanded rapidly, that increased by 30.5%、26.7% and 10.2% respectively. Meanwhile, grassland, shrub had massively decreased by 2.4% and 5.1%. Glacier area had also significantly retreated by about 1.6%. Woodland and desert were almost unchanged. Traditional oasis was the majority area of change, especially in the south and north foot of Tianshan mountains. Technical improvement of water conservancy facilities and national west part development strategy are the primary causes of transformations of grassland and shrub into cropland. Population growth is the driving force of urban construction area increase. Due to global warming, a great amount of glacier area of the percentage between 16.7% and 32.5% had disappeared since 1960s, which resulted in the increase of wetland. National eco-environment projects, e.g. Three North Shelterbelt, was established to protect woodland and desert from further deterioration. This paper presented some suggestions to keep the ecological security of Xinjiang: (1) forbidding deforestation and developing cropland in mountain area to recover its water conservation function; (2) restricting the increase of cropland in oasis because it has already exceeded the theoretical water resources carrying capacity of Xinjiang; (3) protecting the transition zone to ensure the ecological security of oasis in the piedmont plain; (4) constructing artificial grassland and utilizing the crop straw to develop animal husbandry; (5) strengthening the research under the impact of global climate change on water resources to assist future policy making.
Key words: terrestrial ecosystems; Xinjiang; drive forces; eco-geographical zones
YUAN Yuecheng , LIU Haijiang , LI Baolin , GAO Xizhang , XU Lili , DONG Guihua . Study on the Change of Ecosystem in Xinjiang from 2000 to 2010[J]. Journal of Geo-information Science, 2015 , 17(3) : 300 -308 . DOI: 10.3724/SP.J.1047.2015.00300
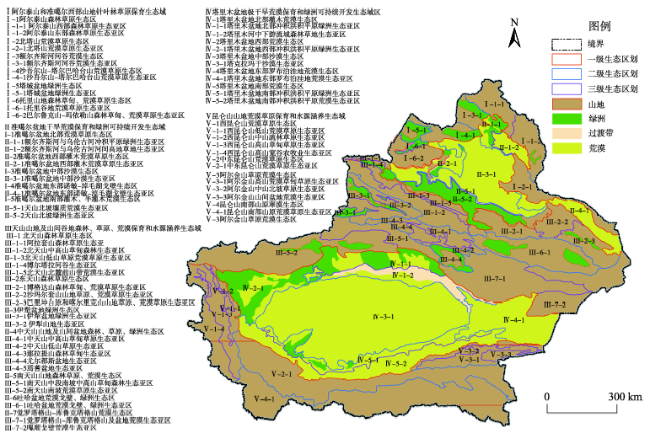
Fig. 1 The distribution of mountain-oasis-transition zone-desert ecological regions in Xinjiang图1 新疆山地-绿洲-过渡带-荒漠生态地理区分布范围 |
Tab. 1 The changes in area of ecosystems in Xinjiang from 2000 to 2010表1 新疆2000-2010年生态系统类型面积变化 |
| 生态系统类型 | 面积(×104 hm2) | 变化强度(%) | 变化率(%) | |
|---|---|---|---|---|
| 2000年 | 2010年 | |||
| 森林 | 266.3 | 264.9 | 4.0 | -0.5 |
| 灌丛 | 1206.0 | 1143.9 | 8.5 | -5.1 |
| 草地 | 5617.7 | 5485.5 | 3.8 | -2.4 |
| 湿地 | 203.7 | 224.6 | 31.5 | 10.2 |
| 农田 | 667.6 | 845.8 | 33.1 | 26.7 |
| 建设用地 | 74.8 | 97.6 | 38.3 | 30.5 |
| 荒漠 | 7833.6 | 7814.4 | 1.4 | -0.2 |
| 冰川积雪 | 446.7 | 439.7 | 5.6 | -1.6 |
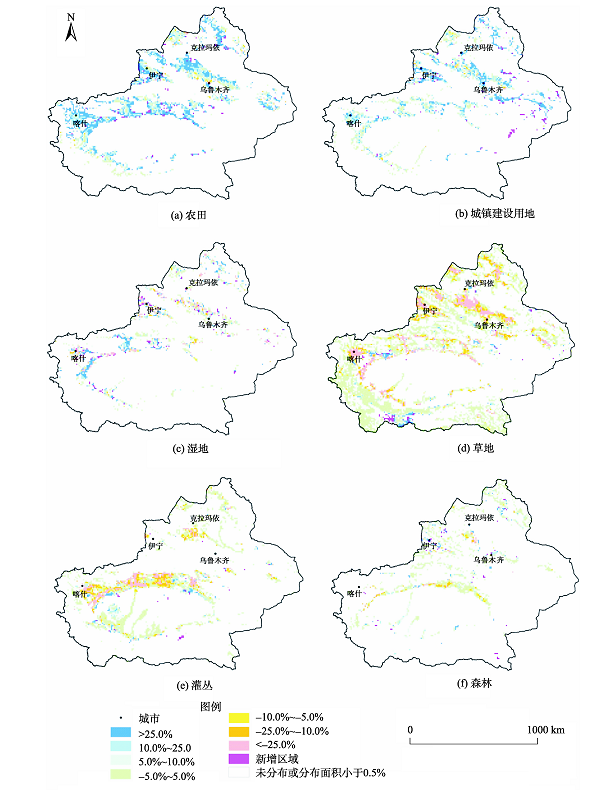
Fig. 2 The distribution of change rate of cropland, urban construction area, wetland, grassland, shrub and woodland in Xinjiang图2 新疆农田、城镇建设用地、湿地、草地、灌丛、森林变化率分布图 |
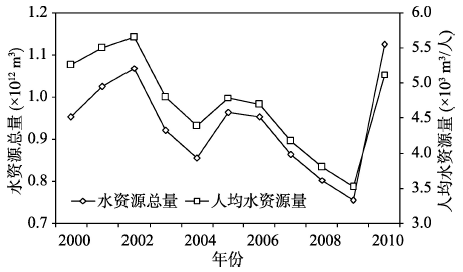
Fig. 3 The total and per capita water resources in Xinjiang图3 新疆水资源总量与人均水资源量 |
Tab. 2 The population and permanent assets of Xinjiang from 2000 to 2010表2 2000-2010年间新疆人口和固定资产 |
| 年份 | 总人口数(万人) | 城镇总人口数(万人) | 城镇人口比重(%) | 乡村总人口数(万人) | 乡村人口所占比重(%) | 固定资产投资额(万元) | 城镇面积(km2) |
|---|---|---|---|---|---|---|---|
| 2000 | 1849 | 624.0 | 33.8 | 1225.0 | 66.2 | 6 103 843 | 7479.4 |
| 2005 | 2010 | 746.7 | 37.2 | 1263.3 | 62.8 | 13 523 200 | 8542.4 |
| 2010 | 2185 | 935.0 | 42.8 | 1250.0 | 57.2 | 35 396 941 | 9761.4 |
注:“城镇面积(km2)”数值统计自本文的生态系统类型数据,其余列数据均来自各年的新疆统计年鉴 |
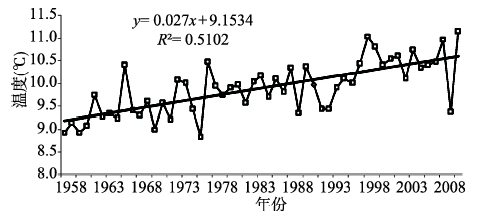
Fig. 4 The change of average temperature between June and August in Bayanbulak in recent 50 years图 4 近50a来新疆天山巴音布鲁克6-8月气温变化 |
Tab. 3 Change of the ecosystem in each ecological region表3 不同生态地理区生态系统类型变化 |
| 生态地理区 | 变化面积(hm2) | RCI(%) | 占研究区变化总面积百分比(%) | 主要变化类型 | |
|---|---|---|---|---|---|
| 山地森林、草原与荒漠生态区 | 阿尔泰山 | 60 657.1 | 0.55 | 1.6 | 灌草荒漠转农田(29.5%)、冰川积雪转荒漠(12.7%)、荒漠转草地(12.3%)、草原转荒漠(6.7%)、荒漠草地转湿地(11.5%) |
| 天山 | 515 987.5 | 1.16 | 13.4 | ||
| 昆仑山 | 388 687.8 | 1.20 | 10.1 | ||
| 小计 | 965 332.4 | 2.90 | 25.1 | ||
| 山前倾斜平原与山间盆谷地生态区 | 阿尔泰山盆谷地 | 115 287.8 | 6.08 | 3.0 | 灌草荒漠转农田(66.1%)、农田草地荒漠转建设用地(8.7%) |
| 准噶尔盆地周围山前倾斜平原 | 607 946 | 15.38 | 15.8 | ||
| 天山盆谷地 | 359 998.7 | 10.08 | 9.3 | ||
| 塔里木盆地周边山前倾斜平原 | 774 175.4 | 11.92 | 20.1 | ||
| 小计 | 1 857 407.9 | 43.50 | 48.2 | ||
| 山地与盆地荒漠过渡生态区 | 准噶尔盆地扇缘带 | 50 106.3 | 16.81 | 1.3 | 林灌草转农田(56.3%)、林灌草转湿地(27.3%) |
| 塔里木河与孔雀河下游生态走廊 | 178 524.9 | 8.40 | 4.6 | ||
| 小计 | 228 631.2 | 25.20 | 5.9 | ||
| 盆地荒漠生态区 | 准噶尔盆地 | 303 420.9 | 2.26 | 7.9 | 灌草荒漠转农田(34.6%)、荒漠与灌丛相互转换24.7%)、荒漠与湿地的相互转化(14.2%) |
| 塔里木盆地 | 500 340.9 | 1.16 | 13.0 | ||
| 小计 | 803 761.8 | 3.40 | 20.9 | ||
注:括号中的转换类型的百分比为这些转换类型变化面积占总变化面积百分比 |
The authors have declared that no competing interests exist.
| [1] |
|
| [2] |
|
| [3] |
|
| [4] |
|
| [5] |
|
| [6] |
|
| [7] |
|
| [8] |
|
| [9] |
|
| [10] |
|
| [11] |
|
| [12] |
|
| [13] |
|
| [14] |
|
| [15] |
|
| [16] |
|
| [17] |
|
| [18] |
|
| [19] |
|
| [20] |
|
| [21] |
|
| [22] |
|
| [23] |
|
| [24] |
|
| [25] |
|
| [26] |
|
| [27] |
|
| [28] |
|
| [29] |
|
| [30] |
|
| [31] |
|
| [32] |
|
| [33] |
|
/
| 〈 |
|
〉 |