
Journal of Geo-information Science >
Dynamic Simulation of Urban Expansion and Their Effects on Net Primary Productivity: A Scenario Analysis of Guangdong Province in China
Received date: 2014-11-17
Request revised date: 2014-12-29
Online published: 2015-04-10
Copyright
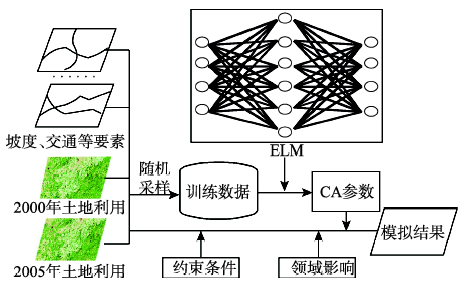
Spatial interactions between multiple cities are important to the temporal and spatial evolution of urban expansion, and even significant to the carbon cycle. In this paper, an ELM-CA model was proposed by introducing extreme learning machine (ELM) into cellular automata (CA) to obtain the CA’s conversion rules. Taking Guangdong Province as an example, the effects of urban expansion on net primary productivity (NPP) were investigated by coupling Biome-BGC with the ELM-CA model. To represent the close interconnections between different cities, their spatial interactions were explicitly embedded in the ELM-CA model. Our results indicated that: the ELM-CA model could simulate the urban expansions in Guangdong Province at a high accuracy. In addition, the urban expansions exhibited crucial impacts on the NPP in Guangdong, which reduced the vegetation NPP evidently. According to the inertial trends of the urban expansion from 2000 to 2005, we found that the urban land development in 2020 may cause a reduction in NPP, which had taken up about 1.79% of the total provincial NPP of Guangdong. In summary, a reasonable guidance on the planning of future urban expansion is critical for the maintenance of carbon balance and climate change.
PEI Fengsong , LI Xia , LIU Xiaoping , XIA Gengrui . Dynamic Simulation of Urban Expansion and Their Effects on Net Primary Productivity: A Scenario Analysis of Guangdong Province in China[J]. Journal of Geo-information Science, 2015 , 17(4) : 469 -477 . DOI: 10.3724/SP.J.1047.2015.00469


Tab. 1 Inputs of ELM-CA model表1 ELM-CA的输入变量 |
| 变量类型 | 变量名称 |
|---|---|
| 城市空间变量 | 离行政中心距离 |
| 离公路距离 | |
| 离高速公路距离 | |
| 离铁路距离 | |
| 城市间相互作用 | 城市相互作用强度 |
| 单元自然属性 | 地形坡度 |
Fig. 1 Details of ELM-CA model图1 基于极限学习机的CA模型 |
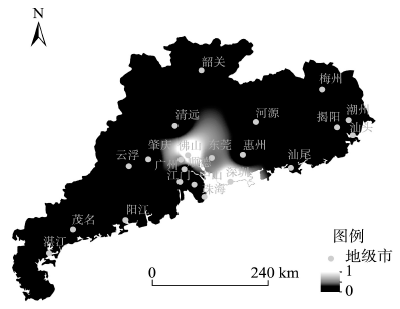
Fig. 2 Intensity of spatial interactions in Guangdong Province图2 广东省城市空间相互作用强度 |
Tab. 2 Comparisons on prediction accuracy of urban development between ANN-CA and ELM-CA models in 2005 for Guangdong Province表2 广东省2005年城市扩张的CA模拟精度对比 |
| 精度(%) | ANN-CA | ELM-CA |
|---|---|---|
| 城市用地 | 73 | 77 |
| 非城市用地 | 99 | 99 |
Tab. 3 Confusion matrix between the actual urban land and the simulated urban land using ELM-CA model表3 广东省城市扩张ELM-CA模型模拟混淆矩阵 |
| 2005年 | 2008年 | |||||
|---|---|---|---|---|---|---|
| 模拟城市用地(像元个数) | 模拟非城市用地(像元个数) | 正确百分比(%) | 模拟城市用地(像元个数) | 模拟非城市用地(像元个数) | 正确百分比(%) | |
| 实际城市用地 | 13 656 | 4087 | 77 | 19112 | 6203 | 75 |
| 实际非城市用地 | 4110 | 688 748 | 99 | 2894 | 681 419 | 99 |
| Kappa系数 | 0.76 | 0.77 | ||||
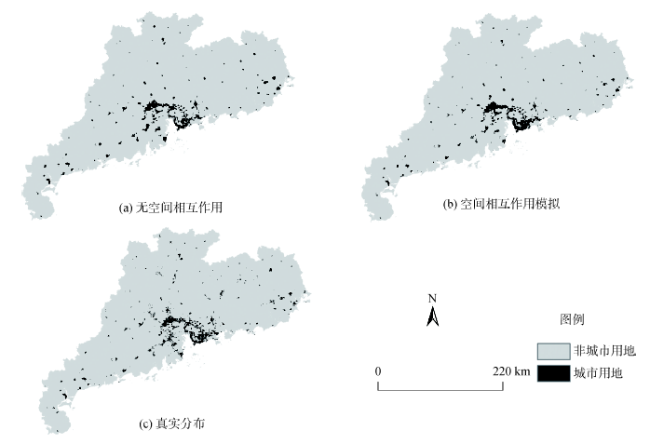
Fig. 3 Comparisons between the actual and the simulated urban land use distributions in 2005图3 2005年模拟和真实土地利用分布对比 |
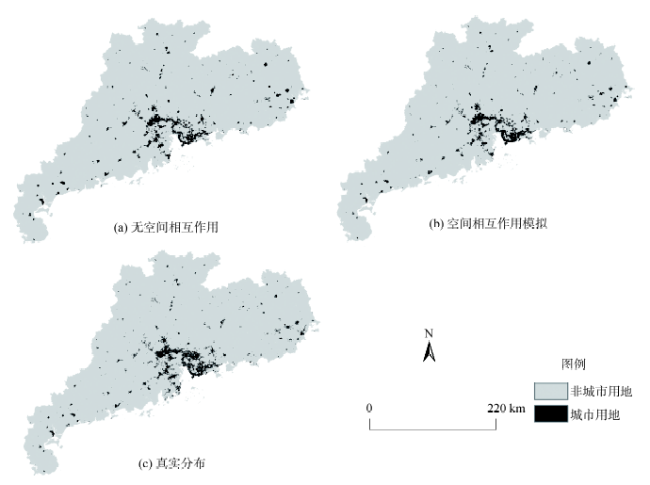
Fig. 4 Comparisons between the actual and the simulated urban land use distributions in 2008图4 2008年模拟和真实土地利用分布对比 |
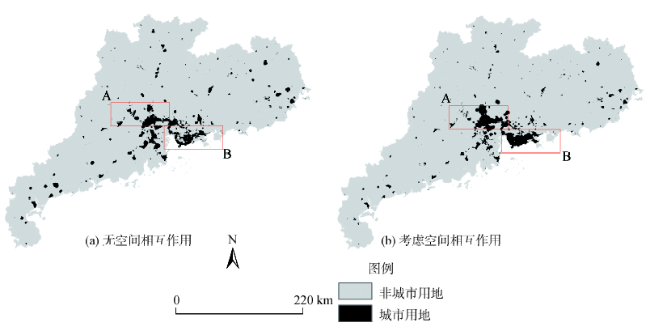
Fig. 5 Simulation of urban land use distribution in 2020 for Guangdong Province图5 模拟2020年广东省城市土地利用分布 |
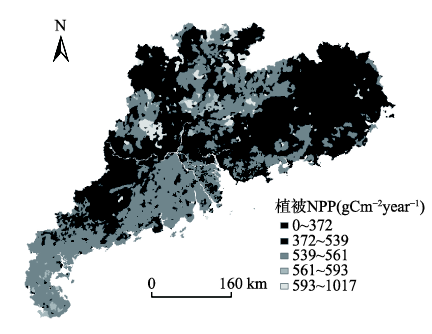
Fig. 6 Spatio-temporal distribution of average NPP in Guangdong Province from 2000 to 2009图6 2000-2009年间广东省平均植被NPP时空分布 |
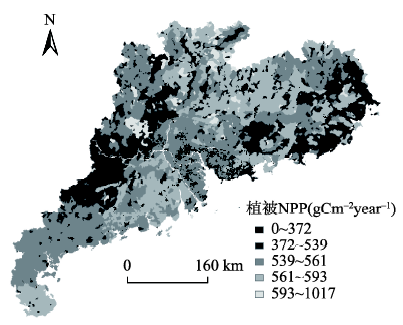
Fig. 7 Distribution of average NPP assuming a stable climate condition in Guangdong Province from 2010 to 2039图7 气候不变条件下2010-2039年间广东省平均植被NPP分布 |
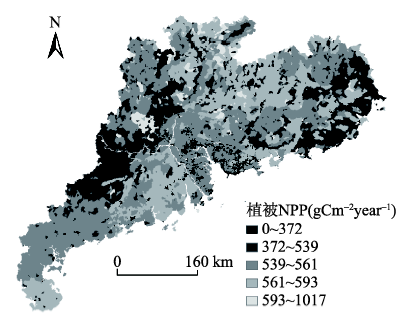
Fig. 8 Distribution of average NPP based on the urban expansion in Guangdong Province from 2010 to 2039图8 城市扩张下2010-2039年间广东省平均植被NPP的空间分布 |
The authors have declared that no competing interests exist.
| [1] |
|
| [2] |
|
| [3] |
|
| [4] |
|
| [5] |
|
| [6] |
|
| [7] |
|
| [8] |
|
| [9] |
|
| [10] |
|
| [11] |
|
| [12] |
|
| [13] |
|
| [14] |
|
| [15] |
|
| [16] |
|
| [17] |
|
| [18] |
|
| [19] |
|
| [20] |
|
| [21] |
|
| [22] |
|
| [23] |
|
| [24] |
|
| [25] |
|
| [26] |
|
| [27] |
|
| [28] |
|
| [29] |
|
| [30] |
|
| [31] |
|
| [32] |
|
| [33] |
|
| [34] |
|
| [35] |
|
| [36] |
|
/
| 〈 |
|
〉 |