
Journal of Geo-information Science >
A New Network Voronoi Diagram Considering the OD Point Density of Taxi and Visual Analysis of OD Flow
Received date: 2015-04-30
Request revised date: 2015-05-29
Online published: 2015-10-10
Copyright
It is very difficult to analyze every vehicle trajectory carefully due to the huge number of data. Therefore, it is necessary to divide the space of one city into a collection of smaller areas, among which we can analyze and exploit the vehicle trajectories. Unfortunately, the existing partitioning methods have many disadvantages which may hinder the progress of our study. For example, some traditional partitioning methods based on the Euclidean distance don’t take into account the spatial characteristics of the roads in the city, which may cause a variety of man-made rigid division. Meanwhile, some other partitioning methods ignore the density distribution of taxi’s track points. With further research on trajectory data, the use of traditional space partitioning methods has difficulty meeting the demands of spatio-temporal trajectory data analysis. As a result, we propose a new Voronoi subdivision algorithm on road network which considers the density of taxi’s OD points and the behavior characteristics of taxis. The main body of the algorithm consists following steps. First, the road network should be divided into a series of edges by their intersections. After that, the edges of the road network are subdivided into small linear units. Next, we produce n×n sized regular grids as the space constraints and choose the generating elements in every grid to make them distributing uniformly in space. Then, we can set different speed values for different generating elements and let them spread to the surrounding roads at different speed. Finally, we can get the road network partitioning results consistent with the density distribution of OD points. A series of city sub-regions can be obtained based on the result of network partitioning. Then, we can analyze the track data in these sub-regions with the help of spatio-temporal data visualization methods, such as color sorting, flow graphs, constructing graph structure, etc. At last, we developed an experimental system to generate the network Voronoi diagram, on which we verify the algorithm and analysis methods presented in this paper by testing with the real Beijing taxi trajectory data of one day. Results of these experiments showed that the information about the trajectory data can be obtained intuitively with the help of network Voronoi diagram and the use of various visualization methods for spatio-temporal data.
XIN Rui , AI Tinghua , YANG Wei , FENG Tao . A New Network Voronoi Diagram Considering the OD Point Density of Taxi and Visual Analysis of OD Flow[J]. Journal of Geo-information Science, 2015 , 17(10) : 1187 -1195 . DOI: 10.3724/SP.J.1047.2015.01187
Fig. 1 Cutting the roads by division nodes图1 通过分割节点切割道路 |
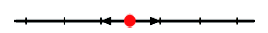
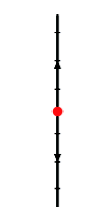
Fig.2 Split the road segments into small linear units图2 道路弧段等分为基础线性单元集 |
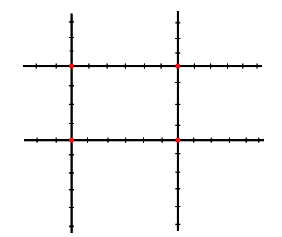
Fig. 3 Use the grid as spatial constraints图3 使用格网进行空间约束 |
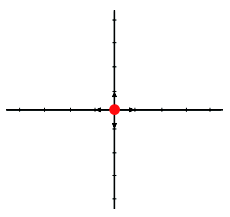
Fig. 4 Determine the generating elements图4 确定发生元 |
Fig. 5 Generating element spread to the surrounding area by one step图5 发生元向四周进行一个步长的扩散 |
Fig. 6 Generating element spread horizontally by one step图6 发生元水平进行一个步长的扩散 |
Fig. 7 Generating element spread vertically by two steps图7 发生元垂直进行2个步长的扩散 |
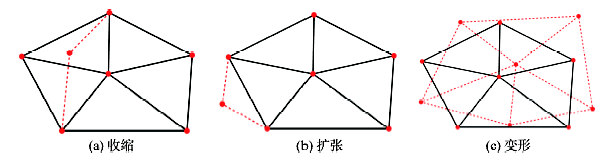
Fig. 8 Structural changes of the topology graph图8 拓扑图的结构变化 |
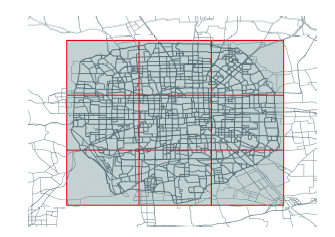
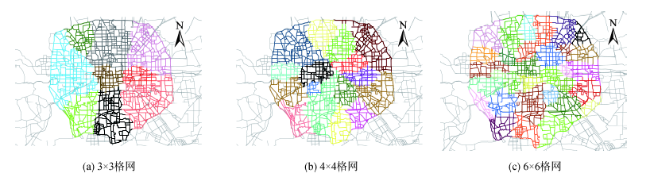
Fig. 9 Road network division under different constraints图9 不同格网约束条件下的路网剖分 |
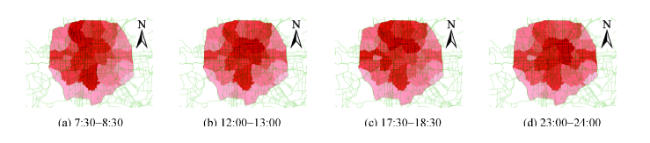
Fig. 10 Taxi inflows at different time periods图10 各时段出租车流入量 |
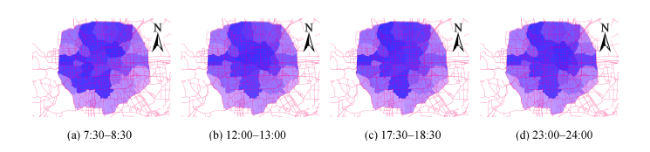
Fig. 11 Taxi outflows at different time periods图11 各时段出租车流出量 |
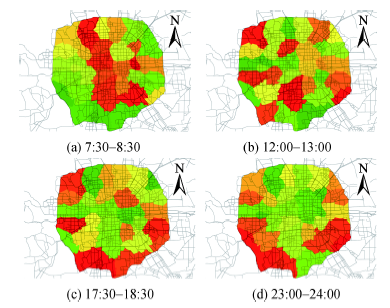
Fig. 12 Taxi net inflow rates at different time periods图12 各时段出租车净流入率 |
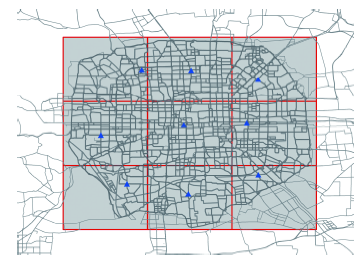
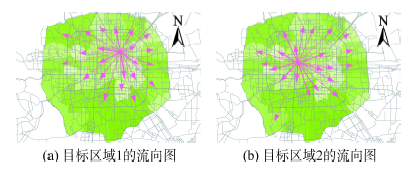
Fig. 13 Regional flow charts图13 区域流向图 |
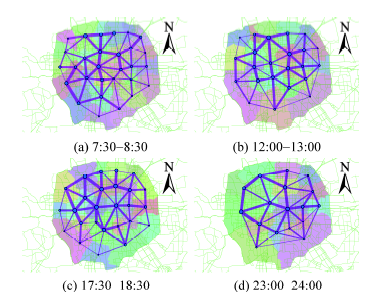
Fig. 14 Graphs of regional traffics at different time periods图14 各时段区域流量图 |
The authors have declared that no competing interests exist.
| [1] |
|
| [2] |
|
| [3] |
|
| [4] |
|
| [5] |
|
| [6] |
|
| [7] |
|
| [8] |
|
| [9] |
|
| [10] |
|
| [11] |
|
| [12] |
|
| [13] |
|
| [14] |
|
| [15] |
|
| [16] |
|
| [17] |
|
| [18] |
|
| [19] |
|
| [20] |
|
| [21] |
|
| [22] |
|
| [23] |
|
/
| 〈 |
|
〉 |
