
Journal of Geo-information Science >
A Method of Extracting Urban Built-up Area Based on DMSP/OLS Nighttime Data and Google Earth
Received date: 2014-08-11
Request revised date: 2014-11-06
Online published: 2015-06-10
Copyright
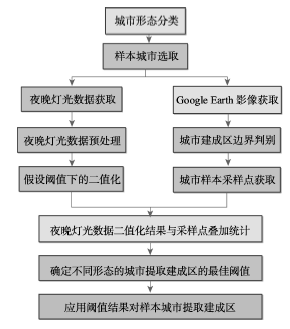
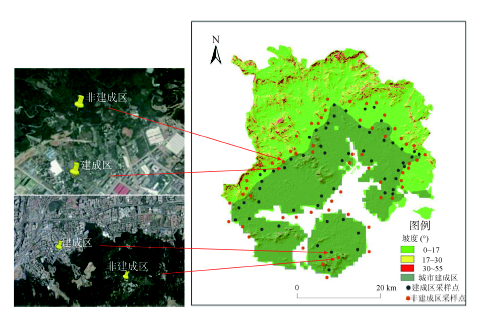
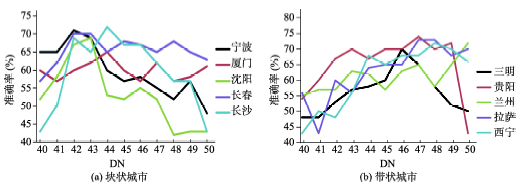
DMSP-OLS nighttime data has been widely used for extracting urban built-up area since the 1970s. It has also been used to estimate the economic level, density of population, changes in spatial patterns of urban landscapes, spatial dynamics of fishery, and the relationships between urbanization, human health and energy consumption. Due to the light’s characteristic of overflowing, the range of city extracted by DMSP-OLS nighttime data surpasses its real boundary in urban area extraction. Therefore, an accurate light threshold determination has become a research hotspot in recent years. In this paper, we sum up the features of four commonly used methods from other dissertations. Then, a spatial comparison method based on Google Earth is adopted to determine the optimum value of light threshold for urban built-up area extraction. Because factors such as terrain and traffic have significant impacts on the urban form, and the urban form influences the value of light threshold, the results of threshold for urban built-up area extraction are divided into two categories according to the urban form. The optimum thresholds for crumb city and strip city are 43 and 47 respectively. Compared to other methods, the spatial comparison method based on Google Earth has two advantages in innovation. Firstly, the classification of threshold result is based on the urban form; meanwhile, it not only breaks the limit of statistical data, but also improves the accuracy of urban built-up area extraction. Secondly, the data sources such as DMSP-OLS nighttime data and Google Earth image used in this method are free and easy to acquire. The method picks a series of sampling points around the whole city on Google Earth as the reference data, which displays not only the results of traditional statistics, but also the spatial differences between the real boundary and the urban area extracted by DMSP-OLS nighttime data. In a word, this method is suitable for extracting urban built-up area in regions with complicated terrains and diverse urban forms.
Key words: DMSP/OLS nighttime data; Google Earth; urban built-up area; urban form; slope
SONG Jinchao , LI Xinhu , LIN Tao , ZHANG Guoqin , YE Hong , HE Xiaoyan , GE Rubing . A Method of Extracting Urban Built-up Area Based on DMSP/OLS Nighttime Data and Google Earth[J]. Journal of Geo-information Science, 2015 , 17(6) : 750 -756 . DOI: 10.3724/SP.J.1047.2015.00750
Fig. 1 Flowchart of data processing图1 数据处理流程 |
Fig. 2 The overlay map of DMSP/OLS nighttime data and Google Earth sampling points图2 夜晚灯光数据与Google Earth采样点叠加示意图 |
Tab. 1 Rules of urban form classification表1 城市形态分类规则 |
| 城市分类 | 周围坡度 | 形状率 |
|---|---|---|
| 块状城市 | <17° | >0.5 |
| 带状城市 | >17° | <0.5 |
Fig. 3 Statistical result of the thresholds for extracting urban area using DMSP/OLS nighttime data图3 夜晚灯光数据提取建成区的最佳阈值统计 |
Tab. 2 Comparison between the statistical area and the extracted urban area based on two thresholds表2 2种阈值提取的城市建成区面积与统计数据比较 |
| 统计数据面积(km2) | 提取面积(km2) | 相对误差(%) | ||
|---|---|---|---|---|
| 块状城市 | 宁波 | 285 | 293 | 3 |
| 厦门 | 246 | 261 | 6 | |
| 沈阳 | 430 | 438 | 2 | |
| 长春 | 418 | 445 | 6 | |
| 长沙 | 306 | 324 | 5 | |
| 带状城市 | 三明 | 29 | 28 | -3 |
| 贵阳 | 162 | 174 | 7 | |
| 兰州 | 197 | 201 | 2 | |
| 拉萨 | 62 | 66 | 6 | |
| 西宁 | 75 | 71 | -5 |
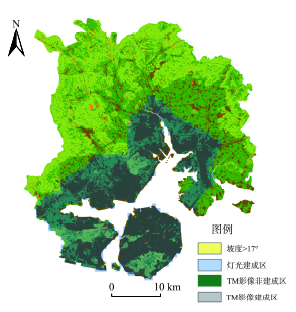
Fig. 4 Comparison of urban area that extracted by TM image and by nighttime data图4 基于TM影像和夜晚灯光数据提取的城市建成区轮廓对比图 |
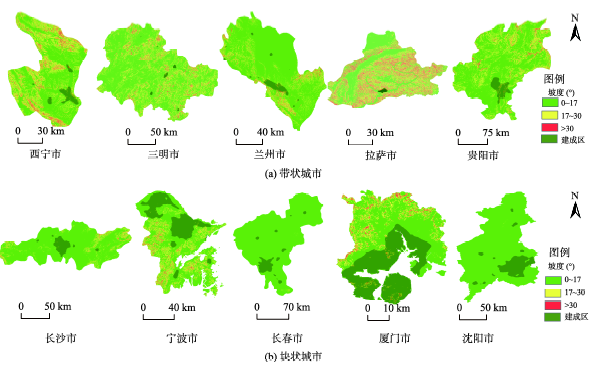
Fig. 5 Results of strip cities (a) and crumb cities (b) area generated by overlaying DMSP/OLS nighttime data and slope图5 夜晚灯光数据和坡度叠加生成的城市建成区 |
The authors have declared that no competing interests exist.
| [1] |
|
| [2] |
|
| [3] |
|
| [4] |
|
| [5] |
|
| [6] |
|
| [7] |
|
| [8] |
|
| [9] |
|
| [10] |
|
| [11] |
|
| [12] |
|
| [13] |
|
| [14] |
|
| [15] |
|
| [16] |
|
| [17] |
|
| [18] |
|
| [19] |
|
| [20] |
|
| [21] |
|
| [22] |
|
| [23] |
中华人民共和国住房和城乡建设部.城市用地竖向规划规范[S].CJJ83-99, 北京:中国建筑工业出版社, 1999.
|
| [24] |
国家统计局城市社会经济调查司.中国城市统计年鉴[M]. 北京:中国统计出版社, 2007-2012.
|
/
| 〈 |
|
〉 |