
Influence of DEM Resolution on the Extraction of Terrain Texture Feature
Received date: 2014-11-04
Request revised date: 2015-01-13
Online published: 2015-07-08
Copyright
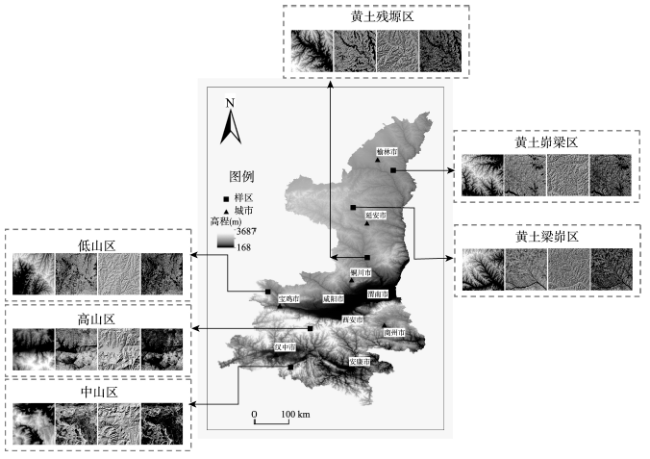
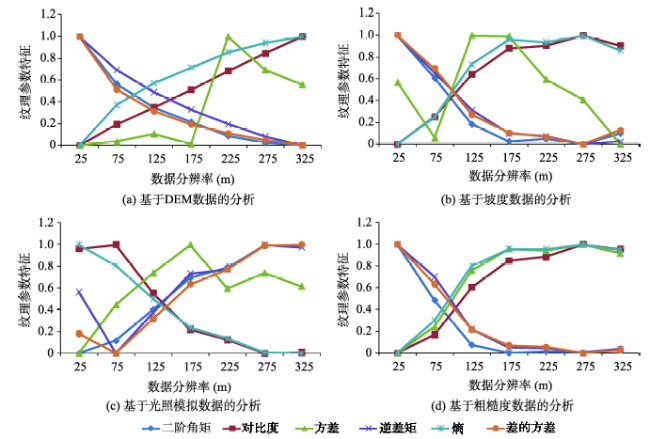
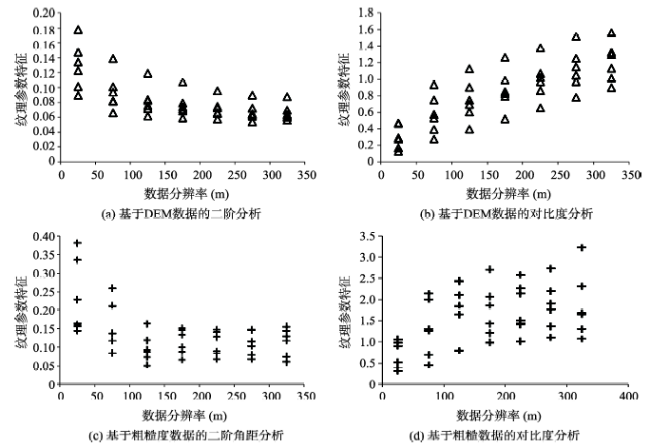
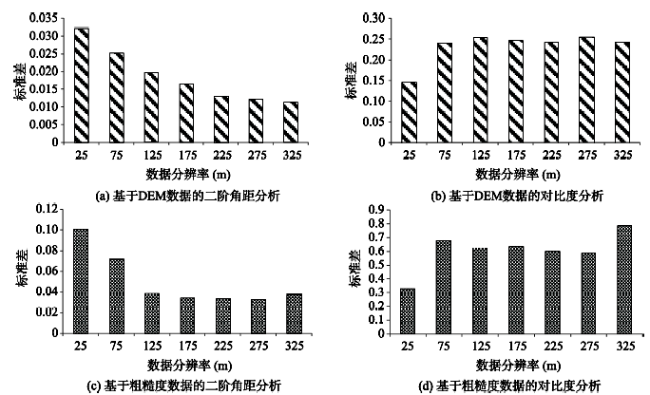
Terrain texture is an important basis to distinguish different types of landform. Due to its purity in representing terrain surface topography and its derivability in terrain analysis, the analysis of DEM based terrain texture has become one of the important research subject in digital terrain analysis. But little research has focused on the scale effect of DEM based terrain texture. In this paper, DEM with 25 m resolution from 6 sample areas that represent the different landform types in Shanxi Province were selected as the source data and were further resampled into different resolutions ranging from 25 m to 325 m with a fixed interval of 50 m. The experiment dataset contains the DEM and its derivatives (slope, hillshading and roughness). A quantitative analysis was conducted on the textural features using gray level co-occurrence matrix (GLCM) model to discuss the variation characteristics of DEM based terrain texture with respect to the varied data resolution. Experiments show that the parameters of DEM and roughness data are the most sensitive factors with respect to the changes in data resolution. When considering different types of sample areas, the variation coefficients of angular second moment (ASM) and contrast (CON) have the biggest values among the six parameters, showing that they have the strongest ability to distinguish different types of landforms. In addition, ASM has relatively high scale-dependency and its distinguish ability declines dramatically with the change of data resolution (the values of standard deviation change from 0.032 to 0.011 and from 0.101 to 0.038), which indicates that ASM is suitable for recognizing the detailed terrain texture. On the contrary, the ability of CON to distinguish landform revealed an increase trend from 25 m to 325 m resolution (the values of standard deviation change from 0.145 to 0.241 and from 0.325 to 0.783), and it has relatively low scale-dependency that indicating its suitability in recognizing the wide-range terrain texture. Overall, this study is significant for a better understanding of DEM based terrain texture, and the scale effects of other texture models will be investigated in further studies.
Key words: gray level co-occurrence matrix; DEM; terrain texture; data resolution; scale effect
HUANG Xiaoli , TANG Guo'an , LIU Kai . Influence of DEM Resolution on the Extraction of Terrain Texture Feature[J]. Journal of Geo-information Science, 2015 , 17(7) : 822 . DOI: 10.3724/SP.J.1047.2015.00822
Fig. 1 The test areas in Shaanxi Province图1 实验样区分布图 |
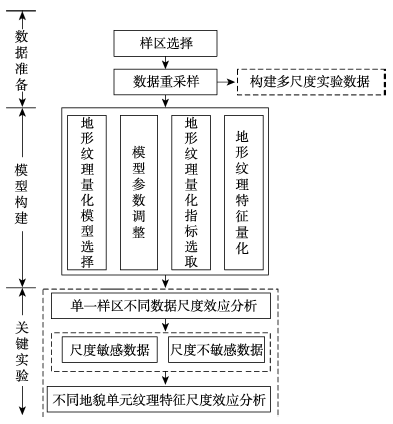
Fig. 2 Process diagram of the experiment图2 实验流程图 |
Tab. 1 The physical significance of each texture parameter表1 纹理参数及物理意义 |
| 名称 | 缩写 | 物理意义 |
|---|---|---|
| 对比度 | CON | 反映邻近栅格间的反差,可理解为纹理的明显度或强度 |
| 二阶角矩 | ASM | 反映纹理特征分布的均匀和粗细程度 |
| 方差 | VAR | 反映纹理变化快慢、周期性大小的物理量 |
| 熵 | ENT | 反映图像的信息量,用于度量纹理的随机性特征,表征纹理的复杂程度 |
| 逆差矩 | IDM | 反映纹理的规则程度 |
| 差的方差 | DFV | 反映邻近栅格灰度值差异的方差 |
Fig. 3 Characteristics of the texture parameters with respect to the varied data resolution图3 纹理参数随数据分辨率变化特征 |
Tab. 2 Statistics of the texture parameters with respect to the varied resolution表2 地形纹理参数随分辨率变化统计 |
| DEM(m) | 二阶角矩 | 对比度 | 方差 | 逆差矩 | 熵 | 差的方差 | 总平均值 |
|---|---|---|---|---|---|---|---|
| S1 | 0.220 | 1.185 | 0.001 | 0.079 | 0.135 | 0.268 | |
| S2 | 0.143 | 0.441 | 0.002 | 0.057 | 0.063 | 0.153 | |
| S3 | 0.100 | 0.314 | 0.003 | 0.047 | 0.043 | 0.106 | |
| S4 | 0.109 | 0.256 | 0.028 | 0.042 | 0.042 | 0.085 | |
| S5 | 0.062 | 0.194 | 0.008 | 0.037 | 0.023 | 0.066 | |
| S6 | 0.023 | 0.150 | 0.004 | 0.028 | 0.015 | 0.058 | |
| 平均值 | 0.109 | 0.423 | 0.008 | 0.048 | 0.053 | 0.123 | 0.128 |
| 坡度(m) | 二阶角矩 | 对比度 | 方差 | 逆差矩 | 熵 | 差的方差 | 总平均值 |
| S1 | 0.149 | 0.172 | 0.044 | 0.055 | 0.033 | 0.073 | |
| S2 | 0.187 | 0.227 | 0.084 | 0.057 | 0.063 | 0.110 | |
| S3 | 0.086 | 0.115 | 0.0004 | 0.038 | 0.027 | 0.050 | |
| S4 | 0.013 | 0.010 | 0.033 | 0.005 | 0.003 | 0.012 | |
| S5 | 0.029 | 0.039 | 0.016 | 0.014 | 0.008 | 0.020 | |
| S6 | 0.062 | 0.039 | 0.035 | 0.004 | 0.016 | 0.041 | |
| 平均值 | 0.088 | 0.100 | 0.036 | 0.029 | 0.025 | 0.051 | 0.055 |
| 光照模拟(m) | 二阶角矩 | 对比度 | 方差 | 逆差矩 | 熵 | 差的方差 | 总平均值 |
| S1 | 0.105 | 0.014 | 0.024 | 0.057 | 0.035 | 0.079 | |
| S2 | 0.237 | 0.176 | 0.015 | 0.04 | 0.059 | 0.150 | |
| S3 | 0.193 | 0.162 | 0.013 | 0.037 | 0.054 | 0.131 | |
| S4 | 0.053 | 0.055 | 0.020 | 0.004 | 0.022 | 0.049 | |
| S5 | 0.107 | 0.075 | 0.007 | 0.023 | 0.029 | 0.075 | |
| S6 | 0.004 | 0.005 | 0.006 | 0.002 | 0.001 | 0.003 | |
| 平均值 | 0.116 | 0.081 | 0.014 | 0.027 | 0.033 | 0.081 | 0.060 |
| 粗糙度(m) | 二阶角矩 | 对比度 | 方差 | 逆差矩 | 熵 | 差的方差 | 总平均值 |
| S1 | 0.318 | 0.408 | 0.287 | 0.056 | 0.249 | 0.151 | |
| S2 | 0.373 | 0.746 | 0.480 | 0.096 | 0.331 | 0.201 | |
| S3 | 0.109 | 0.240 | 0.125 | 0.037 | 0.078 | 0.087 | |
| S4 | 0.019 | 0.031 | 0.009 | 0.002 | 0.0006 | 0.010 | |
| S5 | 0.013 | 0.087 | 0.032 | 0.009 | 0.0206 | 0.037 | |
| S6 | 0.059 | 0.030 | 0.045 | 0.009 | 0.022 | 0.018 | |
| 平均值 | 0.148 | 0.257 | 0.163 | 0.035 | 0.117 | 0.084 | 0.134 |
Tab. 3 Variation coefficients of the texture parameters with respect to the varied resolution表3 地形纹理参数变异系数随分辨率变化统计 |
| DEM(m) | 二阶角矩 | 对比度 | 方差 | 逆差矩 | 熵 | 差的方差 |
|---|---|---|---|---|---|---|
| 25 | 0.249 | 0.485 | 0.183 | 0.077 | 0.079 | 0.231 |
| 75 | 0.268 | 0.414 | 0.202 | 0.094 | 0.066 | 0.185 |
| 125 | 0.240 | 0.337 | 0.205 | 0.086 | 0.052 | 0.148 |
| 175 | 0.216 | 0.281 | 0.206 | 0.076 | 0.046 | 0.124 |
| 225 | 0.182 | 0.242 | 0.205 | 0.068 | 0.039 | 0.110 |
| 275 | 0.182 | 0.226 | 0.209 | 0.065 | 0.038 | 0.109 |
| 325 | 0.171 | 0.199 | 0.208 | 0.060 | 0.032 | 0.099 |
| 平均值 | 0.216 | 0.312 | 0.203 | 0.075 | 0.050 | 0.144 |
| 粗糙度(m) | 二阶角矩 | 对比度 | 方差 | 逆差矩 | 熵 | 差的方差 |
| 25 | 0.431 | 0.464 | 0.274 | 0.103 | 0.220 | 0.234 |
| 75 | 0.483 | 0.514 | 0.328 | 0.148 | 0.205 | 0.308 |
| 125 | 0.401 | 0.328 | 0.561 | 0.123 | 0.142 | 0.255 |
| 175 | 0.302 | 0.369 | 0.244 | 0.115 | 0.114 | 0.213 |
| 225 | 0.310 | 0.327 | 0.233 | 0.115 | 0.108 | 0.211 |
| 275 | 0.300 | 0.315 | 0.231 | 0.111 | 0.102 | 0.191 |
| 325 | 0.334 | 0.417 | 0.314 | 0.123 | 0.136 | 0.222 |
| 平均值 | 0.366 | 0.391 | 0.312 | 0.120 | 0.147 | 0.234 |
Fig. 4 Changes of angular second moment and contrast with respect to the varied data resolution图4 二阶角矩和对比度的特征值随数据分辨率变化特征 |
Fig. 5 The standard deviations of angular second moment and contrast with respect to the varied data resolution图5 二阶角矩和对比度的标准差随数据分辨率变化特征 |
Tab. 4 The variation coefficients of angular second moment and contrast表4 二阶角矩和对比度的变异系数 |
| 二阶角矩 | 对比度 | |
|---|---|---|
| DEM | 0.413 | 0.166 |
| 粗糙度 | 0.524 | 0.232 |
The authors have declared that no competing interests exist.
| [1] |
|
| [2] |
|
| [3] |
|
| [4] |
|
| [5] |
|
| [6] |
|
| [7] |
|
| [8] |
|
| [9] |
|
| [10] |
|
| [11] |
|
| [12] |
|
| [13] |
|
| [14] |
|
| [15] |
|
| [16] |
|
| [17] |
|
| [18] |
|
| [19] |
|
| [20] |
|
/
| 〈 |
|
〉 |