
Journal of Geo-information Science >
Accuracy Assessment for Regional Land Cover Remote Sensing Mapping Product Based on Spatial Sampling: A Case Study of Shaanxi Province, China
Received date: 2015-01-04
Request revised date: 2015-03-11
Online published: 2015-06-10
Copyright
Land cover refers to the complex of various materials of the earth's surface and its natural attributes and characteristics. Land cover data at global scale is fundamental and indispensable for global change studies, and its data quality has been the focus of a variety of international communities. In 2010, China launched the project of 30 m Global Land Cover remotely sensed products with 10 classifications for the base years of 2000 and 2010, which takes a four year period to complete, and the data quality issue will affect its subsequent applications. This paper mainly studies the accuracy assessment method for regional land cover data, as a preliminary of global validation. First, the spatial characteristics of land cover data are discussed, such as being massive, multi-dimensional, and heterogeneous. Then, a general approach based on spatial stratified sampling method for the accuracy assessment of regional land cover product is proposed to improve the traditional sampling method. Considering the spatial characteristics, this article presents the method of spatial stratified sampling: stratified sampling is conducted according to land cover type, the total sample size is calculated using probability and statistics optimal model, and the sample size of each layer is allocated according to the area ratio; while in the sample spatial allocation process, the representative of sample, which implies that the spatial correlation between samples should be low, needed to be considered. In each layer, each sample's spatial correlation is calculated by Moran's I index, and by setting a threshold value, the representative samples are chosen. The final sample set of each layer is randomly selected based on spatial analysis. The spatial sampling scheme is divided into three parts: sampling method, determination of sample size and the sample allocation. We have made an improvement in this paper, by designing a two-step scheme, which are quantitative estimation of sample size and spatial allocation. A case study of Shaanxi Province of China shows the method and process of accuracy assessment for regional land cover product. 1467 samples are selected by spatial stratified sampling in 7 strata. According to the confusion matrix, the overall accuracy is 79.96% and kappa index is 0.74. User's accuracies of all land cover types are more than 75%, while producer's accuracies fluctuate due to the low sample size caused by the low area ratio, which have little impact on the overall accuracy. Experimental results show that the proposed method is applicable to accuracy assessment of regional land cover product. Study on global land cover product will be performed as a main research direction in future.
Key words: land cover; spatial sampling; spatial correlation; accuracy assessment
MENG Wen , TONG Xiaohua , XIE Huan , WANG Zhenhua . Accuracy Assessment for Regional Land Cover Remote Sensing Mapping Product Based on Spatial Sampling: A Case Study of Shaanxi Province, China[J]. Journal of Geo-information Science, 2015 , 17(6) : 742 -749 . DOI: 10.3724/SP.J.1047.2015.00742
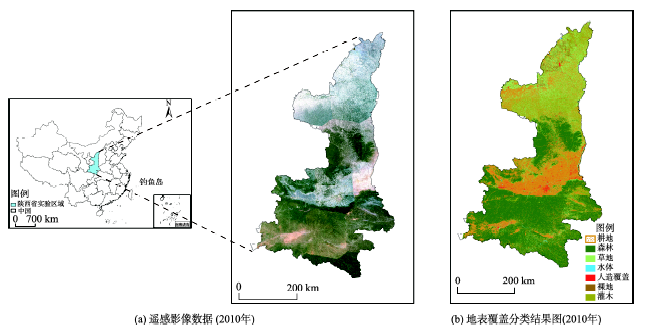
Fig. 1 Geographical location and content of experimental data图1 实验数据的地理位置和数据内容 |
Tab. 1 Classification system of Shaanxi Province's data and the corresponding expected classification accuracy表1 中国陕西省地表类型分类系统及对应的预计分类精度表 |
| 序号 | 一级类名称 | 内容 | 预计分类精度(%) |
|---|---|---|---|
| 1 | 耕地 | (雨养旱地、灌溉间作)、稻田、温室菜地、土地、人工牧草地、农田、种植经济作物或灌木草本作物的耕地、土地复垦废弃 | 80 |
| 2 | 森林 | 落叶阔叶林、常绿阔叶林、落叶针叶林、针叶林、针阔混交林 | 85 |
| 3 | 草地 | 典型草原、草甸草原、高寒草原、荒漠草原、草 | 70 |
| 4 | 水体 | 湖泊、水库、鱼塘、河流 | 85 |
| 5 | 人造覆盖 | 居民地、工业用地或矿区、交通设施 | 80 |
| 6 | 裸地 | 盐碱地、沙、砾石、岩石、生物土壤结皮 | 85 |
| 7 | 灌木 | 沙漠灌丛、高山灌丛、落叶和常绿灌木 | 70 |
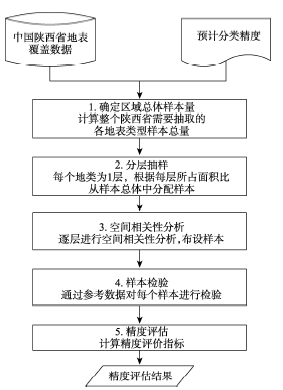
Fig. 2 The flow chart of accuracy assessment on theland-cover data of Shaanxi Province图2 中国陕西省地表数据精度评估流程图 |
Tab. 2 Calculation of sample size of Shaanxi Province表2 陕西省样本总量计算过程 |
| 序号 | 类型 | 像元数(个) | 预计分类精度(%) | 面积比(%) | p值(%) | 样本总量 |
|---|---|---|---|---|---|---|
| 1 | 耕地 | 60 126 746 | 80 | 26 | ||
| 2 | 森林 | 91 027 419 | 85 | 39 | ||
| 3 | 草地 | 38 528 577 | 70 | 16 | ||
| 4 | 水体 | 1 124 905 | 85 | 2 | ||
| 5 | 人造覆盖 | 3 494 298 | 80 | 2 | ||
| 6 | 裸地 | 3 964 620 | 85 | 2 | ||
| 7 | 灌木 | 30 053 218 | 70 | 13 | ||
| 计算结果 | 20.75 | 1467 | ||||
注:面积比是类型像元数与像元总量的比值 |
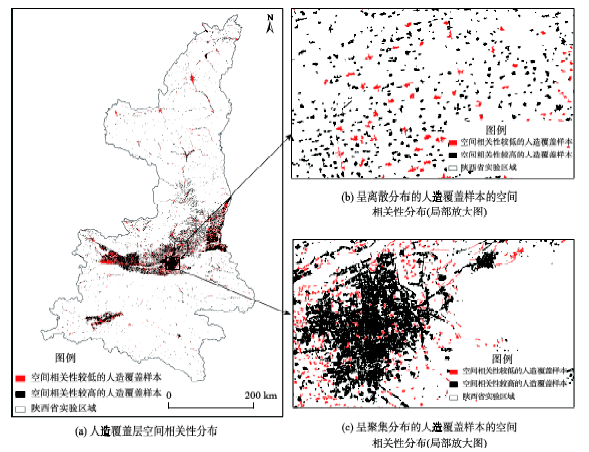
Fig. 3 Spatial correlation analysis of artificial surface layer图3 人造覆盖分层的样本空间相关性分析 |
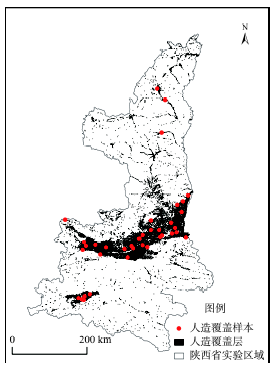
Fig. 4 The allocation of artificial surface samples图4 人造覆盖层样本布设结果 |
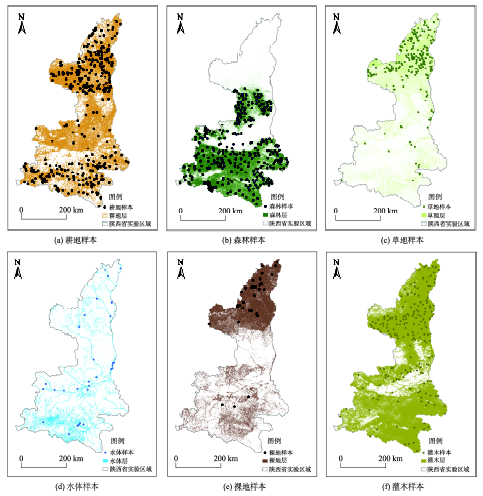
Fig. 5 The sample allocationfor each layer图5 各分层的样本布设 |
Tab. 3 The distribution of sample size in each layer表3 分层抽样样本量分配 |
| 层 | 类型 | 面积比(%) | 每层样本量 |
|---|---|---|---|
| 1 | 耕地 | 26 | 381 |
| 2 | 森林 | 39 | 572 |
| 3 | 草地 | 16 | 234 |
| 4 | 水体 | 2 | 30 |
| 5 | 人造覆盖 | 2 | 30 |
| 6 | 裸地 | 2 | 30 |
| 7 | 灌木 | 13 | 190 |
Tab. 4 Confusion matrix of all samples in Shaanxi Province表4 陕西省所有类型样本的混淆矩阵 |
| 真 实 类 型 | 分类类型 | ||||||||
|---|---|---|---|---|---|---|---|---|---|
| 类型 | 耕地 | 森林 | 草地 | 水体 | 人造覆盖 | 裸地 | 灌木 | 真实总量 | |
| 耕地 | 304 | 31 | 26 | 2 | 5 | 1 | 16 | 385 | |
| 森林 | 14 | 468 | 0 | 0 | 0 | 0 | 4 | 486 | |
| 草地 | 27 | 18 | 176 | 0 | 1 | 3 | 13 | 238 | |
| 水体 | 7 | 10 | 3 | 25 | 1 | 0 | 0 | 46 | |
| 人造覆盖 | 8 | 10 | 5 | 3 | 23 | 0 | 0 | 49 | |
| 裸地 | 14 | 10 | 18 | 0 | 0 | 26 | 6 | 74 | |
| 灌木 | 7 | 25 | 6 | 0 | 0 | 0 | 151 | 189 | |
| 分类总量 | 381 | 572 | 234 | 30 | 30 | 30 | 190 | 1467 | |
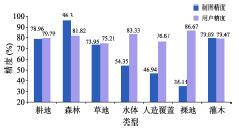
Tab. 5 Producer's accuracy and user's accuracy for each layer表5 各地表类型的制图精度和用户精度 |
| 类型 | 制图精度(%) | 用户精度(%) |
|---|---|---|
| 耕地 | 78.96 | 79.79 |
| 森林 | 96.30 | 81.82 |
| 草地 | 73.95 | 75.21 |
| 水体 | 54.35 | 83.33 |
| 人造覆盖 | 46.94 | 76.67 |
| 裸地 | 35.14 | 86.67 |
| 灌木 | 79.89 | 79.47 |
Fig. 6 Producer's and user's accuracy for each layer图6 陕西省区域地表覆盖遥感制图精度和用户精度图 |
The authors have declared that no competing interests exist.
| [1] |
|
| [2] |
|
| [3] |
|
| [4] |
|
| [5] |
|
| [6] |
|
| [7] |
|
| [8] |
|
| [9] |
|
| [10] |
|
| [11] |
|
| [12] |
|
| [13] |
|
| [14] |
|
| [15] |
|
| [16] |
|
/
| 〈 |
|
〉 |