
Journal of Geo-information Science >
Suitability Evaluation of Land Cultivation in Xinjiang Based on Multiple Natural Geographical Factors
Received date: 2014-12-11
Request revised date: 2015-04-07
Online published: 2015-07-08
Copyright
Located in the northwest frontier of China, Xinjiang holds an important strategic position. Carrying out a study on the distribution of suitable arable land resources of Xinjiang may have a great significance in promoting the rational development of Xinjiang's land resources and ensuring our country's arable land and food security. Based on multi-source natural geographical data, through building an evaluation model with GIS, this article made a multi-level comprehensive evaluation from the spatial aspect on the suitability of land cultivation in Xinjiang. First of all, choosing 10 indicators from 4 factors including topography, climate condition, edaphic condition and ecological condition, making use of the function of spatial analysis in GIS, and combining comprehensive index method with limiting conditions, this article constructed the evaluation model of arable land resources in Xinjiang, from the standpoint of the suitability of land cultivation. Furthermore, the modeling results were compared with the actual arable area extracted from topography, which would be used to determine the classification standard of the results, so that we can evaluate the quantity, quality and spatial pattern of arable land resources in Xinjiang. At last, using the data of cultivated land resources in 2000, 2005 and 2013 in Xinjiang, the research effectively proved the scientificity and rationality of the evaluation model, and also figured out the necessity for further improvements.
Key words: suitability evaluation; arable land resources; GIS; Xinjiang
FANG Yue , CHENG Weiming , ZHOU Chenghu , CHEN Xi , TIAN Changyan . Suitability Evaluation of Land Cultivation in Xinjiang Based on Multiple Natural Geographical Factors[J]. Journal of Geo-information Science, 2015 , 17(7) : 846 -854 . DOI: 10.3724/SP.J.1047.2015.00846
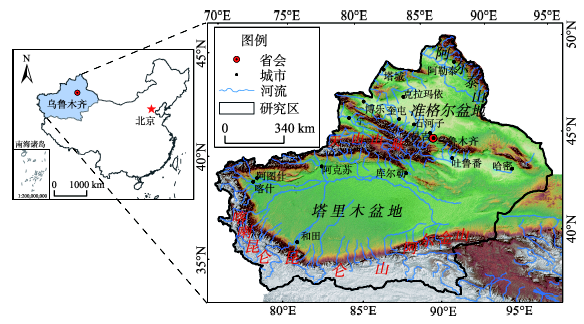
Fig. 1 The location and image of research area图1 研究区地理位置及影像图 |
Tab. 1 Hierarchical structure for the suitability evaluation of cultivation表1 土地耕作适宜性评价层次结构 |
| 决策层C | 条件层B | 因子层A |
|---|---|---|
| 自然质量适宜性 | 地形条件(B1) | 海拔(A1) |
| 起伏度(A2) | ||
| 坡度(A3) | ||
| 坡向(A4) | ||
| 气候条件(B2) | ≥10 ℃积温(A5) | |
| 干燥度(A6) | ||
| 土壤条件(B3) | 土层厚度(A7) | |
| 土壤种类(A8) | ||
| 盐渍化程度(A9) | ||
| 生态条件(B4) | 生态因子(A10) |
Tab. 2 Suitability grade and membership degree for quantitative factors表2 评价因子的土地耕作适宜等级及隶属度 |
| 因子编号 | 评价因子 | 适宜等级及隶属度 | |||||
|---|---|---|---|---|---|---|---|
| 1级 | 2级 | 3级 | 4级 | 5级 | |||
| A1 | 海拔(m) | 分级范围 | <2000 | 2000~2500 | 2500~3000 | 3000~3500 | >3500 |
| μA(i) | 10 | 7 | 4 | 1 | 0 | ||
| A2 | 起伏度(m) | 分级范围 | <30 | 30~70 | 70~200 | 200~500 | >500 |
| μA(i) | 10 | 7 | 4 | 1 | 0 | ||
| A3 | 坡度(°) | 分级范围 | <2 | 2~7 | 7~15 | 15~25 | >25 |
| μA(i) | 10 | 8 | 3 | 1 | 0 | ||
| A4 | 坡向 | 分级范围 | 阳坡 | 半阳坡 | 半阴坡 | 阴坡 | — |
| μA(i) | 10 | 7 | 4 | 1 | — | ||
| A5 | ≥10 ℃积温(℃) | 分级范围 | >4500 | 4500~3500 | 3500~2500 | 2500~1500 | — |
| μA(i) | 10 | 7 | 4 | 1 | — | ||
| A6 | 干燥度 | 分级范围 | <2 | 2~3 | 3~4 | 4~10 | >10 |
| μA(i) | 10 | 7 | 4 | 1 | 0 | ||
| A7 | 土层厚度(cm) | 分级范围 | >100 | 100~70 | 70~30 | 30~20 | <20 |
| μA(i) | 10 | 7 | 4 | 1 | 0 | ||
| A8 | 土壤种类 | 分级范围 | 人为土、水成土和半水成土 | 漠土、钙层土和干旱土 | 半淋溶土、淋溶土和盐碱土 | 初育土、高山土 | 其他类型 |
| μA(i) | 10 | 8 | 3 | 1 | 0 | ||
| A9 | 盐渍化程度 | 分级范围 | 非盐渍化 | 轻度盐渍化 | 中度盐渍化 | 重度盐渍化 | 盐滩 |
| μA(i) | 10 | 5 | 3 | 1 | 0 | ||
| A10 | 生态因子 | 分级范围 | 非生态保护区 | — | — | — | 生态保护区 |
| μA(i) | 10 | — | — | — | 0 | ||
Tab. 3 Contribution weights of quantitative factors表3 土地耕作适宜性评价因子权重系数 |
| 决策层(C) | |||||
|---|---|---|---|---|---|
| 因子层(A) | 条件层(B) | 复合权重 | |||
| B1 | B2 | B3 | B4 | Pi=Ai×Bi | |
| 0.40 | 0.15 | 0.35 | 0.10 | ||
| 海拔(A1) | 0.40 | 0.16 | |||
| 起伏度(A2) | 0.30 | 0.12 | |||
| 坡度(A3) | 0.25 | 0.10 | |||
| 坡向(A4) | 0.05 | 0.02 | |||
| ≥10 ℃积温(A5) | 0.60 | 0.09 | |||
| 干燥度(A6) | 0.40 | 0.06 | |||
| 土层厚度(A7) | 0.40 | 0.14 | |||
| 土壤种类(A8) | 0.40 | 0.14 | |||
| 盐渍化程度(A9) | 0.20 | 0.07 | |||
| 生态保护区(A10) | 1.00 | 0.10 | |||
| 合计 | 1.00 | 1.00 | 1.00 | 1.00 | 1.00 |
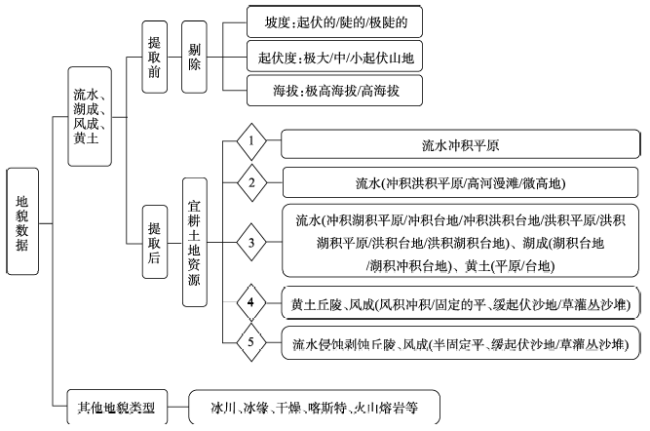
Fig. 2 Grade extraction flowchart of arable land resource based on topographic data图2 基于地貌数据的宜耕土地资源等级提取技术流程 |
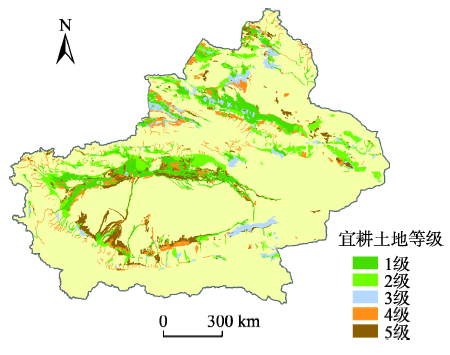
Fig. 3 Distribution of topographic data extraction on classification图3 基于地貌数据的宜耕土地资源等级分布 |
Tab. 4 Classification criteria of suitability index (SI)表4 土地耕作适宜性评价等级划分标准 |
| 等级 | 适宜性指数(SI) | 适宜程度 |
|---|---|---|
| 1级 | >9.56 | 最适宜耕作土地 |
| 2级 | 9.56-8.68 | 较适宜耕作土地 |
| 3级 | 8.68-7.59 | 一般适宜耕作土地 |
| 4级 | 7.59-6.42 | 较不适宜耕作土地 |
| 5级 | 6.42-5.31 | 边缘适宜耕作土地 |
| 6级 | <5.31 | 不适宜耕作土地 |
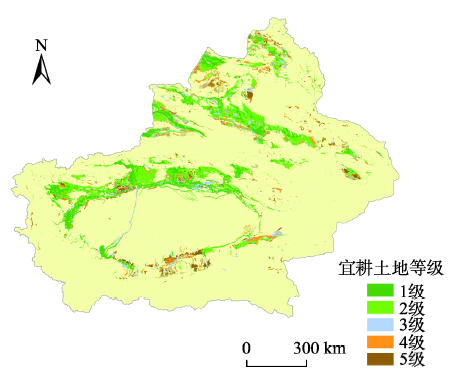
Fig. 4 Distribution of suitability factors extraction on classification图4 基于评价模型的宜耕土地资源等级分布 |
Tab. 5 Grade extraction of arable land resource based on the suitability evaluation表5 土地耕作适宜性评价提取结果 |
| 等级 | 面积(万km2) | 比重(%) |
|---|---|---|
| 1级 | 8.07 | 32.35 |
| 2级 | 6.67 | 26.74 |
| 3级 | 3.87 | 15.51 |
| 4级 | 3.20 | 12.83 |
| 5级 | 3.07 | 12.30 |
| 总土地资源 | 24.93 | 100.00 |
Tab. 6 Consistency between the cultivated land and the arable land resource in different years表6 不同年份耕地资源与模型下宜耕土地资源的契合程度 |
| 2000年 | 2005年 | 2013年 | ||||||
|---|---|---|---|---|---|---|---|---|
| 面积(万km2) | 契合率(%) | 面积(万km2) | 契合率(%) | 面积(万km2) | 契合率(%) | |||
| 宜耕土地资源 | 5.803 | 97.75 | 6.586 | 97.71 | 6.699 | 96.74 | ||
| 非宜耕土地资源 | 0.131 | 2.25 | 0.154 | 2.29 | 0.226 | 3.26 | ||
| 总耕地资源 | 5.934 | 6.740 | 6.925 | |||||
Tab. 7 Consistency between the cultivated land and the five grades of arable land resource in different years表7 不同年份耕地资源与模型下5级宜耕土地资源的契合程度 |
| 等级 | 2000年 | 2005年 | 2013年 | |||||
|---|---|---|---|---|---|---|---|---|
| 面积(万km2) | 比重(%) | 面积(万km2) | 比重(%) | 面积(万km2) | 比重(%) | |||
| 1级 | 3.550 | 61.17 | 3.853 | 58.51 | 3.879 | 57.72 | ||
| 2级 | 1.783 | 30.73 | 2.119 | 32.18 | 2.210 | 32.56 | ||
| 3级 | 0.307 | 5.29 | 0.382 | 5.80 | 0.406 | 6.02 | ||
| 4级 | 0.114 | 1.96 | 0.154 | 2.34 | 0.164 | 2.43 | ||
| 5级 | 0.050 | 0.86 | 0.077 | 1.17 | 0.086 | 1.27 | ||
| 总宜耕土地资源 | 5.803 | 100.00 | 6.586 | 100.00 | 6.745 | 100.00 | ||
Tab. 8 Consistency between the newly reclaimed land and the arable land resource in different periods表8 不同时期新开垦耕地资源与模型下宜耕土地资源的契合程度 |
| 2000-2005年 | 2005-2013年 | ||||
|---|---|---|---|---|---|
| 面积(万km2) | 比重(%) | 面积(万km2) | 比重(%) | ||
| 新开垦耕地 | 1.002 | — | 0.414 | — | |
| 新开垦宜耕土地资源 | 0.912 | 91.00 | 0.349 | 84.58 | |
| 新开垦非宜耕土地资源 | 0.090 | 9.00 | 0.064 | 15.42 | |
Tab. 9 Consistency between the newly reclaimed land and the five grades of arable land resource in different periods表9 不同时期新开垦宜耕土地资源与模型下5级分类的契合程度 |
| 等级 | 2000-2005年 | 2005-2013年 | |||
|---|---|---|---|---|---|
| 面积(万km2) | 比重(%) | 面积(万km2) | 比重(%) | ||
| 1级 | 0.525 | 57.57 | 0.182 | 52.23 | |
| 2级 | 0.196 | 21.49 | 0.074 | 21.16 | |
| 3级 | 0.112 | 12.30 | 0.049 | 13.92 | |
| 4级 | 0.048 | 5.25 | 0.027 | 7.83 | |
| 5级 | 0.031 | 3.38 | 0.017 | 4.86 | |
| 总宜耕土地资源 | 0.912 | — | 0.349 | — | |
Tab. 10 Consistency between the newly reclaimed unarable land resource and the fluctuated factors during 2000-2005表10 2000-2005年间新开垦非宜耕土地资源与各波动因子的契合程度 |
| 等级 | A5 | A6 | A7 | A8 | |||||||
|---|---|---|---|---|---|---|---|---|---|---|---|
| ≥10 ℃积温 | 干燥度 | 土层厚度 | 土壤种类 | ||||||||
| 面积(km2) | 比重(%) | 面积(km2) | 比重(%) | 面积(km2) | 比重(%) | 面积(km2) | 比重(%) | ||||
| 1级 | 8.82 | 0.98 | 7.38 | 0.82 | 443.34 | 49.26 | 97.56 | 10.84 | |||
| 2级 | 375.57 | 41.73 | 2.34 | 0.26 | 10.17 | 1.13 | 560.52 | 62.28 | |||
| 3级 | 463.23 | 51.47 | 32.85 | 3.65 | 8.01 | 0.89 | 116.55 | 12.95 | |||
| 4级 | 52.38 | 5.82 | 173.34 | 19.26 | 0.00 | 0.00 | 120.78 | 13.42 | |||
| 5级 | 0.00 | 0.00 | 684.18 | 76.02 | 438.48 | 48.72 | 4.59 | 0.51 | |||
Tab. 11 Consistency between the newly reclaimed unarable land resource and the fluctuated factors during 2005-2013表11 2005-2013年间新开垦非宜耕土地资源与各波动因子的契合程度 |
| 等级 | A5 | A6 | A7 | A8 | |||||||
|---|---|---|---|---|---|---|---|---|---|---|---|
| ≥10 ℃积温 | 干燥度 | 土层厚度 | 土壤种类 | ||||||||
| 面积(km2) | 比重(%) | 面积(km2) | 比重(%) | 面积(km2) | 比重(%) | 面积(km2) | 比重(%) | ||||
| 1级 | 3.705 | 0.65 | 0 | 0.00 | 342.228 | 60.04 | 41.097 | 7.21 | |||
| 2级 | 382.812 | 67.16 | 1.938 | 0.34 | 2.964 | 0.52 | 309.681 | 54.33 | |||
| 3级 | 168.492 | 29.56 | 3.363 | 0.59 | 2.907 | 0.51 | 54.435 | 9.55 | |||
| 4级 | 14.934 | 2.62 | 102.372 | 17.96 | 0.000 | 0.00 | 155.211 | 27.23 | |||
| 5级 | 3.705 | 0.65 | 462.327 | 81.11 | 221.844 | 38.92 | 9.576 | 1.68 | |||
The authors have declared that no competing interests exist.
| [1] |
|
| [2] |
|
| [3] |
|
| [4] |
|
| [5] |
|
| [6] |
|
| [7] |
|
| [8] |
|
| [9] |
|
| [10] |
|
| [11] |
|
| [12] |
|
| [13] |
|
| [14] |
|
| [15] |
|
/
| 〈 |
|
〉 |