
Journal of Geo-information Science >
Evolution and Genetic Analysis of Land Subsidence in Beijing Typical Area
Received date: 2014-08-20
Request revised date: 2015-01-22
Online published: 2015-08-05
Copyright
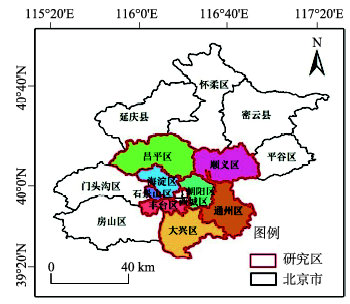
Since land subsidence was firstly discovered in the 1950s in Beijing city, it has revealed a rapid developing trend. In the past few decades, land subsidence has been increasing in both its range and speed year by year and become one of the most serious disasters affecting the safety and development of Beijing [1]. In this paper, we choose four typical subsidence locations as the study area. The land subsidence information of the typical area in Beijing plain during 2004-2010 was used as the primary data source. This is acquired by Permanent Scatterers Synthetic Aperture Radar Interferometry (PS-InSAR) method, which has high accuracy and been widely used in deformation monitoring and land subsidence research. Meanwhile, the conventional monitoring data (1955-2010) was adopted as the supplement data. Then, we analyzed subsidence evolution characteristics from two aspects: spatial distribution and temporal evolution. Combing with the groundwater dynamic monitoring data, the land-use data from remote sensing and the using of GIS spatial analysis, we study the spatial and temporal respond and the important factors affecting land subsidence. The result shows that the seriously affected areas of ground subsidence in Beijing had expanded unceasingly, and the degree of unevenness has been gradually increasing. During the study period, the change of groundwater level had a high consistency with land subsidence in temporal and spatial distribution. In the process of urban development, engineering activities were considered another factor affecting the characteristics of spatial and temporal distribution of land subsidence. In this paper, our research indicated that the excessive exploitation of groundwater is the main influence factor for the subsidence in Beijing; and the rapid development of city leading to large-scale construction is also one of the factors that make the subsidence worse and more serious. The results have considerable referential importance and can provide a scientific basis for the prevention of land subsidence in Beijing.
ZHANG Wen , GONG Huili , CHEN Beibei , DUAN Guangyao . Evolution and Genetic Analysis of Land Subsidence in Beijing Typical Area[J]. Journal of Geo-information Science, 2015 , 17(8) : 909 -916 . DOI: 10.3724/SP.J.1047.2015.00909
Fig. 1 Location and extent of the study area in Beijiing图1 研究区位置与范围 |
Tab. 1 Comparison results between InSAR values and leveling (2009)表1 InSAR值与水准测量值比较结果(2009年) |
| 编号 | 经度() | 纬度() | 水准(mm) | InSAR(mm) | 互差(mm) |
|---|---|---|---|---|---|
| 1 | 116.2997 | 39.49833 | -40.52 | -40.0056 | -0.5144 |
| 2 | 116.3917 | 40.13333 | -26.52 | -24.6693 | -1.8507 |
| 3 | 116.4544 | 40.03256 | -44.52 | -48.8844 | 4.3644 |
| 4 | 116.5247 | 39.86306 | -36.39 | -36.3691 | -0.0209 |
| 5 | 116.5419 | 40.09778 | -44.97 | -44.9910 | 0.0210 |
| 6 | 116.6558 | 40.09917 | -23.17 | -24.7429 | -1.5729 |
Tab. 2 Verification of INSAR results (2009)表2 InSAR结果验证(2009年) |
| 验证指标值 | 最大绝对误差(mm) | 最小绝对误差(mm) |
|---|---|---|
| 4.3644 | 0.021 |
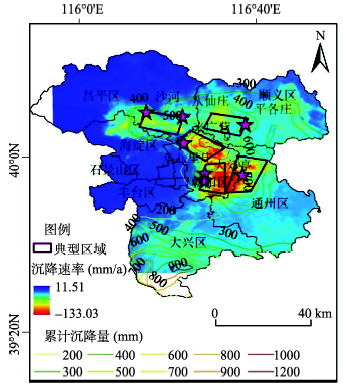
Fig. 2 The distribution of ground subsidence and sedimentation rate in the study area in 1955 and 2010图2 研究区1955-2010年间累积地面沉降量及沉降速率空间分布叠加图 |
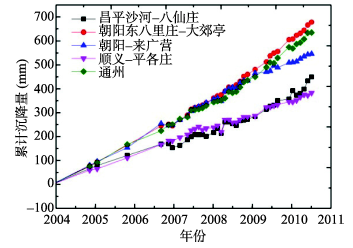
Fig. 3 The line graph of accumulative total volume of subsidence in typical subsidence regions (2004-2010)图3 典型区域累积沉降量折线图(2004-2010年) |
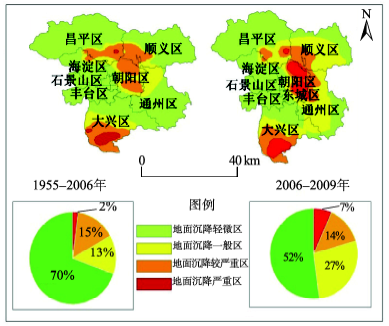
Fig. 4 The extent and area ratio of land subsidence (1955-2006 and 2006-2009)图4 地面沉降危险性分区和面积比例图(1955-2006、2006-2009年) |
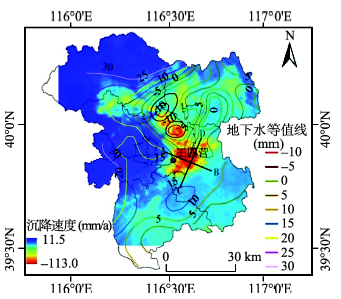
Fig. 5 Land subsidence rates and groundwater depth overlay map (2004-2010)图5 沉降速率和地下水埋深叠加图(2004-2010年) |
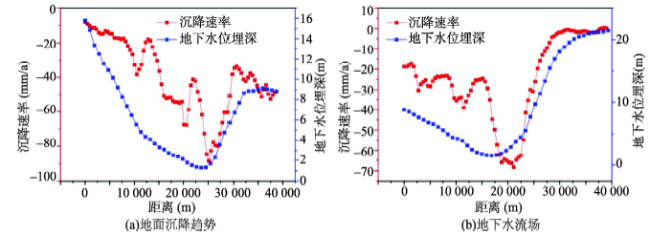
Fig. 6 The profile of land subsidence trend and the correlation with groundwater flow field (A-B, C-D)图6 地面沉降趋势与地下水流场相关性剖面图(图5所指A-B,C-D剖面) |
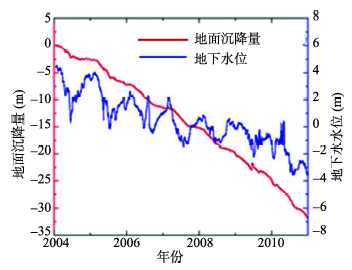
Fig. 7 Subsidence curves and corresponding groundwater table curves at Wangsiying station图7 王四营站分层标与同层段内水位标高变化曲线 |
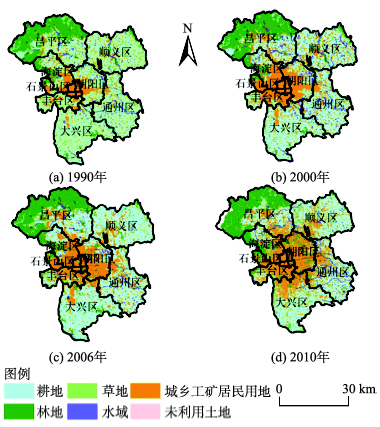
Fig. 8 Land use changes in Beijing city (1990-2010)图8 北京城区土地利用变化情况(1990-2010年) |
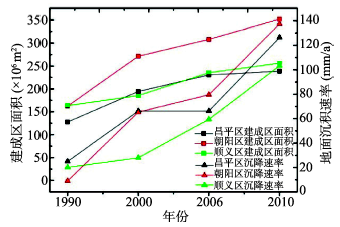
Fig. 9 The area of construction and the land subsidence rate curve in typical regions图9 典型区域建成区面积与地面沉降速率曲线 |
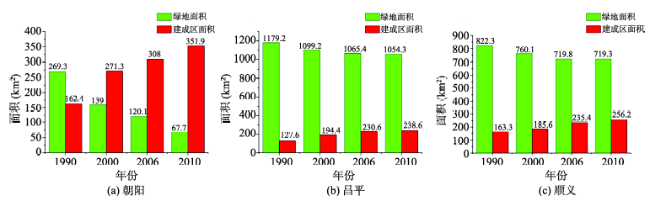
Fig 10 Comparison of building and vegetation cover area of Chaoyang, Changping and Shunyi districts图10 朝阳、昌平、顺义3区建成区面积和绿地面积变化 |
The authors have declared that no competing interests exist.
| [1] |
|
| [2] |
|
| [3] |
|
| [4] |
|
| [5] |
|
| [6] |
|
| [7] |
|
| [8] |
|
| [9] |
|
| [10] |
|
| [11] |
|
| [12] |
|
| [13] |
|
| [14] |
|
| [15] |
|
| [16] |
|
| [17] |
|
| [18] |
|
| [19] |
|
| [20] |
|
| [21] |
|
| [22] |
|
/
| 〈 |
|
〉 |