
Journal of Geo-information Science >
Research on Winter Wheat Yield Estimation Based on Assimilation of Leaf Area Index and Evapotranspiration Data
Received date: 2014-09-19
Request revised date: 2015-01-19
Online published: 2015-07-08
Copyright
Assimilating remote sensing information into crop growth model is an important approachto estimate regional crop yield. The assimilation algorithm and corresponding assimilation variables are the keys of the assimilation system, which greatly impact the accuracy of assimilation results. In thepaper, the default irrigation parameters of WOFOST were optimized firstly with the help of calibrating WOFOST crop model parameters. Then, ET data was chosen as the assimilation variable to build the cost function of time series trends using MODIS ET products (MOD16A2) and WOFOST simulation. And LAI data was assimilatedwith the cost function of four dimensional variational data assimilation method using MODIS LAI (MCD15A3) products and WOFOST simulation. Furthermore, parameters including the crop initial dry matter(TDWI), the lifetime of crop in 35℃(SPAN) and the irrigation(RIRR) were optimizedcontinuously by SCE—UA algorithm, which would stop running the program when the cost function isoptimal. The estimatedcrop yield results were obtained usingfour methods comparatively under water limited mode, including the method thm2t does not assimilate and methods thm2t assimilateET, assimilateLAI and assimilate both ET and LAI.We address the assimilation of double variables to be the methodthm2t ET and LAI arebothm2ssimilated. Finally, the accuracies of yield estimation by assimilating double variables and a single variable under water limited mode were compared and analyzed. The results indicated thm2t the method of assimilating double variables was better than assimilating a single variable, which got the highest accuracy (R2=0.432, RMSE=721 kg/hm2). The method of assimilating high precision LAIsignificantly improved the accuracy of yield estimation (R2=0.408, RMSE=925 kg/hm2). The method of assimilating ET demonstratedbetter performance when the WOFOST model simulates the water balance during crop growing period, but had a limited impacton improving the accuracy of yield estimation (R2=0.013, RMSE=1134 kg/hm2) compared with model simulation (R2=0.006, RMSE=1210 kg/hm2). This research provided a reference for studies in other areas on predicting crop production at regional scale thm2t based on assimilating double variables.
BAO Shanning , CAO Chunxiang , HUANG Jianxi , MA Hongyuan , TIAN Liyan , SU Wei , NI Xiliang . Research on Winter Wheat Yield Estimation Based on Assimilation of Leaf Area Index and Evapotranspiration Data[J]. Journal of Geo-information Science, 2015 , 17(7) : 871 -882 . DOI: 10.3724/SP.J.1047.2015.00871
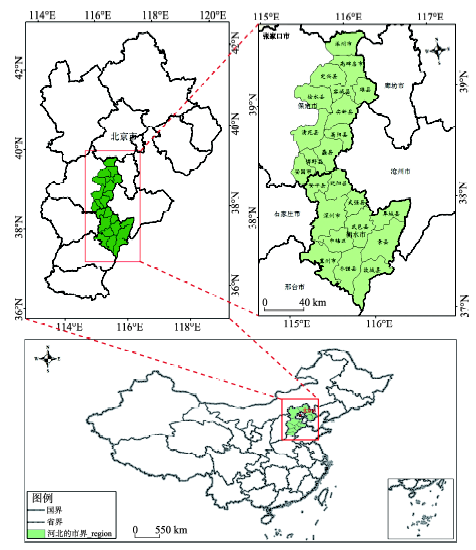
Fig. 1 Location of the study area图1 研究区域位置 |
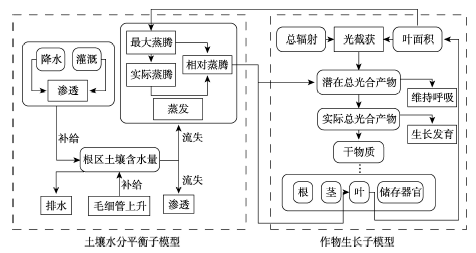
Fig. 2 The schematic diagram of WOFOST cropmodel图2 WOFOST作物模型示意图 |
Tab. 1 The table of WOFOST cropmodel parameters表1 WOFOST作物模型参数表 |
| 参数 | 中文描述 | 取值 | 来源 |
|---|---|---|---|
| TSUM1 | 出苗到开花积温 | 777.0 ℃·d-1 | 实测计算 |
| TSUM2 | 开花到成熟积温 | 672.0 ℃·d-1 | |
| DLO | 发育最适光长 | 14 h | 文献 |
| DLC | 临界光长 | 8 h | |
| CVL | 叶同化物转化效率 | 0.740 kg·kg-1 | 实测计算 |
| CVO | 贮存器官同化物转化效率 | 0.830 kg·kg-1 | |
| CVR | 根同化物转化效率 | 0.694 kg·kg-1 | |
| CVS | 茎同化物转化效率 | 0.740 kg·kg-1 | |
| SLATB | 比叶面积 | DVS=0 | |
| 0.00224 hm2·kg-1 | |||
| DVS=2.0 | |||
| 0.00350 hm2·kg-1 | |||
| SMW | 凋萎土壤含水量 | 0.072 cm3·cm-3 | 实测 |
| SMFCF | 田间持水量 | 0.325 cm3·cm-3 | |
| SM0 | 饱和含水量 | 0.506 cm3·cm-3 | |
| TBASE | 出苗最低温度下限 | 0℃ | 文献 |
| LAIEM | 出苗时叶面积指数 | 0.13 hm2·hm-2 | WOFOST |
| RGRLAI | 叶面积指数最大增长速率 | 0.00817 hm2·hm-2·d-1 | |
| KDIFTB | 漫射光的消散系数 | 0.6 | |
| EFFTB | 单叶片同化CO2的光能利用率 | 0.47(kg·hm-2·h-1)/(J·m-2·s-1) | |
| AMAXTB | 最大CO2同化速率 | 45 kg·hm-2·h-1 | |
| Q10 | 温度升高10 ℃呼吸作用变化速率 | 2 | |
| RML | 叶相对维持呼吸作用 | 0.03 kg·kg-1·d-1 | |
| RMO | 贮存器官的维持呼吸作用 | 0.01 kg·kg-1·d-1 | |
| RMR | 根的维持呼吸作用 | 0.015 kg·kg-1·d-1 | |
| RMS | 茎的维持呼吸作用 | 0.015 kg·kg-1·d-1 |
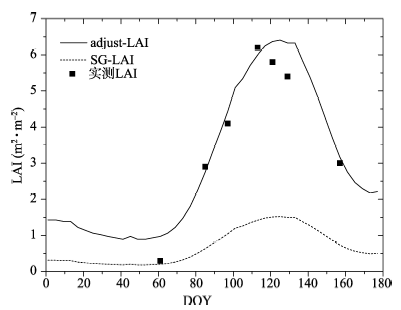
Fig. 3 The comparison chart of LAI before and after adjustment图3 LAI调整前后对比图 |
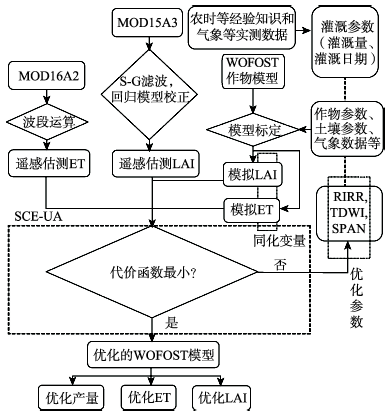
Fig. 4 The flow chart of assimilating ET and LAI jointly图4 同化ET和LAI双变量技术流程图 |
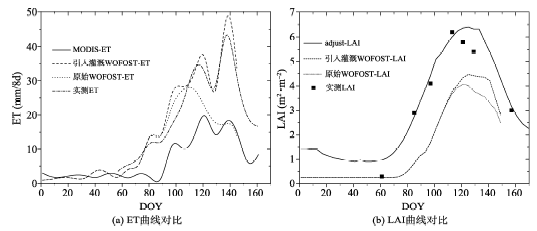
Fig. 5 The comparison chart of time series curves图5 引入灌溉前后时序曲线对比图 |
Tab. 2 The defining scheme of the irrigation parameters in WOFOST表2 标定WOFOST模型灌溉参数的方案 |
| 生育阶段 | 拔节-抽穗 | 灌浆-成熟 |
|---|---|---|
| 灌溉量(cm) | 8.006 | 9.839 |
| 灌溉日期 | 4.6-4.13 | 5.23-5.30 |
| 儒略日DOY | 97-104 | 137-144 |
| 遥感数据日期 | 第97天 | 第137天 |
| WOFOST模型参数 | RIRR1 | RIRR2 |
Tab. 3 The initial values of optimization parameters表3 模型初始参数值 |
| 参数名称 | TDWI | SPAN | RIRR1 | RIRR2 |
|---|---|---|---|---|
| 初始值 | 210 | 27 | 8.006 | 9.839 |
| 单位 | kg/hm2 | d | cm | cm |
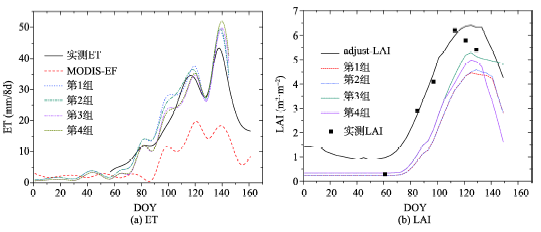
Tab. 4 Data assimilation schemes表4 数据同化方案 |
| 编号 | 同化变量 | 模型初始参数 | 代价函数 |
|---|---|---|---|
| 第1组 | 无 | 无 | 无 |
| 第2组 | ET | RIRR1&RIRR2 | 趋势法 |
| 第3组 | LAI | TDWI&SPAN | 四维变分法 |
| 第4组 | ET&LAI | TDWI&SPAN&RIRR1&RIRR2 | 趋势&四维变分法 |
Tab. 5 The final values of optimization parameters表5 模型初始参数终值表 |
| 编号 | TDWI(kg/hm2) | SPAN(d) | RIRR1(mm) | RIRR2(mm) |
|---|---|---|---|---|
| 第1组 | 210 | 27 | 8.006 | 9.839 |
| 第2组 | 210 | 27 | 8.150 | 11.120 |
| 第3组 | 300 | 33 | 8.006 | 9.839 |
| 第4组 | 299.85 | 22 | 10.130 | 9.950 |
Fig. 6 The comparison chart of ET and LAI curves before and after data assimilation图6 数据同化前后对比图 |
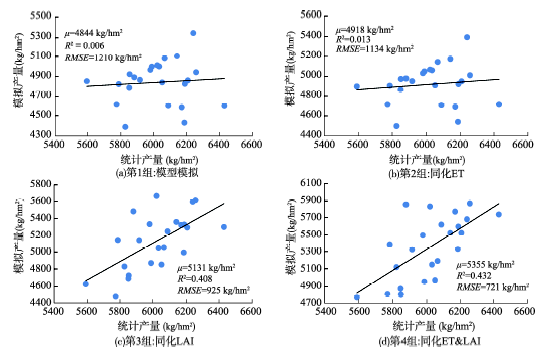
Fig. 7 Scatterplotsofwinterwheatyieldwithm2ssimilation图7 冬小麦产量散点图 |
Tab. 6 The statistical table of winter wheat yield (kg/hm2)表6 冬小麦产量统计表(kg/hm2) |
| — | 均值(μ) | 最大值(max) | 最小值(min) | 决定系数(R2) | 均方根误差(RMSE) |
|---|---|---|---|---|---|
| 统计产量 | 6022 | 6428 | 5592 | — | — |
| 第1组 | 4844 | 5343 | 4392 | 0.006 | 1210 |
| 第2组 | 4918 | 5392 | 4498 | 0.013 | 1134 |
| 第3组 | 5131 | 5669 | 4478 | 0.408 | 925 |
| 第4组 | 5355 | 5863 | 4769 | 0.432 | 721 |
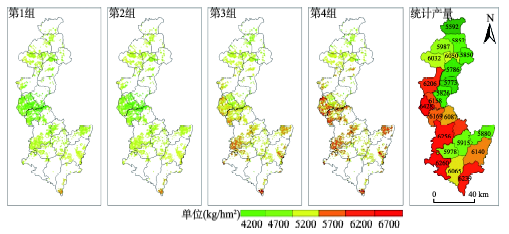
Fig. 8 Spatial distribution of winter wheat yield图8 冬小麦产量分布图 |
The authors have declared that no competing interests exist.
| [1] |
|
| [2] |
|
| [3] |
|
| [4] |
|
| [5] |
|
| [6] |
|
| [7] |
|
| [8] |
|
| [9] |
|
| [10] |
|
| [11] |
|
| [12] |
|
| [13] |
|
| [14] |
|
| [15] |
|
| [16] |
|
| [17] |
|
| [18] |
|
| [19] |
|
| [20] |
|
| [21] |
|
| [22] |
|
| [23] |
|
| [24] |
|
| [25] |
|
| [26] |
|
| [27] |
|
| [28] |
|
| [29] |
|
/
| 〈 |
|
〉 |