
Journal of Geo-information Science >
Analysis of Spatial-Temporal Change of NDVI and Its Climatic Driving Factors in Beijing-Tianjin-Hebei Metropolis Circle from 2001 to 2013
Received date: 2014-09-22
Request revised date: 2014-12-12
Online published: 2015-08-05
Copyright
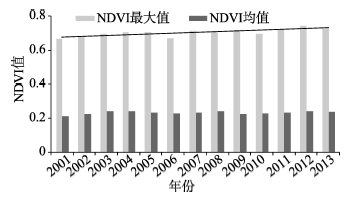
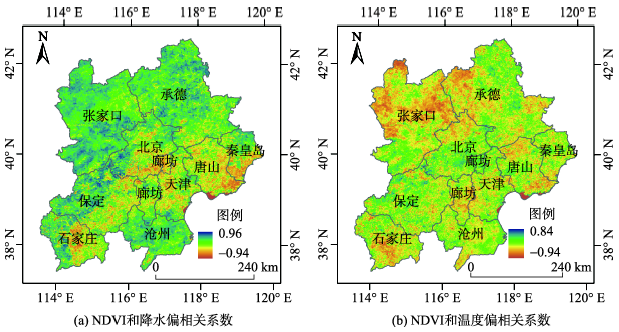
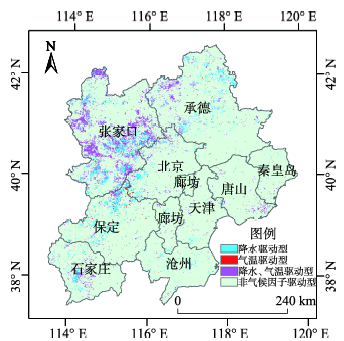
Vegetation dynamics and their coupled relations with climate are current research hot spots in exploring how terrestrial ecosystems respond to climate systems. Beijing-Tianjin-Hebei Metropolis Circle, one of the three major economic circles located in the eastern part of China, has been experiencing a rapid development as well as a severe change in eco-environment. The analysis of NDVI’s (Normalized Difference Vegetation Index) spatial-temporal dynamics and the exploration of relevant key climatic driving factors have special significance in the research of ecological environment change in Beijing-Tianjin-Hebei Metropolis Circle. In order to explore the vegetation dynamics and the impact of climate change on vegetation cover in Beijing-Tianjin-Hebei Metropolis Circle from 2001 to 2013, we adopted NDVI data of MOD13A3 to study the trend and spatial pattern of this region using linear regression, with the assistance of precipitation and average temperature data from the growing season. The climatic driving forces of vegetation cover change were discussed using partial correlation analysis and multiple correlation analysis. The results indicate that NDVI had increased gradually during this period, which showed a good development trend for the vegetation cover in this region. The average partial correlation coefficients between NDVI and precipitation, and between NDVI and average temperature are 0.20 and -0.14 respectively, which indicate that NDVI is positively correlated with precipitation and negatively correlated with the average temperature during the growing season at the annual variation level. Furthermore, the impact of precipitation on NDVI is greater than temperature. Analysis of the driving factors on vegetation change shows that about 89.63% of the study area was impacted by non-climatic driving factor, while 5.68% was driven by a combined climatic factor of both precipitation and temperature, and 4.51% and 0.18% was driven by precipitation and temperature separately. As a result, it is evident to conclude that the vegetation change in this region is mainly affected by human activities.
MENG Dan , LI Xiaojuan , GONG Huili , QU Yiting . Analysis of Spatial-Temporal Change of NDVI and Its Climatic Driving Factors in Beijing-Tianjin-Hebei Metropolis Circle from 2001 to 2013[J]. Journal of Geo-information Science, 2015 , 17(8) : 1001 -1007 . DOI: 10.3724/SP.J.1047.2015.01001
Fig. 1 The changes of NDVI in Beijing-Tianjin-Hebei Metropolis Circle from 2001 to 2013图1 2001-2013年间京津冀地区NDVI变化 |
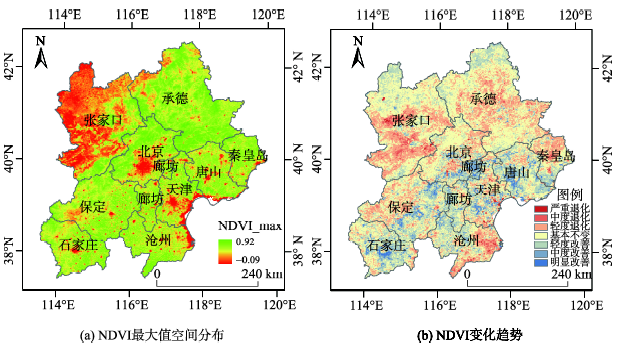
Fig. 2 Spatial distribution and change trend of the maximum NDVI in Beijing-Tianjin-Hebei Metropolis Circle from 2001 to 2013图2 2001-2013年间京津冀地区植被NDVI最大值空间分布及变化趋势图 |
Tab. 1 Change trend of NDVI in Beijing-Tianjin-Hebei Metropolis Circle from 2001 to 2013表1 2001-2013年间京津冀地区NDVI变化趋势 |
| NDVI变化趋势范围 | 变化程度 | 所占百分比(%) |
|---|---|---|
| -0.0763<θslope≤-0.0177 | 严重退化 | 1.03 |
| -0.0177<θslope≤-0.0103 | 中度退化 | 2.77 |
| -0.0103<θslope≤-0.0029 | 轻微退化 | 15.00 |
| -0.0029<θslope≤0.0045 | 基本不变 | 56.06 |
| 0.0045<θslope≤0.0119 | 轻微改善 | 20.57 |
| 0.0119<θslope≤0.0193 | 中度改善 | 4.06 |
| 0.0193<θslope≤0.0626 | 明显改善 | 0.52 |
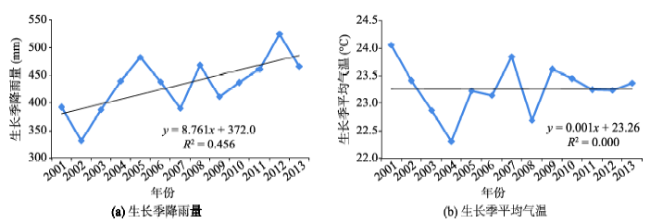
Fig. 3 Variations of the precipitation and average temperature in the growing season图3 基于气象监测站点的区域生长季降水及平均气温均值变化趋势图 |
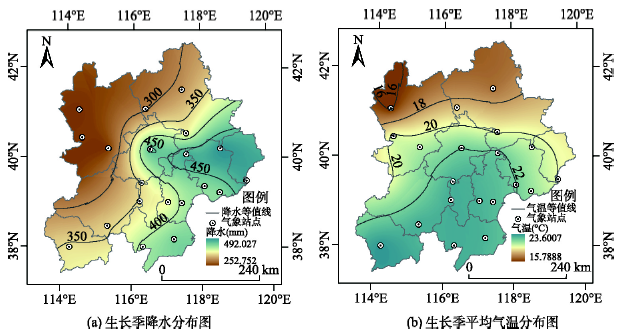
Fig. 4 Spatial distribution of precipitation and average temperature for Beijing-Tianjin-Hebei Metropolis Circle in the growing season图4 京津冀地区生长季降水与平均气温空间分布图 |
Fig. 5 The partial correlation coefficients between NDVI and precipitation, and between NDVI and average temperature in Beijing-Tianjin-Hebei Metropolis Circle图5 京津冀地区NDVI与降水及温度的偏相关系数 |
Tab. 2 The regionalization rules of the driving factors for vegetation change表2 植被覆盖驱动分区准则 |
| NDVI变化类型 | 分区准则 | ||
|---|---|---|---|
| rNDVI P,T | rNDVI T,P | RNDVI,T P | |
| 降水驱动型 | t ≥ t0.01 | F ≥ F0.01 | |
| 气温驱动型 | t ≥ t0.01 | F ≥ F0.01 | |
| 气温、降水驱动型 | t ≤ t0.01 | t ≤ t0.01 | F ≥ F0.01 |
| 非气候因子驱动型 | F ≤ F0.01 | ||
注:表中rNDVI P,T、rNDVI T,P分别为NDVI与降水、气温的偏相关系数,RNDVI,T P则表示NDVI与气温和降水的复相关系数,t和F分别为t、F检验的统计量值,t0.01和F0.01分别为t检验和F检验的0.01显著性水平 |
Fig. 6 Distribution map of vegetation change regions driven by climatic factors in Beijing-Tianjin-Hebei Metropolis Circle from 2001 to 2013图6 2001-2013年间京津冀地区植被覆盖变化气候因子驱动力分区图 |
The authors have declared that no competing interests exist.
| [1] |
|
| [2] |
|
| [3] |
|
| [4] |
|
| [5] |
|
| [6] |
|
| [7] |
|
| [8] |
|
| [9] |
|
| [10] |
|
| [11] |
|
| [12] |
|
| [13] |
|
| [14] |
|
| [15] |
|
| [16] |
|
| [17] |
|
| [18] |
|
| [19] |
|
| [20] |
|
| [21] |
吴良镛等. 京津冀地区城乡空间发展规划研究二期报告[M].北京:清华大学出版社,2006.
|
| [22] |
|
| [23] |
|
| [24] |
|
| [25] |
|
| [26] |
|
/
| 〈 |
|
〉 |