
Journal of Geo-information Science >
Monitoring and Analyzing Spatio-Temporal Changes of Heat Island Intensity in Beijing Main Urban Construction Area from 2005 to 2014
Received date: 2015-02-09
Request revised date: 2015-03-23
Online published: 2015-09-10
Copyright
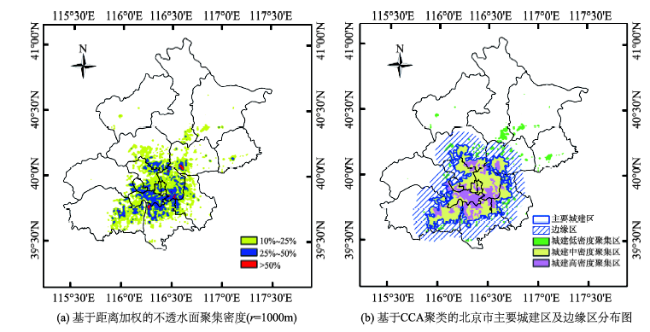
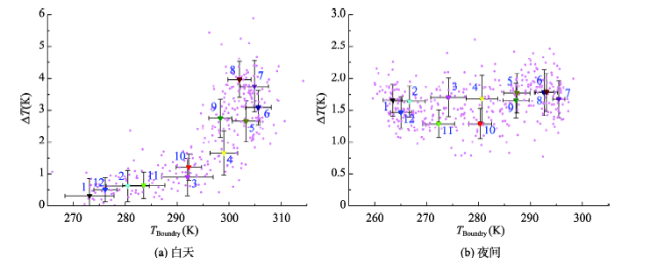
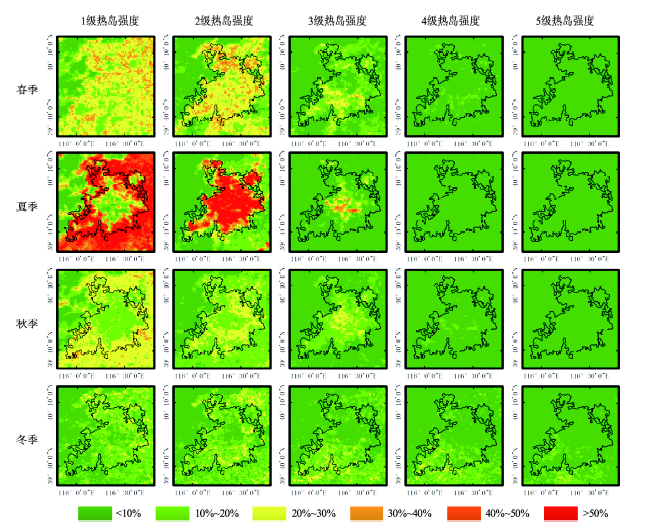
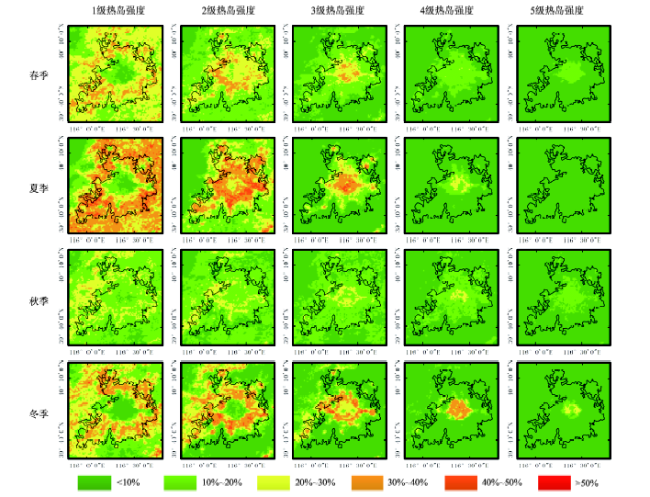
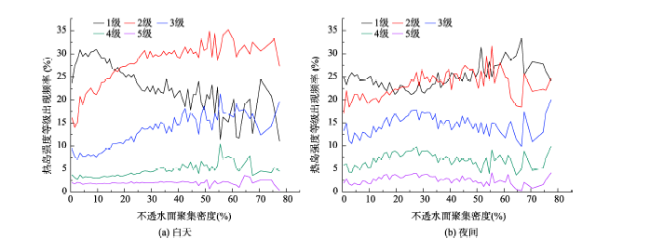
To study the urban heat island (UHI) effect of Beijing with long time series data, MODIS 8-day land surface temperature product from 2005 to 2014 is used to obtain the information about Beijing heat island, and LANDSAT-8 data on October 2, 2014 is used to get the distribution of Beijing imperious surface. The distance-weighted imperious surface cohesion density is calculated, Beijing’s main urban construction area is extracted based on city cluster algorithm, and a boundary is determined around the main urban construction area with an area of approximately 150% to the main urban construction area. We calculate the mean temperature difference between the main urban construction area and the boundary area, and regard it as UHI intensity. Then, we analyze the intra annual changes of UHI intensity, rank UHI intensity according to the land surface temperature and the month average of UHI intensity, perform statistical analysis on the frequency of UHI intensity level, and analyze the spatial distribution of UHI intensity level and its correlation with urban construction aggregate density. The results show that: (1) the dependency of UHI intensity on the boundary temperature showing a regulated pattern on the intra annual variations of UHI effect: counterclockwise distribution during the day and clockwise distribution at night; (2) in the daytime, the spatial distribution of UHI intensity level frequency appears to be level-2 and level-3, and the south-central high incidence area is featured by the level-3 heat island intensity during spring and summer; while at night, it has little correlation with construction cohesion density, but shows a cyclic characteristic increasing from the periphery to the center; (3) the imperious surface cohesion density make a notable effect on the frequency of different UHI level during the day with a positive correlation, while the effect tends to weaken when the imperious surface cohesion density is higher than 50%.
WANG Liang , MENG Qingyan , WU Jun , ZHANG Jiahui , ZHANG Linlin . Monitoring and Analyzing Spatio-Temporal Changes of Heat Island Intensity in Beijing Main Urban Construction Area from 2005 to 2014[J]. Journal of Geo-information Science, 2015 , 17(9) : 1047 -1054 . DOI: 10.3724/SP.J.1047.2015.01047
Fig. 1 Impervious surface distribution in urban area of Beijing图1 北京市主要城建区不透水面分布 |
Tab. 1 Mean heat island intensity of Beijing from January to December表1 北京市1-12月平均热岛强度 |
| 月份 | ||||||||||||
|---|---|---|---|---|---|---|---|---|---|---|---|---|
| 1 | 2 | 3 | 4 | 5 | 6 | 7 | 8 | 9 | 10 | 11 | 12 | |
| 白天(K) | 0.31 | 0.62 | 0.90 | 1.65 | 2.66 | 3.08 | 3.75 | 3.97 | 2.75 | 1.21 | 0.64 | 0.50 |
| 夜间(K) | 1.66 | 1.64 | 1.70 | 1.68 | 1.77 | 1.78 | 1.68 | 1.78 | 1.66 | 1.29 | 1.29 | 1.47 |
Fig. 2 The mean UHI intensity versus the mean boundary temperature图2 平均热岛强度与平均边缘区温度分布 |
Tab. 2 Definition of heat island level表2 热岛强度等级定义 |
| 等级 | 定义 |
|---|---|
| 1级 | |
| 2级 | |
| 3级 | |
| 4级 | |
| 5级 |
Fig. 3 The frequencies of different heat island intensity level in the daytime图3 白天不同热岛强度等级出现的频率 |
Fig. 4 The frequencies of different heat island intensity level in the night图4 夜间不同热岛强度等级出现的频率 |
Fig. 5 Frequency of UHI intensity level and imperious cohesion density图5 热岛强度等级出现频率与不透水面聚集密度 |
The authors have declared that no competing interests exist.
| [1] |
|
| [2] |
|
| [3] |
|
| [4] |
|
| [5] |
|
| [6] |
|
| [7] |
|
| [8] |
|
| [9] |
|
| [10] |
|
| [11] |
|
| [12] |
|
| [13] |
|
| [14] |
|
| [15] |
|
| [16] |
|
| [17] |
|
| [18] |
|
/
| 〈 |
|
〉 |