
Journal of Geo-information Science >
Evaluating Atmospheric Pollution of Chemical Plant Based on Unmanned Aircraft Vehicle (UAV)
Received date: 2015-07-27
Request revised date: 2015-08-20
Online published: 2015-10-10
Copyright
Although atmospheric environment monitoring based UAV is a cutting-edge technology, it has become an important method for environmental protection departments. It is significant for protecting and emergency monitoring of sudden atmospheric pollution incidents. Qilu chemical industrial zone with high-risk region of contaminative chemical gas emission is took as the study area. In this paper, we combined the rotor UAV system (HY-1) that equipped with high resolution CCD and the pollution gas monitor with in-situ measurements for three pollution gases of NO, CO and SO2. The results of the three pollution gas concentration distributions at the heights of 150 m/200 m, 250 m, 350 m and the ground level showed that the pollution gases in the chemical industrial zone present a horizontal difference and vertical diffusion characteristics. Analyzing the horizontally and vertically abnormal values of pollution gas concentrations from UAV can be efficient in supporting pollution pre-investigation. This research is a practical application of UAV in atmospheric environment monitoring by environmental protection departments, which can provide a technical support for regular supervision of pollution gas emission in chemical industrial zones and related enterprises.
YANG Haijun , HUANG Yaohuan . Evaluating Atmospheric Pollution of Chemical Plant Based on Unmanned Aircraft Vehicle (UAV)[J]. Journal of Geo-information Science, 2015 , 17(10) : 1269 -1274 . DOI: 10.3724/SP.J.1047.2015.01269
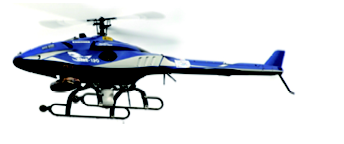
Fig. 1 HD400 unmanned helicopter图1 HD400无人直升机系统 |
Tab. 1 Parameter of three pollution gas using Mx6表1 3种污染气体Mx6技术参数表 |
| 气体种类 | CO | NO | SO2 |
|---|---|---|---|
| 测量范围(ppm) | 0~999 | 0~999 | 0~99.9 |
| 分辨率(ppm) | 1 | 1 | 0.1 |
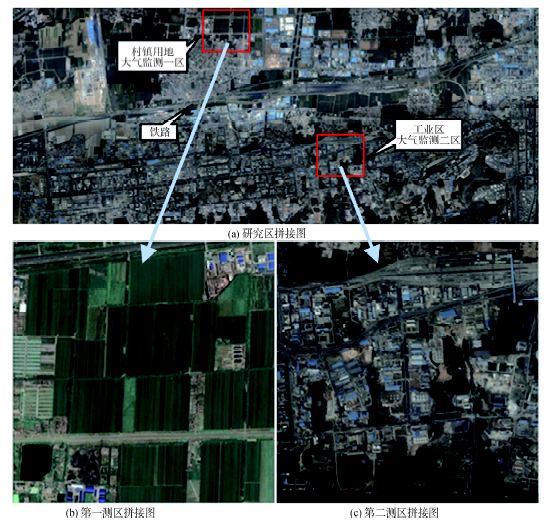
Fig. 2 Matching image of Unmanned Aircraft System (UAS) of the study area图2 飞行区域底图拼接结果 |
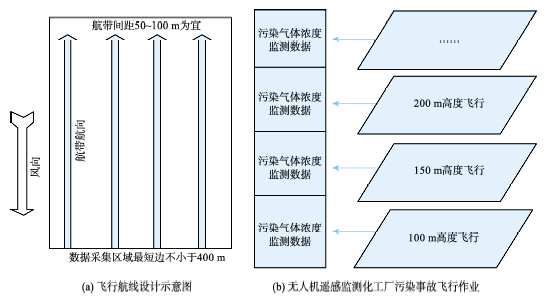
Fig. 3 Design of airline route and Unmanned Aircraft System (UAS) monitoring图3 航线设计和飞行作业方案 |
Tab. 2 Measurements of the first sample area表2 第一测区测量值统计 |
| 种类 | 高度(m) | 有效点位(个) | 最大值(ppm) | 最小值(ppm) |
|---|---|---|---|---|
| CO | 0 | 9 | 3 | 1 |
| 150 | 130 | 36 | 4 | |
| 250 | 130 | 39 | 2 | |
| NO | 0 | 9 | 12 | 10 |
| 150 | 130 | 11 | 7 | |
| 250 | 130 | 6 | 4 | |
| SO2 | 0 | 9 | 0.4 | 0 |
| 150 | 130 | 1.8 | 0.6 | |
| 250 | 130 | 4.2 | 0.3 |
Tab. 3 Measurements of the second sample area表3 第二测区测量值统计 |
| 种类 | 高度(m) | 有效点位(个) | 最大值(ppm) | 最小值(ppm) |
|---|---|---|---|---|
| CO | 0 | 9 | 4 | 3 |
| 200 | 143 | 196 | 0 | |
| 250 | 205 | 156 | 0 | |
| 350 | 131 | 803 | 3 | |
| NO | 0 | 9 | 1 | 0 |
| 200 | 143 | 4 | 0 | |
| 250 | 205 | 3 | 1 | |
| 350 | 131 | 21 | 4 | |
| SO2 | 0 | 9 | 0.3 | 0.2 |
| 200 | 143 | 6.5 | 0 | |
| 250 | 205 | 4.4 | 0 | |
| 350 | 131 | 15.7 | 0.6 |
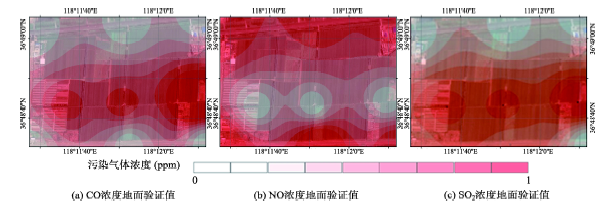
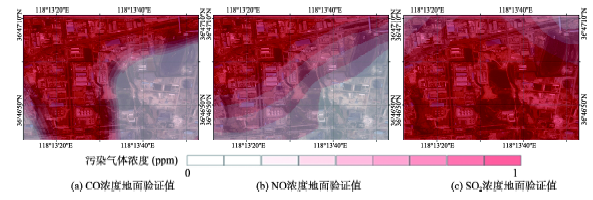
Fig. 4 In-situ measurement of CO, NO, SO2 concentrations of the first sample area图4 第一测区地面验证CO、NO、SO2浓度分布图 |
Fig. 5 In-situ measurement of CO, NO, SO2 concentrations of the second sample area图5 第二测区地面验证CO、NO、SO2浓度分布图 |
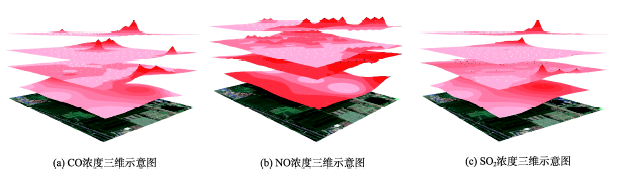
Fig. 6 Three-dimensional overlay of CO, NO, SO2 concentrations of the first sample area图6 第一测区150、250和350 m高度及地面验证CO、NO、SO2浓度三维叠加可视化图 |
Fig. 7 Three-dimensional overlay of CO, NO, SO2 concentrations of the second sample area图7 第二测区150、250和350 m高度及地面验证CO、NO、SO2浓度三维叠加可视化图 |
The authors have declared that no competing interests exist.
| [1] |
|
| [2] |
|
| [3] |
|
| [4] |
|
| [5] |
|
| [6] |
|
| [7] |
|
| [8] |
|
| [9] |
|
| [10] |
|
| [11] |
|
| [12] |
|
/
| 〈 |
|
〉 |
