
Journal of Geo-information Science >
Reliability Analysis and Assessment of Sub-Pixel Mapping: A Case Study with Landsat-5Image and HJ-1A Image Based on VBSPM
Received date: 2014-12-08
Request revised date: 2015-02-27
Online published: 2015-10-10
Copyright
Some high-resolution land cover maps are not free or available for direct use due to its economic value, the impact of weather or its confidentiality. As a downscaling classification method, sub-pixel mapping (SPM) can produce classification data with spatial resolutions finer than the original input data. We aim to explore the consistency between SPM results and classification data extracted from high-resolution remote sensing images on their accuracy and spatial characteristics. Two experiments were performed: one is in Jinnan District, Tianjin City with Landsat-5 TM image, and the other is in Haidian District, Beijing City with HJ image. Results show that the overall absolute accuracies of SPM results produced by TM and HJ images are 84% and 82% respectively. The overall relative accuracies of Landsat-5 and HJ SPM results were 82% and 77% by taking high-resolution classifications as reference. Furthermore, the overall structures and proportions based on the results using the proposed method are similar with high-resolution classifications. Therefore, with the absence of high-resolution land cover map, results generated by SPM could provide an alternative for land cover data source.
Key words: remote sensing classification; sub-pixel mapping; adaptability; ALOS; Landsat TM
JIANG Yu , GE Yong , CHEN Yuehong , SONG Hairong , HU Jianlong . Reliability Analysis and Assessment of Sub-Pixel Mapping: A Case Study with Landsat-5Image and HJ-1A Image Based on VBSPM[J]. Journal of Geo-information Science, 2015 , 17(10) : 1215 -1223 . DOI: 10.3724/SP.J.1047.2015.01215
Tab. 2 Main parameters of the experiment data表2 实验数据的主要参数 |
| 影像 | 获取时间 | 空间分辨率(m) | 波段(mm) | 影像大小 |
|---|---|---|---|---|
| TM | 2009-10-17 | 30 | B1: 0.45~0.52 B2: 0.52~0.60 B3: 0.63~0.69 B4: 0.76~0.90 | 818×860 |
| ALOS | 2009-10-17 | 10 | B1: 0.42~0.50 B2: 0.52~0.60 B3: 0.61~0.69 B4: 0.76~0.89 | 2454×2580 |
| HJ | 2012-04-16 | 30 | B1: 0.43~0.52 B2: 0.52~0.60 B3: 0.63~0.69 B4: 0.76~0.90 | 999×937 |
| ZY | 2012-04-17 | 6 | B1: 0.45~0.52 B2: 0.52~0.59 B3: 0.63~0.69 B4: 0.77~0.89 | 4995×4685 |
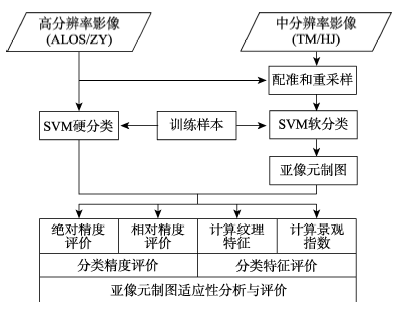
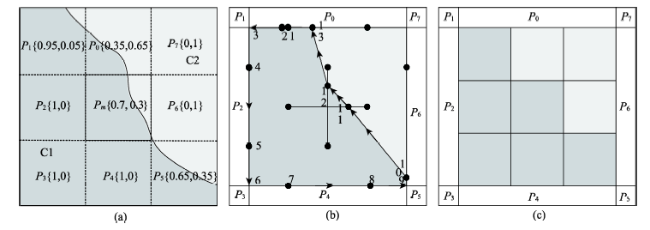
Fig. 1 Flow chart of the experiment图1 实验流程图 |
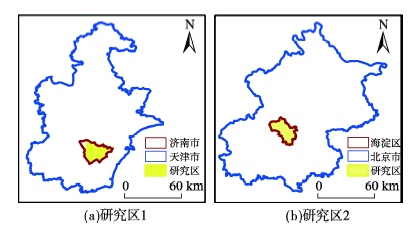
Fig. 3 Locations of the study area图3 实验区位置示意图 |
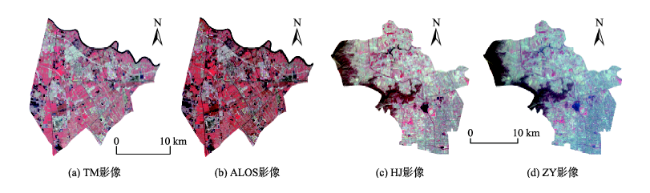
Fig. 4 Standard false color composite of the experiment images图4 实验影像的标准假彩色合成图像 |
Tab. 3 Jeffries-Matusita distance among the training samples of each class for from experiment images表3 实验影像中各类别训练样本之间的J-M距离 |
| 水体/建筑 | 水体/植被 | 水体/裸地 | 建筑/植被 | 建筑/裸地 | 植被/裸地 | ||
|---|---|---|---|---|---|---|---|
| 实验1 | TM | 1.922 | 1.991 | 2.000 | 1.945 | 1.993 | 1.861 |
| ALOS | 1.927 | 1.995 | 2.000 | 1.952 | 1.976 | 1.762 | |
| 实验2 | HJ | 1.995 | 1.986 | 2.000 | 1.993 | 1.952 | 2.000 |
| ZY | 1.963 | 2.000 | 2.000 | 1.998 | 1.901 | 2.000 |
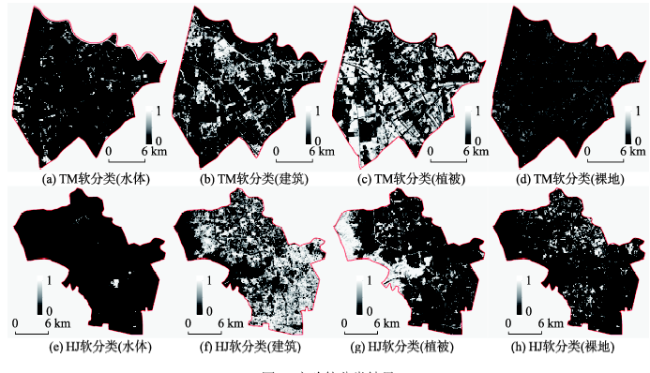
Fig. 5 Soft classification results of the experiments图5 实验软分类结果 |
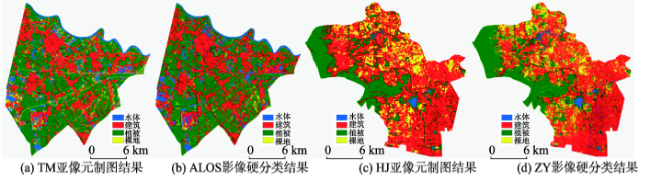
Fig. 6 Sub-pixel mapping results and hard classification maps图6 亚像元制图结果和硬分类结果 |
Tab. 4 Absolute accuracy assessment of sub-pixel mapping results and classification images表4 亚像元制图结果和硬分类结果的绝对精度评价结果 |
| 实验区 | 影像 | OA(%) | KP | 水体 | 建筑 | 植被 | 裸地 | |||||||
|---|---|---|---|---|---|---|---|---|---|---|---|---|---|---|
| PA(%) | UA(%) | PA(%) | UA(%) | PA(%) | UA(%) | PA(%) | UA(%) | |||||||
| 1 | ALOS | 85.67 | 0.774 | 80.00 | 87.61 | 87.62 | 83.61 | 91.85 | 92.19 | 42.86 | 45.00 | |||
| TM | 84.27 | 0.752 | 76.84 | 82.49 | 78.50 | 87.96 | 94.44 | 90.37 | 51.08 | 39.86 | ||||
| 2 | ZY | 86.60 | 0.779 | 96.23 | 80.95 | 86.81 | 91.11 | 88.86 | 93.93 | 78.52 | 59.34 | |||
| HJ | 82.11 | 0.691 | 39.62 | 70.00 | 87.08 | 83.75 | 87.47 | 82.04 | 51.73 | 73.20 | ||||
注:OA为总体精度;KP为Kappa系数;PA为生产者精度;UA为用户精度 |
Tab. 5 Relative accuracy assessment of sub-pixel mapping and hard classification results derived from low spatial resolution remote sensing images表5 中分辨率影像的亚像元制图结果和硬分类结果的相对精度评价结果 |
| 影像 | OA(%) | KP | 水体 | 建筑 | 植被 | 裸地 | |||||||
|---|---|---|---|---|---|---|---|---|---|---|---|---|---|
| PA(%) | UA(%) | PA(%) | UA(%) | PA(%) | UA(%) | PA(%) | UA(%) | ||||||
| TM_SPM | 82.40 | 0.724 | 79.26 | 81.82 | 78.80 | 89.16 | 91.92 | 89.27 | 33.68 | 23.39 | |||
| TM_hard | 82.09 | 0.718 | 78.87 | 81.05 | 78.56 | 88.71 | 91.73 | 88.80 | 32.16 | 23.01 | |||
| HJ_SPM | 76.67 | 0.604 | 31.75 | 88.04 | 82.69 | 77.25 | 85.60 | 77.14 | 42.57 | 70.36 | |||
| HJ_hard | 76.61 | 0.604 | 31.81 | 80.81 | 82.42 | 77.36 | 85.64 | 76.95 | 43.09 | 70.47 | |||
注:OA为总体精度;KP为Kappa系数;PA为生产者精度;UA为用户精度 |
Tab. 7 Statistics of spatial structure characteristics for each class in the classification results表7 分类结果中各类别地物的纹理特征统计 |
| 影像 | 类别 | 均一性 | 对比度 | 相异性 | 信息熵 | 二阶矩 | 相关性 | |
|---|---|---|---|---|---|---|---|---|
| 实验1 TM | 水体 | 0.98 | 71.48 | 1.13 | 0.05 | 0.97 | 0.97 | |
| 建筑 | 0.96 | 143.71 | 2.28 | 0.1 | 0.94 | 0.93 | ||
| 植被 | 0.96 | 143.71 | 2.28 | 0.1 | 0.94 | 0.93 | ||
| 裸地 | 0.96 | 150.15 | 2.38 | 0.1 | 0.94 | 0.92 | ||
| ALOS | 水体 | 0.97 | 108.59 | 1.72 | 0.07 | 0.95 | 0.94 | |
| 建筑 | 0.94 | 227.84 | 3.62 | 0.15 | 0.91 | 0.87 | ||
| 植被 | 0.94 | 242.39 | 3.85 | 0.16 | 0.9 | 0.86 | ||
| 裸地 | 0.95 | 187.61 | 2.98 | 0.13 | 0.93 | 0.86 | ||
| 实验2 HJ | 水体 | 0.99 | 11.28 | 0.18 | 0.00 | 0.99 | 0.00 | |
| 建筑 | 0.98 | 90.70 | 1.43 | 0.06 | 0.96 | 0.00 | ||
| 植被 | 0.98 | 68.44 | 1.09 | 0.04 | 0.97 | 0.00 | ||
| 裸地 | 0.97 | 106.49 | 1.69 | 0.07 | 0.96 | 0.00 | ||
| ALOS | 水体 | 0.99 | 5.61 | 0.09 | 0.00 | 0.99 | 0.00 | |
| 建筑 | 0.92 | 310.77 | 4.93 | 0.20 | 0.87 | 0.00 | ||
| 植被 | 0.94 | 215.96 | 3.43 | 0.14 | 0.91 | 0.00 | ||
| 裸地 | 0.97 | 113.92 | 1.81 | 0.08 | 0.95 | 0.00 | ||
4.2.2 格局特征评价 |
Tab. 8 Statistics of landscape pattern indexes for the classification results and for each class表8 分类结果及各类别地物的景观格局指数统计 |
| 水平 | 指数 | PD | LSI | COHESION | PLADJ | SHDI | SHEI | ||
|---|---|---|---|---|---|---|---|---|---|
| 实验1 | 景观 | TM | 39 | 58 | 100 | 80 | 1.17 | 0.84 | |
| ALOS | 142 | 101 | 100 | 83 | 1.14 | 0.82 | |||
| 类别 | TM | 水体 | 19 | 62 | 98 | 90 | - | - | |
| 建筑 | 17 | 63 | 100 | 95 | - | - | |||
| 植被 | 8 | 171 | 91 | 70 | - | - | |||
| 裸地 | 6 | 69 | 100 | 93 | - | - | |||
| ALOS | 水体 | 16 | 109 | 95 | 83 | - | - | ||
| 建筑 | 90 | 119 | 99 | 91 | - | - | |||
| 植被 | 5 | 292 | 74 | 38 | - | - | |||
| 裸地 | 22 | 135 | 100 | 88 | - | - | |||
| 实验2 | 景观 | HJ | 76 | 80 | 100 | 95 | 0.95 | 0.69 | |
| ALOS | 97 | 104 | 100 | 94 | 1.06 | 0.77 | |||
| 类别 | HJ | 水体 | 7 | 30 | 96 | 90 | - | - | |
| 建筑 | 22 | 103 | 100 | 96 | - | - | |||
| 植被 | 31 | 94 | 100 | 95 | - | - | |||
| 裸地 | 16 | 81 | 98 | 92 | - | - | |||
| ZY | 水体 | 6 | 49 | 95 | 89 | - | - | ||
| 建筑 | 18 | 128 | 100 | 95 | - | - | |||
| 植被 | 29 | 85 | 100 | 96 | - | - | |||
| 裸地 | 45 | 154 | 97 | 88 | - | - | |||
The authors have declared that no competing interests exist.
| [1] |
|
| [2] |
|
| [3] |
|
| [4] |
|
| [5] |
|
| [6] |
|
| [7] |
|
| [8] |
|
| [9] |
|
| [10] |
|
| [11] |
|
| [12] |
|
| [13] |
|
| [14] |
|
| [15] |
|
| [16] |
|
| [17] |
|
| [18] |
|
| [19] |
|
| [20] |
|
| [21] |
|
| [22] |
|
| [23] |
|
| [24] |
|
| [25] |
|
| [26] |
|
| [27] |
|
| [28] |
|
| [29] |
|
| [30] |
|
| [31] |
|
| [32] |
|
| [33] |
|
| [34] |
|
| [35] |
|
| [36] |
|
/
| 〈 |
|
〉 |