
Journal of Geo-information Science >
Relating Forest Phenology to Temperature and Precipitation in the Subtropical Region of Fujian Based on Time-Series MODIS-NDVI
Received date: 2014-11-13
Request revised date: 2015-03-26
Online published: 2015-10-10
Copyright
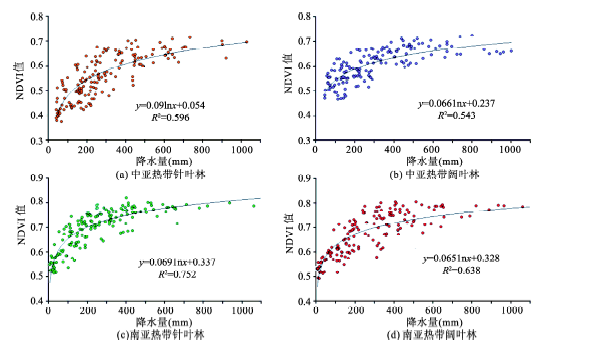
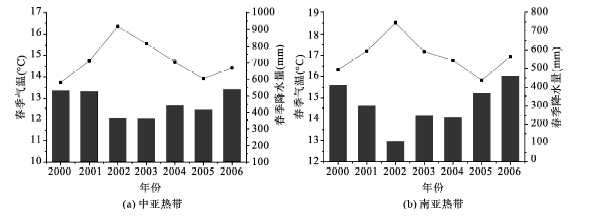
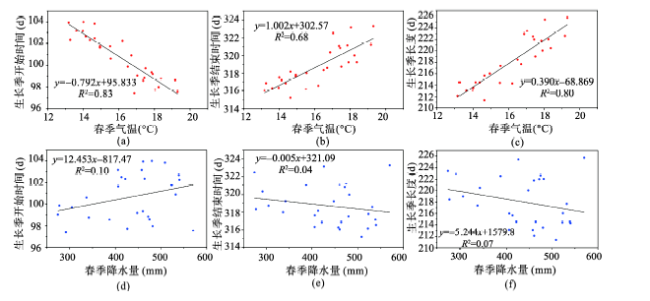
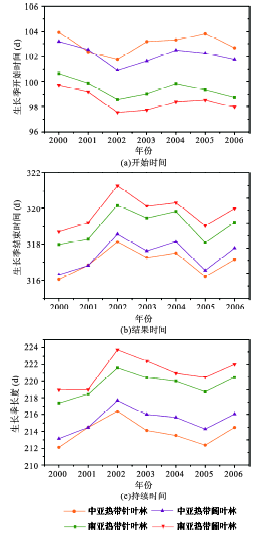
Vegetation phenology reflects the response of a terrestrial ecosystem to climate change. It is critical to quantitatively explore the relationships between vegetation dynamics and temperature as well as precipitation. We examined the vegetation-climate relationship using the monthly maximum values of normalized difference vegetation index (NDVI) derived from the Moderate Resolution Imaging Spectroradiometer (MODIS) between 2000 and 2006 in the subtropical region of Fujian. The dataset was also used to calculate phenoloical metrics including the start of season (SOS), the end of season (EOS) and the length of season (LOS) for each year using TIMESAT. The results indicates that the NDVI of each forest types were significantly positive correlated to the monthly mean temperature under no time-lag condition (R2=0.72-0.79, p<0.01). This suggests that the current temperature condition dominated over rainfall amount in affecting vegetation growth. There were significant log-linear relationships between NDVI and rainfall with a 2-month time-lag for each forest types (R2=0.54-0.75, p<0.01), implying that the vegetation growth does not respond immediately to rainfall but to the precedent cumulative rainfall. The phenoloical analysis showed that the SOS began from early to mid April (calendar day 98~103), the EOS appeared in mid-November (calendar day 316~321) and the LOS lasted 213~223 days. The LOS of southern subtropical forests was longer compared to the central subtropical forests; and the LOS of hardwood forests was longer than the conifer forests under similar climate regime. It is possible that the stability of hardwood forests was generally higher and the fluctuations of environmental factors did not limit the growth of hardwood forests compared to the conifer forests. The inter-annual varieties of SOS and LOS were significantly related to spring temperature (February-April), in which the higher spring temperature was related to the earlier SOS (R2=0.83, p<0.01) and consequently the longer LOS (R2=0.80, p<0.01). The trend analysis of LOS for four forest types revealed a significant weak increase between 2.4 days to 3.1 days during the study period.
XU Kaijian , ZENG Hongda , CHANG Chungte , XIE Jinsheng , YANG Yusheng . Relating Forest Phenology to Temperature and Precipitation in the Subtropical Region of Fujian Based on Time-Series MODIS-NDVI[J]. Journal of Geo-information Science, 2015 , 17(10) : 1249 -1259 . DOI: 10.3724/SP.J.1047.2015.01249
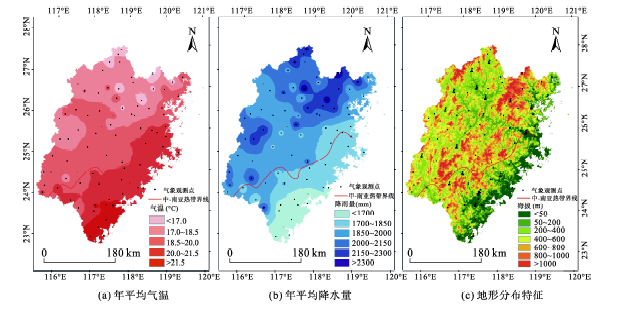
Fig. 1 Maps of annual mean temperature , mean annual precipitation and topography图1 研究区多年平均气温、平均年降水量及地形概况 |
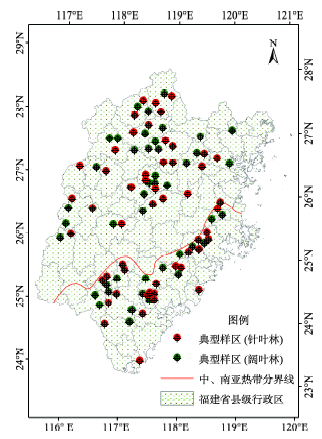
Fig. 2 The distribution of sampling sites图2 典型样区分布图 |
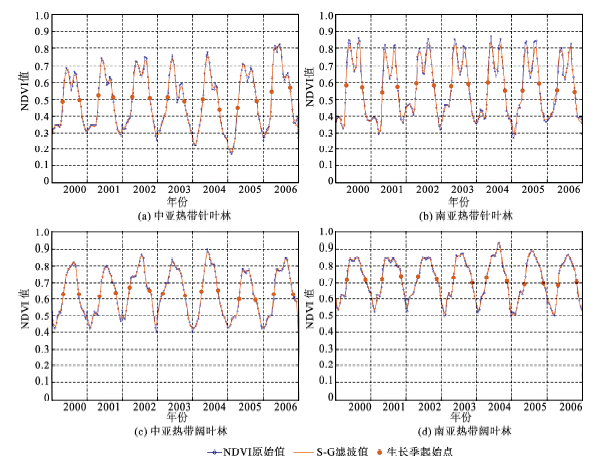
Fig. 3 The temporal dynamics of original NDVI values (blue lines) and fitting curves utilizing the Savitzky-Golay (gold lines) filter between 2000 and 2006图3 2000-2006年间福建省不同森林植被原始NDVI数据(蓝线)及S-G滤波拟合重建结果(金线) |
Tab. 1 The mean values of the start of growing season, the end of growing season and the length of growing season during 2000-2006 for four major vegetation types in Fujian Province表1 2000-2006年间福建省不同植被类型的平均生长季参数 |
| 不同植被类型 | 生长季开始(SOS) | 生长季结束(EOS) | 生长季长度(LOS)(d) | |||
|---|---|---|---|---|---|---|
| 累积日序 | 对应日期 | 累积日序 | 对应日期 | |||
| 中亚热带针叶林 | 103 | 4.13 | 316 | 11.12 | 213 | |
| 中亚热带阔叶林 | 102 | 4.12 | 317 | 11.13 | 215 | |
| 南亚热带针叶林 | 99 | 4.9 | 320 | 11.18 | 221 | |
| 南亚热带阔叶林 | 98 | 4.8 | 321 | 11.19 | 223 | |
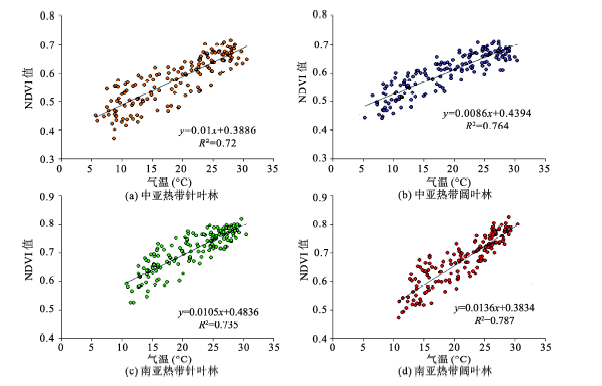
3.3.2 NDVI和气温、降水的相关性 |
Fig. 4 The linear relationships between monthly mean temperature and monthly mean NDVI across all study pixels of each vegetation type图4 月均气温与月NDVI值的线性拟合 |
Fig. 5 The log-linear relationships between monthly precipitation (with 2-month time lag) and monthly mean NDVI across all study pixels of each vegetation type图5 前2月降水量与月NDVI的对数拟合 |
Fig. 6 The spring (February-April) temperatures (squared dot) and precipitation (black bar) in the central subtropical and south subtropical regions of Fujian图6 福建省中亚热带与南亚热带地区春季(2-4月)气温(点图)与降水量(柱状图)多年变化图 |
Fig. 7 The relationships between spring (February-April) temperature and the relationships between the precipitation, and the start of growing season , end of growing season , and the length of growing season图7 春季(2-4月)气温、降水量与植物生长季开始时间、生长季结束时间和生长季长度的相关性 |
Fig. 8 The dynamics of the start of growing season, length of growing season and the end of growing season for each vegetation types between 2000 and 2006图8 2000-2006年各典型森林区生长季的开始时间、结束时间和持续时间动态 |
The authors have declared that no competing interests exist.
| [1] |
|
| [2] |
|
| [3] |
|
| [4] |
|
| [5] |
|
| [6] |
|
| [7] |
|
| [8] |
|
| [9] |
|
| [10] |
|
| [11] |
|
| [12] |
|
| [13] |
|
| [14] |
|
| [15] |
|
| [16] |
|
| [17] |
|
| [18] |
|
| [19] |
|
| [20] |
|
| [21] |
|
| [22] |
|
| [23] |
|
| [24] |
|
| [25] |
|
| [26] |
|
| [27] |
|
| [28] |
|
| [29] |
|
| [30] |
|
| [31] |
|
| [32] |
|
| [33] |
|
| [34] |
|
| [35] |
|
| [36] |
|
| [37] |
|
| [38] |
|
| [39] |
IPCC. Climate change 2007: The physical science basis[R]. Contribution of Working Group I to the IPCC Fourth Assessment Report, 2007:1-20.
|
/
| 〈 |
|
〉 |