
Journal of Geo-information Science >
Research on South America Surface Water Mapping
Received date: 2014-09-12
Request revised date: 2015-02-20
Online published: 2015-10-10
Copyright
As an important land cover type of Earth's surface, the surface water has a huge effect on the water cycle, climate change, environment and human activities. Thus, it is significant to analyze the distribution of the surface water and its change trend in time series. This study focuses on the use of the Automated Water Extraction Index (AWEI) to quantitatively evaluate the total surface water area in South America based on Landsat TM imagery and the MODIS digital product acquired in 2011. Meanwhile, the seasonal area fluctuation of the surface water in each typical climatic zone is monitored and the resultant data is used to analyze why the fluctuation occurred. The known data show that the total area of surface water in South America, mainly concentrated in the Amazon River basin, the Parana River basin and the Patagonia Plateau, is 305,000 km2 and the water rate is 1.69%. Based on our study, the number of lakes in South America is 9,579 while the total area is 142,000 km2, which takes 46.42% of the total area of surface water; the area of waterways is 157,000 km2, which takes 51.56% of the total area of surface water; and the reservoirs and ponds, which takes 2.01% of the total area surface water, is 6144.8 km2. From the perspective of climate zones, the area of surface water in the tropical zone of South America was influenced obviously by the change of rainy seasons, and within which the tropical desert climatic zone was the most affected one; in the temperate zone, the area of surface water didn’t change a lot because it has distinct seasons; in the plateau mountain climate zone, the area didn’t change a lot due to its unique climate feature; in both subtropical monsoon wet climate zone and Mediterranean climate zone, the surface water hardly changed with seasons but it exhibited obvious variations in winter and summer seasons. From the perspective of countries in South America, Brazil has the largest area of surface water (147,000 km2) which takes 48.17% of the total area of surface water in South America and its water rate was 1.72%; Argentina has the second largest area (34,000 km2) which takes 11.24% of the total surface water area and its water rate was 1.23%; while, Venezuela has the largest water rate (3.08%). The surface water in each typical climatic zone of South America has seasonal area fluctuation on several levels, which may relate to climate change and human activities. Further studies are needed to explain this issue in future.
Key words: surface water; remote sensing; water index; information extraction; area change
WANG Ming , SONG Kaishan , SHAO Tiantian , LU Dongmei , DU Jia , ZANG Shuying . Research on South America Surface Water Mapping[J]. Journal of Geo-information Science, 2015 , 17(10) : 1260 -1268 . DOI: 10.3724/SP.J.1047.2015.01260
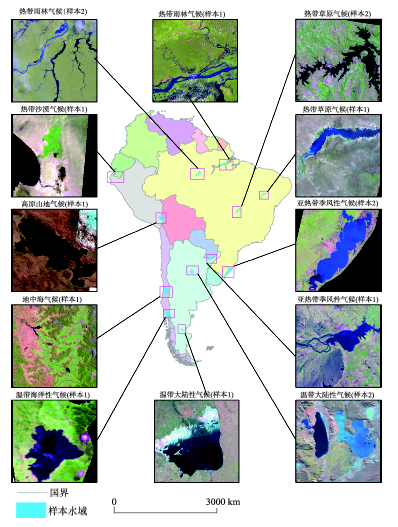
Fig. 1 The distribution of typical sub-regions for the investigation of seasonal variation of inland water areas图1 用于分析内陆水体季节性变化的典型区域空间分布 |
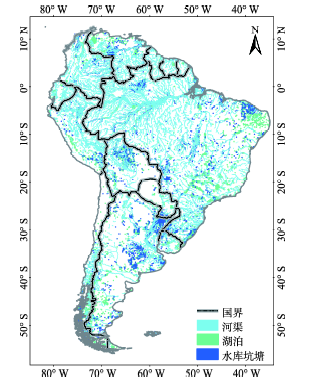
Fig. 2 The map of surface water distribution in South America图2 南美洲陆表水域空间分布图 |
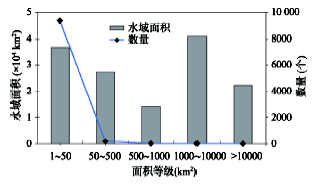
Fig. 3 Statistics of quantity and area for lakes at all levels from South America图3 南美洲各等级湖泊数量与面积统计图 |
Tab. 1 Statistics of surface water area for different countries in South America表1 南美洲各国陆表水域信息统计(水域面积前10位的国家) |
| 国家 | 水域面积(×104 km2) | 陆地面积(×104 km2) | 水域总面积比重(%) | 水域率(%) | 湖泊数量面积(km2) | 水库坑塘数量面积(km2) | 河渠面积(km2) |
|---|---|---|---|---|---|---|---|
| 巴西 | 14.7 | 851.5 | 48.2 | 1.72 | 3461(46 844.6) | 3244(2331.2) | 97 697.3 |
| 阿根廷 | 3.4 | 278.0 | 11.2 | 1.23 | 1871(24 545.5) | 1740(1252.7) | 8464.9 |
| 委内瑞拉 | 2.8 | 91.6 | 9.3 | 3.08 | 760(20 448.1) | 685(491.9) | 7277.3 |
| 秘鲁 | 1.7 | 128.5 | 5.5 | 1.32 | 448(7354.4) | 391(279.6) | 9284.4 |
| 玻利维亚 | 1.4 | 109.9 | 4.6 | 1.27 | 836(10 384.8) | 505(363.0) | 3168.4 |
| 哥伦比亚 | 1.3 | 114.2 | 4.3 | 1.16 | 630(3515.5) | 580(416.8) | 9322.0 |
| 智利 | 1.2 | 75.7 | 4.0 | 1.61 | 659(10 477.9) | 482(327.1) | 1412.5 |
| 乌拉圭 | 0.4 | 17.6 | 1.4 | 2.36 | 149(2443.3) | 199(142.1) | 1581.7 |
| 巴拉圭 | 0.3 | 40.7 | 0.8 | 0.63 | 218(1284.0) | 210(152.9) | 1113.6 |
| 苏里南 | 0.2 | 16.4 | 0.7 | 1.33 | 12(1486.3) | 9(6.9) | 680.9 |
Tab. 2 Statistics of surface water area for different typical sub-regions from various climate zones表2 各气候带内样本水域信息统计结果 |
| 气候类型 | 样本号 | 最大值(km2) | 最小值(km2) | 标准差(km2) | 平均值(km2) | 变异系数 |
|---|---|---|---|---|---|---|
| 热带雨林 | 样本1 | 2775.1 | 2656.2 | 50.2 | 2716.1 | 1.85 |
| 样本2 | 1106.6 | 1004.9 | 47.5 | 1075.7 | 4.41 | |
| 热带沙漠 | 样本1 | 220.7 | 90.2 | 64.1 | 165.7 | 38.68 |
| 热带草原 | 样本1 | 2569.4 | 2016.4 | 304.2 | 2366.1 | 12.86 |
| 样本2 | 1151.0 | 1027.3 | 42.4 | 1116.7 | 3.80 | |
| 温带大陆 | 样本1 | 5083.2 | 4278.2 | 360.2 | 4553.3 | 7.91 |
| 样本2 | 1194.6 | 1014.3 | 84.1 | 1094.5 | 7.69 | |
| 温带海洋 | 样本1 | 1613.1 | 1580.4 | 14.0 | 1593.5 | 0.88 |
| 亚热带季风性湿润气候 | 样本1 | 2608.9 | 2310.3 | 136.0 | 2426.2 | 5.60 |
| 样本2 | 10 970.5 | 10 926.7 | 22.6 | 10 946.4 | 0.21 | |
| 地中海气候 | 样本1 | 108.8 | 83.5 | 11.6 | 91.8 | 12.65 |
| 高原山地气候 | 样本1 | 7970.5 | 7789.7 | 75.5 | 7872.6 | 0.96 |
| 总计 | 10 970.5 | 83.5 | 101.0 | 3001.5 | 8.1 |
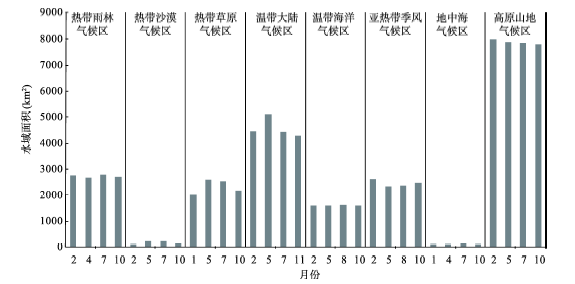
Fig. 4 Contrast of surface water area seasonal change in typical climate zones图4 南美洲各气候带典型水域季节性变化图 |
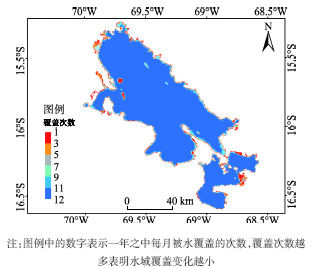
Fig. 5 The area change of the Lake Titicaca in 2011图5 2011年的的喀喀湖水域面积变化图 |
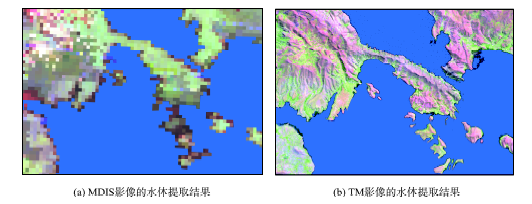
Fig. 7 Contrast of the extraction result of the Lake Titicaca based on TM image and MODIS image图7 基于MODIS影像与TM影像的的喀喀湖水体提取结果对比 |
The authors have declared that no competing interests exist.
| [1] |
|
| [2] |
|
| [3] |
阿热米罗·普罗科比奥.论南美洲水资源的管理与保护[J].拉丁美洲研究,2011,33(6):23-30.
|
| [4] |
|
| [5] |
|
| [6] |
|
| [7] |
|
| [8] |
|
| [9] |
|
| [10] |
|
| [11] |
|
| [12] |
|
| [13] |
|
| [14] |
|
| [15] |
|
| [16] |
|
| [17] |
|
| [18] |
|
| [19] |
|
| [20] |
|
| [21] |
|
| [22] |
|
| [23] |
|
/
| 〈 |
|
〉 |