
Journal of Geo-information Science >
Analysis of NDVI and the Impact of Human Activity in China from May to September During 1982 to 2006
Received date: 2015-03-24
Request revised date: 2015-09-06
Online published: 2015-11-10
Copyright
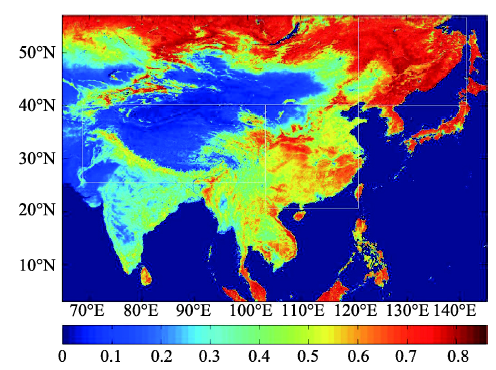
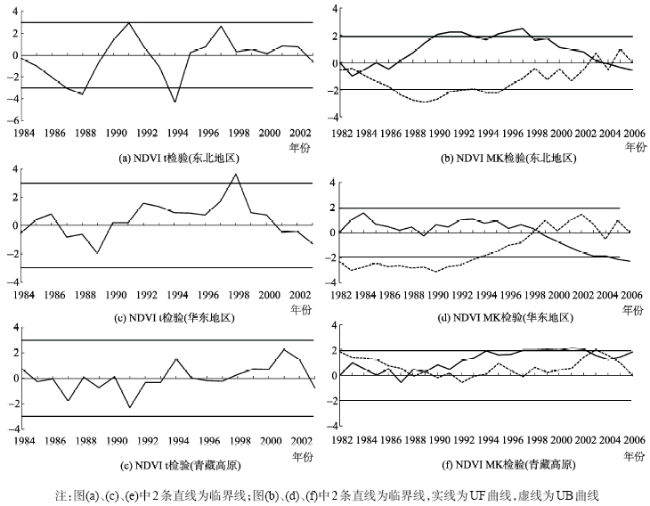
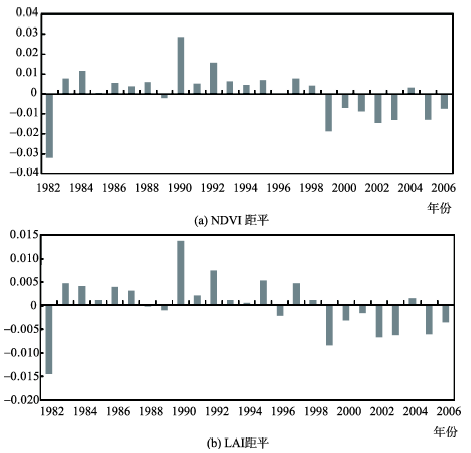
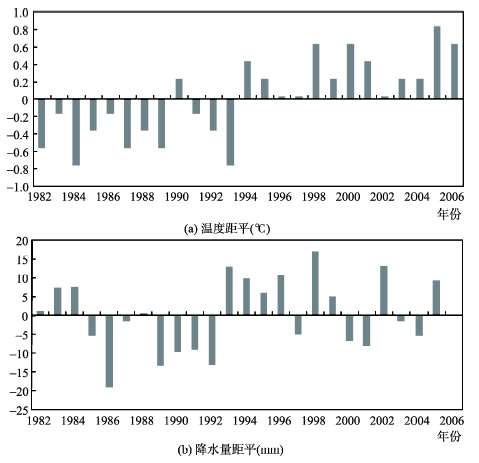
Vegetation is an important part of the terrestrial ecosystem, and it is the natural bond for linking land, atmosphere and ecosphere. Vegetation changes with climate and human activity, thus, studying its sudden and trend changes is an important subject. Using the methods of 3-year moving t-test, Mann-Kendall test (MK-test) and anomaly analysis, the sudden and trend changes of the normalized difference vegetation index (NDVI of AVHRR GIMMS) in China from May to September during 1982 to 2006, as well as their causes were analyzed. The t-test and MK-test results show that there was a sudden change of NDVI in the eastern China in 1998, and there couldn’t be a sudden change of NDVI in the northeast China and the Tibetan Plateau during 1982 to 2006. The changing trend of NDVI indicates that there was an increasing trend during 1982 to 1998, and then a decreasing trend from 1999 to 2006 in the eastern China. The causes of the sudden and trend changes of NDVI reveal that with the massive urbanization process in China that started in the late 1990s, the city and built-ups increased and the arable area decreased, and the NDVI indicated a sudden change with the vegetation decreased in the eastern China. Moreover, the satellite instruments and climate factors couldn’t be the main causes of the decreasing vegetation in the eastern China.
Key words: NDVI; sudden change; causes
WANG Yuanxiang , TANG Shihao , ZHENG Zhaojun . Analysis of NDVI and the Impact of Human Activity in China from May to September During 1982 to 2006[J]. Journal of Geo-information Science, 2015 , 17(11) : 1333 -1340 . DOI: 10.3724/SP.J.1047.2015.01333
Fig. 1 The climatic average of May-September NDVI in eastern Asia during 1982-2006图1 1982-2006年5-9月东亚地区NDVI的气候平均 |
Tab. 1 T test, MK test, anomaly and sudden change表1 T检验、MK 检验、距平变化及突变 |
| 区域 | 有无显著性差异 | 有无突变 | |
|---|---|---|---|
| 东北地区 | T检验 | 有(1988年,1994年) | 无 无 |
| MK检验 | 有(1984、2003和2004年) | ||
| 华东地区 | T检验 | 有(1998年) | 有 有 有 有 有 有 |
| MK检验 | 有(1998年) | ||
| NDVI距平变化 | 1982-1998年正距平1999-2006年负距平 | ||
| LAI距平变化 | 1982-1998年正距平1999-2006年负距平 | ||
| 青藏高原 | T检验 | 无 | 无 |
| MK检验 | 有(1988、1989、2002和2004年) | 无 |
Fig. 2 The time series of 3-year moving t-test (the two straight lines represent the threshold limit lines) and MK-test (the UF and UB curves are marked by the solid and dash curves, and the two straight lines are the threshold limit lines)图2 1982-2006年5-9月NDVI 3年滑动t检验和MK检验的时间序列 |
Fig. 3 The time series of the anomaly of NDVI and LAI in eastern China from May to September during 1982-2006图3 1982-2006年5-9月华东地区NDVI距平和LAI距平的时间序列 |
Fig. 4 The time series of temperature anomaly and precipitation anomaly in eastern China from May to September during 1982-2006图4 1982-2006年5-9月华东地区温度距平和降水量距平的时间序列 |
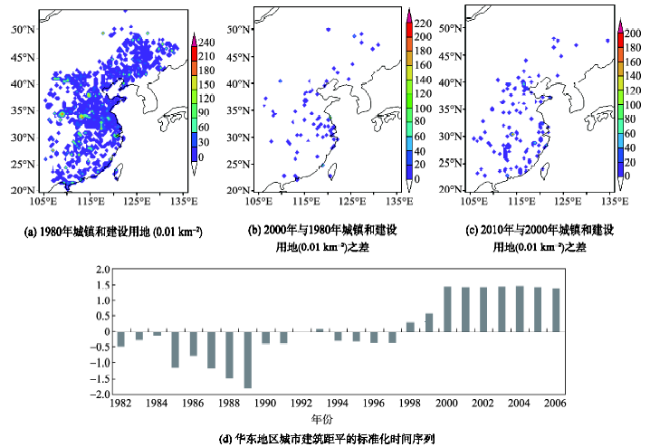
Fig. 5 The urban and built-up areas (0.01 km-2)图5 城镇和建设用地(0.01 km-2) |
The authors have declared that no competing interests exist.
| [1] |
|
| [2] |
|
| [3] |
|
| [4] |
|
| [5] |
|
| [6] |
|
| [7] |
|
| [8] |
|
| [9] |
|
| [10] |
|
| [11] |
|
| [12] |
|
| [13] |
|
| [14] |
|
| [15] |
|
| [16] |
|
| [17] |
|
| [18] |
|
| [19] |
|
| [20] |
|
| [21] |
|
| [22] |
|
/
| 〈 |
|
〉 |