
Journal of Geo-information Science >
Spatio-Temporal Variation of the Net Primary Production in Indian and Their Relationships to Climate Factors
Received date: 2015-05-04
Request revised date: 2015-06-01
Online published: 2015-11-10
Copyright
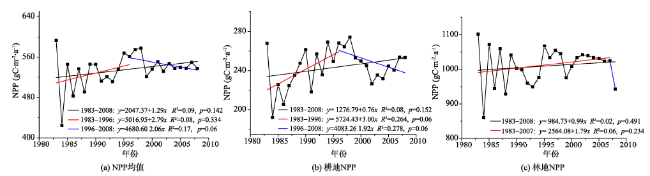
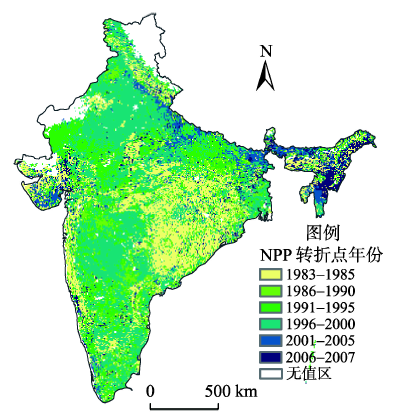
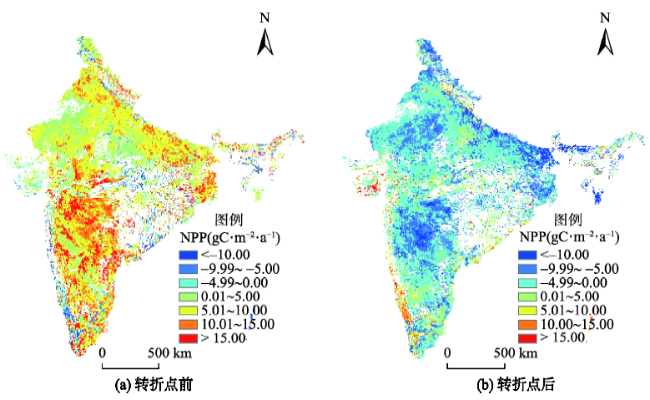
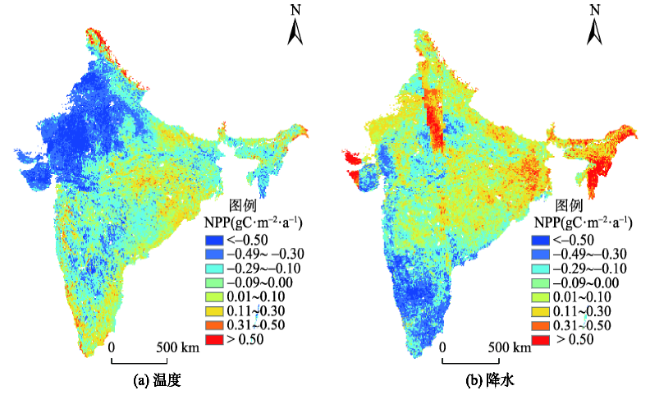
Net primary production (NPP) quantifies the net carbon contained by plants, which is of great importance to estimate the terrestrial carbon sink. Monitoring regional carbon storage in the form of NPP is, therefore, indispensable for improving the health state of the biosphere and system for carbon credit trading. In this study, the spatial and temporal patterns of NPP and their climatic controls in the ecosystems of India for the period of 1983-2008 were analyzed using a remote sensing based GLOPEM-CEVSA carbon model and piecewise regression methods. Results showed that the average annual NPP of the study area from 1983 to 2008 was 414.29 gC·m-2·a-1. The mean NPP of forest, cropland and grassland were 1002.32 gC·m-2·a-1, 485.98 gC·m-2·a-1, and 631.39 gC·m-2·a-1 respectively. At the national scale, a statistically insignificant positive trend of NPP was observed during 1983-2008. However, the increasing trend in NPP was not continuous throughout the 26-year period at the national scale. There were two distinct periods with opposite trends in NPP during 1983-2008. A significant turning point in 1996 was detected by the piecewise regression method. Firstly, NPP increased significantly from 1983 to 1996, while it then decreased from 1996 to 2008. The increase in NPP was primarily due to the enhancement of productivity over agricultural lands in the country. There are further spatial analyses supporting the concluded trend of average NPP. At the regional scale, the turning points appeared mostly in the 1991-2000 period. Savanna experienced the earliest trend of change. Climate had a strong impact on NPP during the period. The correlation coefficients indicated that the inter-annual variability in NPP was primarily driven by the precipitation and temperature variability. NPP in the northwest India was negatively correlated to temperature and positively correlated to precipitation. NPP in south Himalaya forest was positively correlated to temperature. NPP in southern region of India was negatively correlated to precipitation. These results are critical to understand the response of vegetation growth and carbon cycle to environmental change.
WANG Meng , LI Guicai , WANG Junbang , SUN Xiaofang , GUO Zhaodi . Spatio-Temporal Variation of the Net Primary Production in Indian and Their Relationships to Climate Factors[J]. Journal of Geo-information Science, 2015 , 17(11) : 1355 -1361 . DOI: 10.3724/SP.J.1047.2015.01355
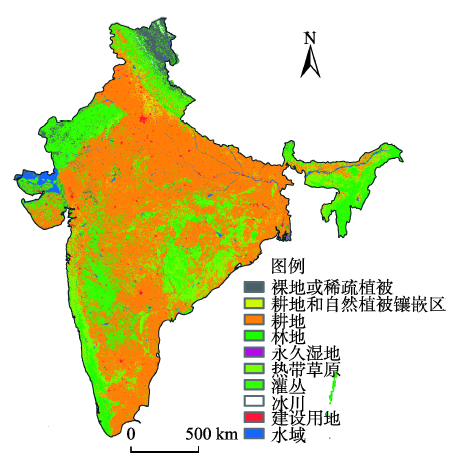
Fig. 1 The land cover map of the research area according to the MODIS land cover product MOD12Q1图1 研究区地表覆盖类型图(基于MODIS土地利用产品MCD12Q1) |
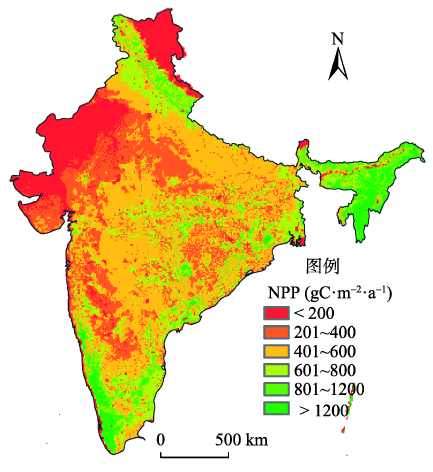
Fig. 2 Spatial distribution of average annual NPP in India from 1983 to 2008图2 1983-2008年间印度年均植被NPP分布 |
Tab. 1 Statistics of annual NPP over major land cover types in India表1 印度主要植被类型的面积及NPP统计值 |
| 地表覆盖类型 | 占总面积的比例(%) | 平均值(gC·m-2·a-1) | 贡献率(%) |
|---|---|---|---|
| 林地 | 10.4 | 1002.32 | 20.5 |
| 灌丛 | 12.9 | 245.51 | 6.2 |
| 耕地 | 54.1 | 485.98 | 51.5 |
| 热带草原 | 13.3 | 631.39 | 16.4 |
| 耕地和自然植被镶嵌区 | 2.6 | 619.26 | 3.2 |
Fig. 3 Inter-annual variations of NPP图3 研究区NPP的年际变化趋势 |
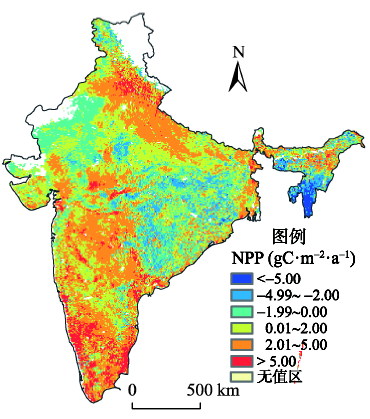
Fig. 4 The spatial pattern of NPP changing trend图4 NPP变化趋势的分布格局 |
Fig. 5 The spatial pattern of NPP turning point图5 研究区NPP转折点年份空间分布图 |
Fig. 6 The trend of NPP variation before and after the turnpoint图6 NPP转折点前、后变化趋势分布图 |
Fig. 7 The spatial distribution of correlation coefficient of NPP and temperature and precipitation图7 研究区NPP与温度和降水的相关系数 |
The authors have declared that no competing interests exist.
| [1] |
|
| [2] |
|
| [3] |
|
| [4] |
|
| [5] |
|
| [6] |
|
| [7] |
|
| [8] |
|
| [9] |
|
| [10] |
|
| [11] |
|
| [12] |
|
| [13] |
|
| [14] |
|
| [15] |
|
| [16] |
|
| [17] |
|
| [18] |
|
| [19] |
|
| [20] |
|
| [21] |
|
| [22] |
|
| [23] |
|
/
| 〈 |
|
〉 |