
Journal of Geo-information Science >
An Improved Population Spatialization Model by Combining Land Use Data and DMSP/OLS Data
Received date: 2015-01-09
Request revised date: 2015-03-14
Online published: 2015-11-10
Copyright
Population spatialization could effectively remove the obstacles for data fusion between census data and geographic data. With the rapid development of RS and GIS techniques, the research methods of population spatialization have been updated greatly, and among them, both land use data and DMSP/OLS data are the most widely used data sources for population spatialization. However, both of them have advantages and disadvantages, in specific, the patches of cities and rural settlements in land use data indicate the area of population distribution accurately, but land use data lacks detailed features of population distribution, especially for that existing in the same type of land use; DMSP/OLS data manifests the spatial variations of population density, however it often overestimates the distribution area of population due to its 'overglow' effect, and at the same time, the problem of pixel saturation in DMSP/OLS data also impairs the fitness of this data. In this paper, land use data and DMSP/OLS data are combined together to distinguish the night light data value of populated area, and the methodologies of population spatialization are improved by introducing the precision threshold and dynamic regionalization method. Census data in 2000, 2005 and 2010 for China’s coastal area are taken as examples to test the outcomes of the improved methodologies for population spatialization. The results show that: (1) due to the prominent spatial heterogeneity of population distribution in China’s coastal area, unitary model based on DMSP/OLS data for the whole study area exhibits very poor precision, therefore, land use maps are utilized to distinguish the populated and non-populated area based on DMSP/OLS images. Compared with the threshold method, land use maps more effectively removes the ‘overglow’ effect of DMSP/OLS data; (2) precision threshold of the regression model is adopted to dynamically divide the whole study area into several sub-regions, in specific, only counties that meet the testing accuracy defined by the precision threshold could retain in the regression model, otherwise, they should be regrouped into a new set of samples and be fitted by a new regression model. It is named as ‘dynamic regionalization’ method in this paper. The results show that this method further improves the overall accuracies of population spatialization data.
CHEN Qing , HOU Xiyong . An Improved Population Spatialization Model by Combining Land Use Data and DMSP/OLS Data[J]. Journal of Geo-information Science, 2015 , 17(11) : 1370 -1377 . DOI: 10.3724/SP.J.1047.2015.01370
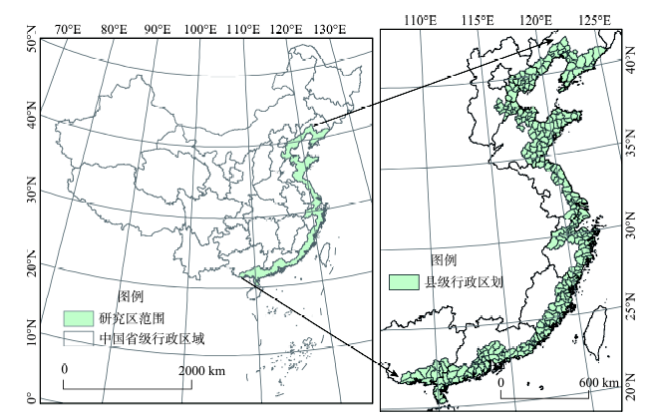
Fig. 1 Location of China’s coastal area图1 研究区位置与范围 |
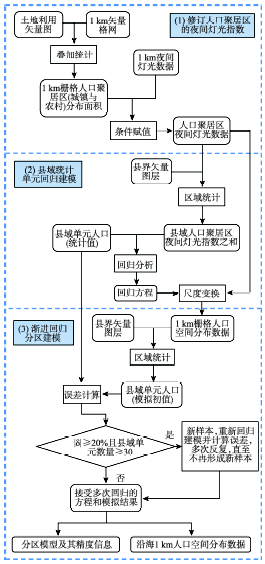
Fig. 2 Flowchart of population spatialization图2 人口空间化技术路线图 |
Tab. 1 Linear models and R2 for population spatialization表1 人口空间化线性回归模型及确定性系数 |
| 年份 | 建模区域 | 确定性系数(R2) | 回归系数(k) | 模型精度及动态分区情况 | ||
|---|---|---|---|---|---|---|
| │δ│< 20% | δ ≤-20% | δ ≥20% | ||||
| 2000 | 所有县级单元 | 0.906 | 97.753 | 保留结果 | A1 | C1 |
| A1 | 0.920 | 119.871 | 保留结果 | A2 | 不存在 | |
| A2 | 0.914 | 210.124 | 保留结果 | A3 | 不存在 | |
| A3 | 0.916 | 341.578 | 保留结果 | A4 | 不存在 | |
| A4 | 0.932 | 480.864 | 保留结果 | A5 | 不存在 | |
| A5 | 0.934 | 675.961 | 保留结果 | 样本少,保留结果 | 样本少,保留结果 | |
| C1 | 0.975 | 69.462 | 保留结果 | 不存在 | C2 | |
| C2 | 0.983 | 53.194 | 保留结果 | 不存在 | 样本少,保留结果 | |
| 2005 | 所有县级单元 | 0.847 | 85.079 | 保留结果 | A1 | C1 |
| A1 | 0.916 | 120.028 | 保留结果 | A11 | A12 | |
| A11 | 0.910 | 543.291 | 保留结果 | A13 | 不存在 | |
| A12 | 0.953 | 343.717 | 保留结果 | 不存在 | 不存在 | |
| A13 | 0.928 | 771.784 | 保留结果 | A14 | 不存在 | |
| A14 | 0.967 | 1112.758 | 保留结果 | 样本少,保留结果 | 不存在 | |
| C1 | 0.941 | 61.178 | 保留结果 | 不存在 | C2 | |
| C2 | 0.975 | 42.487 | 保留结果 | 不存在 | 样本少,保留结果 | |
| 2010 | 所有县级单元 | 0.829 | 75.130 | 保留结果 | A1 | C1 |
| A1 | 0.954 | 107.403 | 保留结果 | A2 | 不存在 | |
| A2 | 0.968 | 145.739 | 保留结果 | A3 | 不存在 | |
| A3 | 0.939 | 195.424 | 保留结果 | A4 | 不存在 | |
| A4 | 0.943 | 265.406 | 保留结果 | 样本少,保留结果 | 不存在 | |
| C1 | 0.917 | 50.343 | 保留结果 | 不存在 | C2 | |
| C2 | 0.973 | 37.562 | 保留结果 | 不存在 | C3 | |
| C3 | 0.990 | 33.162 | 保留结果 | 不存在 | 样本少,保留结果 | |
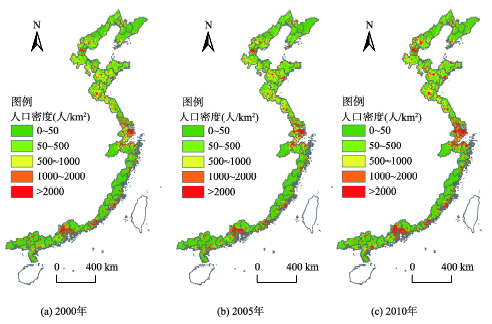
Fig. 3 Population spatialization map in China’s coastal area图3 中国大陆沿海人口空间化分布图 |
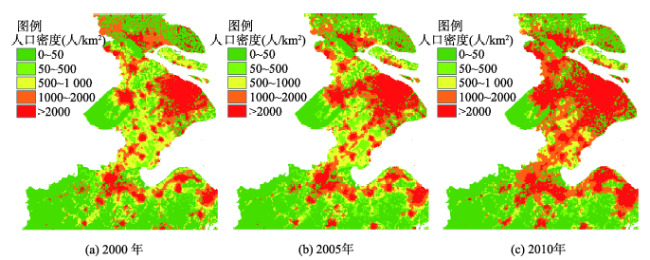
Fig. 4 Comparison of population spatialization maps for Yangtze River Delta in 2000, 2005 and 2010图4 2000、2005、2010年长江三角洲人口空间分布对比图 |
Tab. 2 Statistics for interval distribution of |δ|表2 模拟人口的|δ|分布区间统计表 |
| 年份 | 不同|δ|分布区间对应的县级行政单元(个数) | |δ|的 标准差 | |||
|---|---|---|---|---|---|
| 0-0.1 | 0.1-0.2 | 0.2-0.4 | > 0.4 | ||
| 2000 | 160 | 122 | 11 | 8 | 0.17 |
| 2005 | 165 | 111 | 16 | 9 | 0.15 |
| 2010 | 156 | 125 | 11 | 9 | 0.17 |
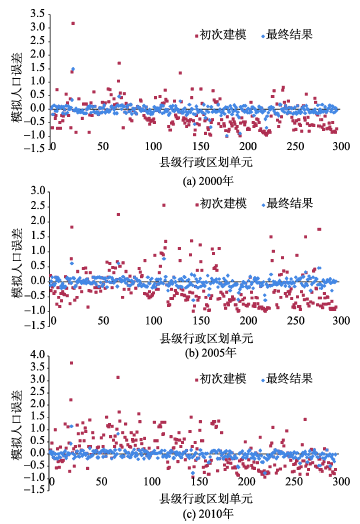
Fig. 5 Scatter plots of relative errors of modeled population in the research area图5 模拟人口相对误差的散点图 |
The authors have declared that no competing interests exist.
| [1] |
|
| [2] |
|
| [3] |
|
| [4] |
|
| [5] |
|
| [6] |
|
| [7] |
|
| [8] |
|
| [9] |
|
| [10] |
|
| [11] |
|
| [12] |
|
| [13] |
|
| [14] |
|
| [15] |
|
| [16] |
|
| [17] |
|
| [18] |
|
| [19] |
|
| [20] |
|
| [21] |
|
| [22] |
|
| [23] |
|
| [24] |
|
| [25] |
|
| [26] |
|
| [27] |
|
| [28] |
|
| [29] |
|
/
| 〈 |
|
〉 |