The Use of Generalized Additive Model in Association of Temperature and Cardiovascular Mortality in Anhui

  • YANG Xunfeng , 1, 2 ,
  • LI Lianfa , 1, * ,
  • WANG Jinfeng 1 ,
  • HUANG Jixia 3, 4
Expand
  • 1. State Key Laboratory of Resources and Environmental Information System, Institute of Geographic Sciences and Natural Resources Research, Chinese Academy of Sciences, Beijing 100101, China
  • 2. University of Chinese Academy of Sciences, Beijing 100049, China
  • 3. Precision Forestry Key Laboratory of Beijing, Beijing Forestry University, Beijing 100083, China
  • 4. College of Forestry, Beijing Forestry University, Beijing 100083, China
*Corresponding author: LI Lianfa, E-mail:

Received date: 2015-03-02

  Request revised date: 2015-04-24

  Online published: 2015-11-10

Copyright

《地球信息科学学报》编辑部 所有

Abstract

The objectives of this study were to estimate the effects of temperature on cardiovascular mortality in three cities of Anhui Province from 2008 to 2011, including Chaohu city, Yushan district of Ma’anshan city and Tianchang city. A separate Poisson generalized additive model (GAM) was fitted on a daily basis to explore the relationship between cardiovascular mortality and temperature for each city. The model used smooth functions to model the nonlinear effects of temperature and humidity on cardiovascular mortality, and to take control for the seasonal factor using the calendar time variable. A J-shaped relationship between cardiovascular mortality and temperature was observed for each city, indicating that an increasing trend at high or low temperature condition is associated with an increase in cardiovascular mortality. The threshold temperatures were 29.0°C, 26.6°C and 26.9°C for Chaohu city, Yushan district and Tianchang city, respectively. The percentage increase in cardiovascular mortality for Chaohu city, Yushan district and Tianchang city were 1.06% (95%CI: 0.39%-1.74%), 2.18% (95% CI: 1.56%~2.81%) and 0.89% (95% CI: -0.11%~1.90%) respectively, with a decrease of 1°C below the threshold temperature. And the percentage increase were 2.92% (95%CI: -2.19%~8.30%), 4.87% (95%CI: -0.11%~10.10%) and 2.06% (95%CI: -2.57%~6.91%) respectively, with an increase of 1°C above the threshold temperature. The effects of temperature on cardiovascular mortality are heterogeneous across cities, which suggest that preventive steps or public health programs should take regional differences into consideration.

Cite this article

YANG Xunfeng , LI Lianfa , WANG Jinfeng , HUANG Jixia . The Use of Generalized Additive Model in Association of Temperature and Cardiovascular Mortality in Anhui[J]. Journal of Geo-information Science, 2015 , 17(11) : 1388 -1394 . DOI: 10.3724/SP.J.1047.2015.01388

1 引言

心脑血管疾病是目前人类死亡的首要原因,全世界每年大约有1200万人死于心脑血管疾病,占总死亡人数的25%,中国每年也约有260万人死于心脑血管疾病,位居所有死亡病因的第一位[1]。心脑血管疾病死亡不仅与饮食习惯、缺乏运动等有关,也受气候因素的影响。随着全球气候的变暖,温度与心脑血管疾病死亡之间的关系受到了越来越多的关注[2]
欧洲、美国和澳大利亚等发达国家对温度和心脑血管疾病死亡之间的关系进行了研究[3-7],结果表明,温度与心脑血管疾病死亡之间的关系为非线性,高温和低温均会增加心脑血管疾病的发病和死亡风险,并且温度变化对心脑血管疾病死亡的影响存在明显的地域差异。Curriero等人在研究美国东部11个城市温度对死亡风险的影响中提出,低纬度地区的最适宜温度(即死亡风险最低时对应的温度)较高,并且低温对死亡风险的影响在低纬度地区比高纬度地区强,高温的影响在高纬度地区比低纬度地区强[4]。这主要与气候的分布有关,较低纬度地区夏季炎热,人群长期生活于温度较高的环境中,从生理和行为上适应了高温环境;而较高纬度地区冬季寒冷,该地区人群也由于长期生活于低温环境中而适应了低温[8]
近几年,国内也出现了一些关于温度与心脑血管疾病死亡之间关系的研究,包括南京[9]、武汉[10]、石家庄[2]、兰州[11]和长沙[12]。中国地域辽阔,各地的经济条件[4]、医疗设施、人口结构[5,12]存在较大的差异,因此,温度对心脑血管疾病死亡的影响也存在地域差异。另外,国内的研究多局限于单个城市,并且不同研究在不同地区所选用的模型、参数等不一致,容易出现研究结果之间的差异,因此,同时开展多个地区的研究非常必要。
安徽省位于中国东南部,地处暖温带与亚热带过渡地区,四季分明,冬冷夏热,且地处长江下游、淮河中游,经济上属中国中东部经济区,因此,对安徽省进行调查研究可为江淮流域地区心脑血管疾病的爆发,以及医疗预防和保护措施的及时性提供预警系统和科学依据。
本研究选用广义叠加模型研究温度对心脑血管疾病死亡的影响,即采用非参数拟合模型,并利用可叠加原理与平滑函数,在不用预先假设变量之间关系曲线的形状,对变量进行拟合[13],研究气候因子与死亡人数、死亡率之间的关系[4,11-14]。Curriero等[4]利用广义叠加模型研究了美国东部11个城市的温度与全体死亡人数、心脑血管血管疾病死亡人数之间的关系,结果表明,大多数城市的温度与心脑血管疾病死亡之间的关系为J-型。Huang等[12]利用广义叠加模型对长沙地区的研究显示,温度与心脑血管疾病死亡之间的关系为W-型;Kan等[14]和陈美池[11]分别对上海市和兰州市的研究表明,温度与心脑血管疾病死亡之间的关系为V-型。由上可见,温度与心脑血管疾病死亡之间的关系存在明显的地域差异。

2 研究区地理背景与病源数据

(1)研究区地理分布如图1所示。位于31°48′47″~32°57′50″N、117°25′40″~118°57′40″E范围内,地处暖温带与亚热带过渡地区,气候温暖湿润,夏季炎热、冬季寒冷。
(2)心脑血管疾病死亡数据和气候数据
本研究从中国疾病预防控制中心(Chinese Center for Disease Control and Prevention,CDC)的死因监测点系统(Death Surveillance Points System, DSP)收集2008年1月1日至2011年12月31日期间巢湖市、马鞍山市雨山区和天长市的居民死亡资料。该死因监测点系统建立于1978年,采用分层聚类随机抽样的方法选取具有代表性的区县进行监测,并采用标准联合国综合指数对其数据的完整性和准确性进行评价。其监测结果具有良好的完整性和准确性,并对全国城市和全国农村均具有良好的代表性[15-16]。收集的死亡资料包含死者性别、年龄、常住地址编码、根本死因、国际疾病伤害及死因分类标准(ICD-10)编码和死亡日期。本研究收集了研究区的心脑血管疾病死亡(ICD: I00-I99)人口资料,包括冠心病、脑血管病、周围血管病、心脏病等,并通过数据整理得到3个城市每日的心脑血管疾病死亡人数。
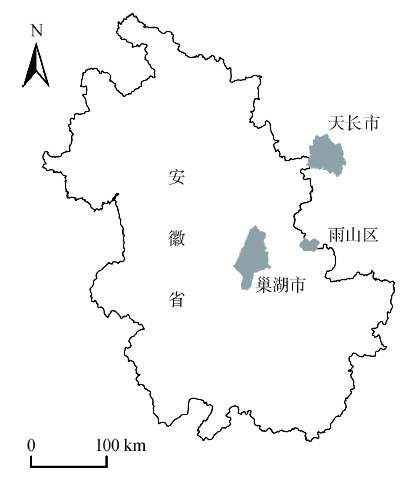
Fig. 1 Geographical distribution of the three cities in Anhui Province

图1 3个研究城市(区)的地理位置分布

同期的气象数据从中国气象科学数据共享服务网(http://cdc.nmic.cn/)提取,包括日均气温、日最高气温、日最低气温、日均相对湿度。本研究一共提取了安徽省和位于安徽省东边的江苏省内一共30个气象站点的数据。从图1可看出,雨山区和天长市位于安徽省东部边缘地区,因此提取安徽省东部的气象数据,以便更准确地计算雨山区和天长市的气象因子数据。然后,采用反距离权重(Inverse Distance Weighted,IDW)插值和分区统计(zonal statistics)方法计算各个城市的日均气温、日最高气温、日最低气温和日均相对湿度。IDW和分区统计方法均在ArcGIS10.1中实现。

3 温度对心脑血管疾病死亡影响的 广义叠加模型分析

以往研究表明,高温和低温均会增加心脑血管疾病死亡的风险。其中,低温的影响相对比较缓慢并且持续时间较长,并在滞后3天左右达到最大[17];高温对心脑血管疾病死亡的影响快速而且强烈,通常持续3~4 d[12,17]。因此,本文主要研究3日温度对心脑血管疾病死亡的影响。

3.1 温度与心脑血管疾病死亡之间的关系

(1)心脑血管疾病死亡与3日平均温度之间的暴露-反应曲线的模型分析
首先,用广义叠加模型探索每个城市的心脑血管疾病死亡的相对风险(Relative Risk,RR)与3日平均温度之间的暴露-反应曲线。广义叠加模型是一种非线性模型,可在不用预先假设变量之间关系曲线的形状,对变量进行拟合[13],因此,该模型常用于变量之间关系未知情况下探索变量之间的关系曲线,或者在模型中模拟变量之间的非线性关系。以往研究表明,温度、相对湿度等气象因子与心脑血管疾病死亡之间的关系为非线性[7,11-12,14],因此,本研究选用了广义叠加模型探索温度与心脑血管疾病死亡之间的暴露-反应曲线关系。
本研究共收集了3个温度指标(日最高温度、日平均温度和日最低温度),并以赤池信息量准则(Akaike’s Information Criterion,AIC)[18]为标准选取最合适的温度指标。AIC是衡量统计模型拟合优良性的一种标准,计算公式为:
AIC = 2 k - 2 ln ( L ) (1)
式中,k是参数的数量;L是似然函数。AIC方法寻找可最好地解释数据但包含最少自由参数的模型,所以优先考虑的模型对应AIC值最小的一个。本研究分别以日最高温度、日最低温度和日平均温度构建模型,并计算和比较其对应的AIC值。结果表明,以日平均温度作为温度指标构建的模型对应的AIC值最小,因此,本研究选用日平均温度作为模型中的温度指标用于衡量温度对心脑血管疾病死亡的影响。
(2)低温和高温分别对心脑血管疾病死亡的影响
通过拟合心脑血管疾病死亡与温度之间的暴露-反应曲线确定最适宜温度,即心脑血管疾病死亡风险最低时对应的温度。
① 通过观察心脑血管疾病死亡的暴露-反应曲线初步确定最适宜温度的范围;然后,在该范围内以0.1 °C为间距迭代计算以不同最适宜温度值构建模型的AIC值,选择最小AIC值对应的温度作为最适宜温度[7,12];
② 以最适宜温度为参照,分别计算各个地区的低温(温度低于最适宜温度)和高温(温度高于最适宜温度)对心脑血管疾病死亡的影响。另外,心脑血管疾病死亡存在明显的季节波动,而且还在一定程度上受相对湿度的影响,因此,在模型中采用平滑函数来控制季节波动和相对湿度的非线性影响。最终的Poisson广义叠加模型的形式为[19-20]
logE ( Y ) = β 0 + β 1 × T + β 2 ( T - ς ) + + s ( time , 7 × year ) + j = 1 p s ( x j , 3 ) + λ × DOW (2)
式中, ( T - ς ) + = m ax { T - ς , 0 } ; Y 表示心脑血管患者死亡人数;s()表示平滑函数,用于模拟变量之间的非线性关系; T 表示3日平均温度; ς 为最适宜温度,低于 ς 时为低温,高于 ς 时为高温;time表示日期变量,用于控制长期趋势(如人口变化、生活习惯变化、医疗设施的变化及季节性波动等[7,14])。参考以往相关研究[7, 12, 21]选择“7 × 研究年限”为日期变量time的自由度; x j 表示其他混杂因素(如相对湿度),这些混杂因子的自由度选择以AIC为标准,依次以3-10作为混杂因子的自由度分别构建模型,计算并比较以不同自由度为参数构建的模型的AIC值,选取AIC值最小的模型对应的自由度,最终选定3作为混杂因子变量的自由度;DOW(day of the week)代表观察日期为星期几的一个哑变量,用于控制星期几效应。
因此,当温度低于最适宜温度 ς 时(低温环境),模型为:
logE ( Y ) = β 0 + β 1 × T + s ( time , 7 × year ) + j = 1 p s ( x j , 3 ) + λ × DOW (3)
当温度高于最适宜温度 ς 时(高温环境),模型为:
logE ( Y ) = β 0 - β 2 ς + ( β 1 + β 2 ) × T + s ( time , 7 × year ) + j = 1 p s ( x j , 3 ) + λ × DOW (4)
③ 用心脑血管疾病死亡人数的百分比变化(percent change)来定量描述低温和高温对心脑血管疾病死亡的影响,即当温度低于最适宜温度 ς 时,温度每降低1 °C,心脑血管疾病死亡人数增加的百分比,或当温度高于最适宜温度 ς 时,温度每升高1 °C,心脑血管疾病死亡人数增加的百分比。计算公式为:
percent c h ange = ( exp ( β ) - 1 ) × 100 % (5)
当温度低于最适宜温度时, β 值等于式(2)中的 β 1 ;温度高于最适宜温度时, β 等于式(2)中的 β 1 + β 2
本研究采用R 3.0.1软件的“mgcv”包来构建广义叠加模型。

3.2 温度对心脑血管疾病死亡影响的结果分析

巢湖市、雨山区、天长市在2008-2011年间的心脑血管疾病日死亡人数和气象因素的基本情况见表1。其中,巢湖市和雨山区的纬度比天长市更低,日平均温度更高。巢湖市、雨山区、天长市在2008-2011年间的心脑血管疾病死亡人数分别为7386、1635、3897人,合计12 918人。
Tab. 1 Summary statistics for the three cities of Anhui during 2008-2011

表1 安徽省3个研究区域2008-2011年气象因素与居民心脑血管疾病日死亡人数基本情况

变量 地区 均值±标准差 四分位数(Q1 中位数 四分位数(Q3 最小值 最大值
逐日死亡人数(例)
巢湖市 5.1±2.6 3 5 7 0 18
雨山区 1.1±1.1 0 1 2 0 6
天长市 2.7±1.9 1 2 4 0 11
逐日平均温度(°C)
巢湖市 16.4±9.6 8.2 17.8 24.7 -4.4 33.6
雨山区 16.4±9.6 8.2 17.9 24.9 -4.4 34.2
天长市 15.8±9.6 7.4 17.3 24.3 -5.8 33.9
逐日相对湿度(%)
巢湖市 73.1±15.0 62.6 75.3 85.1 23.1 98.7
雨山区 72.2±14.1 62.5 73.9 83.2 21.4 97.6
天长市 69.9±14.0 60.2 71.7 80.8 22.8 96.0
(1)气温与心脑血管疾病死亡之间的暴露-反应关系曲线
图2展示了3个市(区)的心脑血管疾病死亡与温度之间的暴露-反应关系曲线,其中,横坐标表示3日平均温度,纵坐标表示心脑血管疾病死亡相对风险的对数。从图2可看出,安徽省城市地区的心脑血管疾病死亡与温度之间关系呈非线性,其暴露-反应曲线为J-型,即心脑血管疾病死亡的相对风险会在某个温度达到最低点,该温度称为最适宜温度或阈值温度,当温度高于该最适宜温度时,心脑血管疾病死亡的相对风险随着温度的升高而增加;温度低于该最适宜温度时,心脑血管疾病死亡的相对风险随着温度的降低而增加。但在不同地区,心脑血管疾病死亡和温度之间的暴露-反应关系曲线的具体形状不同。首先,3个城市的最适宜温度虽然都介于20~30 °C之间,但最适宜温度值却不同,巢湖市的最适宜温度要比雨山区和天长市的最适宜温度高。其次,在最适宜温度两侧,心脑血管疾病死亡风险随着温度变化的斜率不同,在最适宜温度左侧,雨山区的暴露-反应关系的斜率最大,其次是巢湖市,天长市的斜率最小;在最适宜温度右侧,巢湖市和雨山区的暴露-反应关系斜率比较明显,而天长市的暴露-反应关系曲线比较平缓。
(2)高温和低温分别对心脑血管疾病死亡影响的结果分析
表2为3个市(区)的最适宜温度,以及低温和高温分别对心脑血管疾病死亡影响结果。表2显示,3个市(区)的最适宜温度,以及低温和高温对心脑血管疾病死亡的影响程度均存在地域差异。最适宜温度分布在26.6~29.0 °C之间,且高温对心脑血管疾病死亡的影响比低温大。其中,马鞍山市雨山区是受低温和高温影响最大的地区,其次是巢湖市,天长市受低温影响最小。
(3)温度对老年人口心脑血管疾病死亡的影响
表2进一步研究了温度对老年人口(65岁以上人口)心脑血管疾病致死的结果。从表2可看出,老年人口的心脑血管疾病死亡的最适宜温度分布在26.7~29.0 °C之间,与全人群的最适宜温度基本一致。在巢湖市,温度(包括高温和低温)对老年人口的心脑血管疾病致死亡率更大,而在雨山区,温度(包括高温和低温)对全人群的心脑血管疾病致死亡率更大;在天长市,低温对老年人群的致死亡率更大,高温对全人群的致死亡率越大。

4 讨论

结果表明,温度与心脑血管疾病死亡之间呈非线性关系,为J-型,表明低温和高温均可增加心脑血管疾病死亡的风险,与之前国内外的研究结论一致[7,12,20]。3个城市的最适宜温度介于26.6~29.0 °C之间,Liu等对北京地区的研究发现,温度与心脑血管疾病死亡之间的关系为V-型,最适宜温度为21.3 °C,本研究结果与Curriero等提出的低纬度地区最适宜温度较高的结果一致。较低纬度地区夏季炎热时间较长,而且温度较高,人群受生理和行为适应性的影响,对高温的适应性较好。虽然同属江淮流域,但各城市的暴露-反应曲线的形状却不同(图2),且最适宜温度、低温对高温的影响程度也存在差异,可能反映了城市间社会经济水平、医疗卫生水平、人口结构特征,以及人群适应能力的差异。
图2表2可看出,低温对心脑血管疾病死亡产生影响的温度范围大,在最适宜温度左侧很大的低温范围都对心脑血管疾病死亡有影响,高温对心脑血管疾病死亡产生影响的温度范围较小,巢湖市、雨山区和天长市的低温影响范围分别为-4.4~29.0 °C、-4.4~26.6 °C和-5.8~26.9 °C,高温影响范围分别为29.0~33.6 °C、26.6~34.2 °C和26.9~33.9 °C。同时,从表2可看出,巢湖市、雨山区和天长市的低温影响心脑血管疾病死亡百分比变化分别为1.06%、2.18%和0.89%,高温影响心脑血管疾病死亡百分比变化分别为2.92%、4.87%和2.06%,3个市(区)中高温的影响程度要大于低温。近几十年的研究结果表明,中国自20世纪初以来,升温过程基本是确定的[22],约平均每10 a上升0.28 °C[23],而且继续呈现出上升趋势[2],对心脑血管疾病患者造成巨大的潜在危险,因此,研究温度对心脑血管疾病死亡的影响不仅要关注低温,同时也需研究高温对心脑血管疾病死亡的影响。
Tab. 2 Estimated thresholds of temperature, and the percentage change in cardiovascular mortality with 1°C increment of temperature above temperature threshold or with 1 °C decrement of temperature below temperature threshold

表2 安徽省3个市(区)的最适宜温度,以及温度每变化1 °C对应的心脑血管疾病死亡变化百分比

地区 最适宜温度(°C) 低温环境中心脑血管疾病死亡的百分比变化(%)(95% CI) 高温环境中心脑血管疾病死亡的百分比变化(%)(95%CI)
全部人口 巢湖市 29.0 1.06(0.39~1.74) 2.92(-2.19~8.30)
雨山区 26.6 2.18(1.56~2.81) 4.87(-0.11~10.10)
天长市 26.9 0.89(-0.11~1.90) 2.06(-2.57~6.91)
65岁以上人口 巢湖市 29.0 1.12(0.41~1.83) 3.41(-2.09~9.23)
雨山区 26.7 2.07(1.37~2.78) 3.57(-2.05~9.52)
天长市 26.9 0.82(0.23~1.87) 2.97(-1.99~8.18)
本研究对老年人口的研究结果显示,巢湖市、雨山区和天长市老年人口对应的最适宜温度,分别为29.0、26.7和26.9°C,与全体人口的29.0、26.6和26.9°C没有明显差异,温度对老年人口心脑血管疾病死亡的影响与对全体人群的影响比较相似,可能原因有:(1)研究地区的心脑血管疾病死亡人数中,老年人口占了绝大多数,高达85.67%,其中,巢湖市、雨山区、天长市的心脑血管疾病死亡人口中,老年人口分别占比为85.89%、82.75%、86.48%;(2)虽然老年人口的身体机能比较脆弱,通过自身调节适应温度变化的能力较差,但在极端气候环境下老年人口一般都待在室内,且有暖气或空调等设备对室内温度进行控制和调整,因此,受极端气温的影响较小,而年轻人却因为工作等原因经常在室外,直接暴露在极端高温或极端低温等环境中,因此更容易受到影响。
许多研究提出了一些假设,从人体机理的角度来解释高温和低温对心脑血管疾病患者的影响。在高温环境下,人体会通过自动扩大皮肤血管和出汗等办法来平衡人体的温度,也因此导致了人体生理变化(如血液黏度和心量排出的增加),这些生理变化进一步导致脱水、低血压、内皮细胞损伤等[20,24]。然而,人们对低温增加心脑血管患者死亡风险的机理了解较少[5,24],一般认为,当人体暴露在低温环境中时,交感神经系统会提高儿茶酚胺水平和皮肤血管的血流量来减少温度流失,因此,导致血管收缩、血压升高、血小板凝聚、血红细胞数量、血浆胆固醇、血浆纤维蛋白原等的增加[20,24]。Balloux等的研究发现,生活在温度较低地区的人群体内的线粒体的多样性低于生活在温度较高地区的人群[25],表明温度可能对人体线粒体DNA序列的形成有影响。线粒体在人体心脑血管系统的正常运作,以及心脑血管疾病的发展过程中扮演着重要角色[26],因此,全球气候变化也许会通过影响人体的线粒体DNA序列来影响心脑血管疾病。对于气候变化对遗传多样性的影响,未来还需更深入的研究。
同时,本研究中也存在一些局限性。以往有研究表明,空气污染物对人体健康也有影响,但由于本研究无法获取研究期间的空气污染物数据,因此没有加入污染物资料,有待今后进一步的研究完善。

The authors have declared that no competing interests exist.

[1]
孟淑萍,赵军峰,柳君,等.气象因素与心脑血管疾病研究现状分析[J].中国现代药物应用,2014,8(16): 234-235.心脑血管疾病是目前全球公认的危害人类健康的一大杀手,而气象条件也是诱发这类疾病的重要因素之一。尤其是在全球气候急剧变化的今天,温室效应、空气质量下降、雾霾等天气状况也在很大程度上影响着人们的身体健康状况,各种气象因素与心脑血管疾病之间有着怎样的联系也越来越多地被人们所关注。本文综述了自2000年以来国内相关方面的研究,总结我国不同地区在不同气象条件下,对心脑血管疾病的影响,并讨论了现有问题以及未来的研究方向。

[2]
宋慧丽,刘苏平,赵增毅,等.日最高气温与心脑血管疾病死亡的关系探讨[J].中国医药指南, 2013,11(6):73-75.目的探讨河北石家庄地区日最高气温与人群心脑血管疾病死亡的关系,找出高危因素,进行有效防治。方法收集2009年1月1日至2011年12月31日期间的心脑血管病例死亡报告卡,由河北气象台提供相应期间逐日平均气温,最低气温,平均气压,相对湿度,风速等6项气象要素,运用计算机进行各气象要素与心脑血管疾病死亡的单因素及相关因素的分析。结果气温,气压与死亡的关系显著,全年以夏季病死率最高,8月份是全年发病人数最多的月份。结论夏季日最高气温升高可能是心脑血管疾病死亡的一个危险因素,因此夏季积极治疗心脑血管病可降低病死率。

[3]
Braga A L F, Zanobetti A, Schwartz J. The effect of weather on respiratory and cardiovascular deaths in 12 U.S. cities[J]. Environmental Health Perspectives, 2002,110(9):859-863.We carried out time-series analyses in 12 U.S. cities to estimate both the acute effects and the lagged influence of weather on respiratory and cardiovascular disease (CVD) deaths. We fit generalized additive Poisson regressions for each city using nonparametric smooth functions to control for long time trend, season, and barometric pressure. We also controlled for day of the week. We estimated the effect and the lag structure of both temperature and humidity based on a distributed lag model. In cold cities, both high and low temperatures were associated with increased CVD deaths. In general, the effect of cold temperatures persisted for days, whereas the effect of high temperatures was restricted to the day of the death or the day before. For myocardial infarctions (MI), the effect of hot days was twice as large as the cold-day effect, whereas for all CVD deaths the hot-day effect was five times smaller than the cold-day effect. The effect of hot days included some harvesting, because we observed a deficit of deaths a few days later, which we did not observe for the cold-day effect. In hot cities, neither hot nor cold temperatures had much effect on CVD or pneumonia deaths. However, for MI and chronic obstructive pulmonary disease deaths, we observed lagged effects of hot temperatures (lags 4-6 and lags 3 and 4, respectively). We saw no clear pattern for the effect of humidity. In hierarchical models, greater variance of summer and winter temperature was associated with larger effects for hot and cold days, respectively, on respiratory deaths.

DOI PMID

[4]
Curriero F C, Heiner K S, Samet J M, et al.Temperature and mortality in 11 cities of the eastern United States[J]. American Journal of Epidemiology, 2002,155(1):80-87.Episodes of extremely hot or cold temperatures are associated with increased mortality. Time-series analyses show an association

PMID

[5]
Kysely J, Pokorna L, Kyncl J, et al.Excess cardiovascular mortality associated with cold spells in the Czech Republic[J]. BMC Public Health, 2009,9:19.Cold spells were defined as periods of days on which air temperature does not exceed -3.5°C. Days on which mortality was affected by epidemics of influenza/acute respiratory infections were identified and omitted from the analysis. Excess cardiovascular mortality was determined after the long-term changes and the seasonal cycle in mortality had been removed. Excess mortality during and after cold spells was examined in individual age groups and genders.Cold spells were associated with positive mean excess cardiovascular mortality in all age groups (25–59, 60–69, 70–79 and 80+ years) and in both men and women. The relative mortality effects were most pronounced and most direct in middle-aged men (25–59 years), which contrasts with majority of studies on cold-related mortality in other regions. The estimated excess mortality during the severe cold spells in January 1987 (+274 cardiovascular deaths) is comparable to that attributed to the most severe heat wave in this region in 1994.The results show that cold stress has a considerable impact on mortality in central Europe, representing a public health threat of an importance similar to heat waves. The elevated mortality risks in men aged 25–59 years may be related to occupational exposure of large numbers of men working outdoors in winter. Early warnings and preventive measures based on weather forecast and targeted on the susceptible parts of the population may help mitigate the effects of cold spells and save lives.Morbidity and mortality of a population are influenced by a large number of factors, one of them being meteorological conditions. In mid-latitudes, the most direct effects of weather on human health are observed during and after summer heat waves [1-8]. Cold-related mortality, although much less understood than heat-related mortality, is another example of the effects of weather on the human health. Increases in mortality with decreasing temperatures in winter have been reported in many regions, mainly in

DOI

[6]
Michelozzi P, Accetta G, Sario M E, et al.High temperature and hospitalizations for cardiovascular and respiratory causes in 12 European cities[J]. American Journal of Respiratory and Critical Care Medicine, 2009,179:383-389.Abstract RATIONALE: Episode analyses of heat waves have documented a comparatively higher impact on mortality than on morbidity (hospital admissions) in European cities. The evidence from daily time series studies is scarce and inconsistent. OBJECTIVES: To evaluate the impact of high environmental temperatures on hospital admissions during April to September in 12 European cities participating in the Assessment and Prevention of Acute Health Effects of Weather Conditions in Europe (PHEWE) project. METHODS: For each city, time series analysis was used to model the relationship between maximum apparent temperature (lag 0-3 days) and daily hospital admissions for cardiovascular, cerebrovascular, and respiratory causes by age (all ages, 65-74 age group, and 75+ age group), and the city-specific estimates were pooled for two geographical groupings of cities. MEASUREMENTS AND MAIN RESULTS: For respiratory admissions, there was a positive association that was heterogeneous between cities. For a 1 degrees C increase in maximum apparent temperature above a threshold, respiratory admissions increased by +4.5% (95% confidence interval, 1.9-7.3) and +3.1% (95% confidence interval, 0.8-5.5) in the 75+ age group in Mediterranean and North-Continental cities, respectively. In contrast, the association between temperature and cardiovascular and cerebrovascular admissions tended to be negative and did not reach statistical significance. CONCLUSIONS: High temperatures have a specific impact on respiratory admissions, particularly in the elderly population, but the underlying mechanisms are poorly understood. Why high temperature increases cardiovascular mortality but not cardiovascular admissions is also unclear. The impact of extreme heat events on respiratory admissions is expected to increase in European cities as a result of global warming and progressive population aging.

DOI PMID

[7]
Yu W, Wu W, Mengersen K, et al.Time course of temperature effects on cardiovascular mortality in Brisbane, Australia[J]. Heart, 2011,97:1089-1093.Abstract OBJECTIVE: To quantify the lagged effects of mean temperature on deaths from cardiovascular diseases in Brisbane, Australia. DESIGN: Polynomial distributed lag models were used to assess the percentage increase in mortality up to 30 days associated with an increase (or decrease) of 1°C above (or below) the threshold temperature. SETTING: Brisbane, Australia. PATIENTS: 2264805 cardiovascular deaths registered between 1996 and 2004. MAIN OUTCOME MEASURES: Deaths from cardiovascular diseases. RESULTS: The results show a longer lagged effect in cold days and a shorter lagged effect in hot days. For the hot effect, a statistically significant association was observed only for lag 0-1 days. The percentage increase in mortality was found to be 3.7% (95% CI 0.4% to 7.1%) for people aged ≥65 years and 3.5% (95% CI 0.4% to 6.7%) for all ages associated with an increase of 1°C above the threshold temperature of 24°C. For the cold effect, a significant effect of temperature was found for 10-15 lag days. The percentage estimates for older people and all ages were 3.1% (95% CI 0.7% to 5.7%) and 2.8% (95% CI 0.5% to 5.1%), respectively, with a decrease of 1°C below the threshold temperature of 24°C. CONCLUSIONS: The lagged effects lasted longer for cold temperatures but were apparently shorter for hot temperatures. There was no substantial difference in the lag effect of temperature on mortality between all ages and those aged ≥65 years in Brisbane, Australia.

DOI PMID

[8]
Gosling S M, Lowe J A, McGregor G R, et al. Associations between elevated atmospheric temperature and human mortality: a critical review of the literature[J]. Climate Change, 2009,92:299-341.The effects of the anomalously warm European summer of 2003 highlighted the importance of understanding the relationship between elevated atmospheric temperature and human mortality. This review is an extension of the brief evidence examining this relationship provided in the IPCC ’s Assessment Reports. A comprehensive and critical review of the literature is presented, which highlights avenues for further research, and the respective merits and limitations of the methods used to analyse the relationships. In contrast to previous reviews that concentrate on the epidemiological evidence, this review acknowledges the inter-disciplinary nature of the topic and examines the evidence presented in epidemiological, environmental health, and climatological journals. As such, present temperature–mortality relationships are reviewed, followed by a discussion of how these are likely to change under climate change scenarios. The importance of uncertainty, and methods to include it in future work, are also considered.

DOI

[9]
郭琳芳,董蕙青,覃天信.南宁市居民心脑血管疾病与气象要素关系探讨[J].广西预防医学,2000,6(6):341-343.目的 探讨气象与人群心脑血管疾病发病的关系。方法 收集南宁市各医院1995年1月1日至1998年12月31日期间的心脑血管病例报告卡,由广西气象台提供相应期间逐日平均气温、最低气温、最高气温、平 均气压=相对湿度、降雨量和风速等7项气象要素,运用计算机进行各气象要素与心脑血管疾病的单因素以及相关因素的分析。结果 气温、气压与发病的关系显著,全年以春季发病率较高,但各季节发病差异不明显;3月份是全年发病人数最多的月份,老年人对气象要素的变化尤其敏感。结论 气象要素的突变可以导致心脑血管疾病的发生或加重,高温高湿、低压和天气突变是诱发心脑血管疾病发病的重要因素。

DOI

[10]
刘学恩,李群娜,赵宗群.气温及冷空气对武汉市心脑血管疾病死亡率的影响[J].中国公共卫生,2002,18(8):948-950.lt;b>目的</b> 探讨气温及冷空气对武汉市心脑血管疾病死亡人数和死亡率的影响,并为制订防治对策提供依据.<b>方法</b> 对武汉市1991~1998年(除去1995年)共1220例因心脑血管疾病死亡的病例进行分析.描述并分析心脑血管疾病死亡人数和死亡率与月平均气温和冷空气的关系.<b>结果</b> 心脑血管疾病(CVD)死亡率在冬天有一个主峰,7月份还有一个次峰.相关分析显示:夏季气温与CVD死亡率为正相关,中年组(G1:年龄45~65岁)相关系数无显着意义,老年组(G2:年龄≥65岁)有显着性意义(<i>P</i>&lt;0.05);其余三季气温和CVD死亡率呈负相关,中老年组均有显着性(<i>P</i>&lt;0.05).回归分析显示:夏季气温与CVD死亡率的回归方程老年组(G2)为,Y=0.86T-7.154(<i>P</i>&lt;0.05).其余三季气温与CVD死亡率的回归方程中年组(G1)为:Y=6.175-0.125T(<i>P</i>&lt;0.05);老年组(G2)为:Y=24.58-0.415T(<i>P</i>&lt;0.05).从冷空气与CVD死亡人数的月分布曲线可知武汉的冷空气对死亡率影响不大,冷空气与CVD死亡率的相关系数无显着性(<i>P</i>&gt;0.05).<b>结论</b> 气温与CVD死亡率在夏季呈正相关,在其余三季呈负相关.

DOI

[11]
陈美池,牛静萍,阮烨,等.兰州市日均气温与心血管疾病日入院人次的时间序列研究[J].环境与健康杂志,2014,31(5):391-394.目的 研究日均气温对心血管疾病日入院人次的影响.方法 收集兰州市城区4家综合性医院2004年1月1日至2007年12月31日心血管疾病患者入院资料和该地区同期气象因素及大气污染物(PM10、SO2、 NO2)的时间序列资料.选用时间序列分析的广义相加模型,在控制星期几效应及其他混杂因素的基础上,探讨日均气温对兰州市居民心血管疾病日人院人次的影 响.结果 当兰州市日均气温为10℃时,气温对居民心血管疾病日入院人次的影响最小.日均气温低于10℃时,每降低1℃滞后3d时因心血管疾病而发生入院治疗的超额 危险度最大,为2.55%(RR 95%CI:0.955 2~0.993 8);日均气温高于10℃时,每升高1℃时当天因心血管疾病而发生入院治疗的超额危险度最大,为1.33%(RR 95%CI:1.007 0~1.019 6).结论 兰州市日均气温低于10℃时,居民心血管疾病日人院人次随着气温的降低而增加;当日均气温高于10℃时,日入院人次随着气温的升高而增加.

[12]
Huang J, Wang J, Yu W.The lag effects and vulnerabilities of temperature effects on cardiovascular disease mortality in a subtropical climate zone in China[J]. International Journal of Environmental Research and Public Health, 2014,11:3982-3994.ABSTRACT This research quantifies the lag effects and vulnerabilities of temperature effects on cardiovascular disease in Changsha-a subtropical climate zone of China. A Poisson regression model within a distributed lag nonlinear models framework was used to examine the lag effects

DOI PMID

[13]
Iñiguez C, Ballester F, Ferrandi J, et al.Relation between temperature and mortality in thirteen Spanish cities[J]. International Journal of Environmental Research and Public Health, 2010,7:3196-3210.In this study we examined the shape of the association between temperature and mortality in 13 Spanish cities representing a wide range of climatic and socio-demographic conditions. The temperature value linked with minimum mortality (MMT) and the slopes before and after the turning point (MMT) were calculated. Most cities showed a V-shaped temperature-mortality relationship. MMTs were generally higher in cities with warmer climates. Cold and heat effects also depended on climate: effects were greater in hotter cities but lesser in cities with higher variability. The effect of heat was greater than the effect of cold. The effect of cold and MMT was, in general, greater for cardio-respiratory mortality than for total mortality, while the effect of heat was, in general, greater among the elderly.

DOI PMID

[14]
Kan H D, Jia J, Chen B H.Temperature and daily mortality in Shanghai: a time-series study[J]. Biomedical and Environmental Sciences, 2003,16(2):133-139.INTRODUCTION Weather could modulate human health. It has been known for a long time that there is an association between episodes of extremely hot or cold temperature and mortality[1]. These studies showed that mortality tended to rise with increasingly

DOI PMID

[15]
Yang G, Hu J, Rao K Q, et al.Mortality registration and surveillance in China: History, current situation and challenges[J]. Population Health Metrics, 2005:3.Mortality statistics are key inputs for evidence based health policy at national level. Little is known of the empirical basis for mortality statistics in China which accounts for roughly one-fifth of the worlds population. An adequate description of the evolution of mortality registration in China and its current situation is important to evaluate the usability of the statistics derived from it for international epidemiology and health policy. The Chinese vital registration system currently covers 41 urban and 85 rural centres accounting for roughly 8 % of the national population. Quality of registration is better in urban than in rural areas and eastern than in western regions resulting in significant biases in the overall statistics. The Ministry of Health introduced the Disease Surveillance Point System in 1980 to generate cause specific mortality statistics from a nationally representative sample of sites. Currently the sample consists of 145 urban and rural sites covering populations from 30000 &acirc; 70000 and a total of about 1% of the national population. Causes of death are derived through a mix of medical certification and verbal autopsy procedures applied according to standard guidelines in all sites. Periodic evaluations for completeness of registration are conducted with subsequent corrections for under reporting of deaths. Results from the DSP have been used to inform health policy at national regional and global levels. There remains a need to critically validate the information on causes of death and a detailed validation exercise on these aspects is currently underway. In general such sample based mortality registration systems hold much promise as models for rapidly improving knowledge about levels and causes of mortality in other low-income populations. (authors)

DOI PMID

[16]
周脉耕,姜勇,黄正京,等.全国疾病监测点系统的调整与代表性评价[J].疾病监测,2010,25(3):239-244.lt;p><strong>目的</strong> 在原全国疾病监测点系统(disease surveillance points system,DSPs)基础上进行系统调整并评价其代表性。<br /><strong>方法</strong> 利用2000年人口普查资料和全国市县调查数据,对1989年调整后的全国疾病监测点系统的代表性进行评价,评价方法为分别对DSPs所有县(区)、城市部分、农村部分及东、中、西部城市农村部分的人均国内生产总值、非农业人口比重、15岁以上人口文盲率、0~14岁人口占整个人口的比例、&ge;65岁人口占整个人口的比例、死亡率、出生率等指标使用<em>u</em>检验与全国相应地区进行比较,并在评价结果的基础上进行系统调整。具体步骤为按照东、中、西部的经济指标和县(区)人口数,将全国所有县(区)分成54层,对照全国各层中县(区)的实际数,确定全国疾病监测点系统中相应各层的县(区)理论数,然后对目前监测系统各层中监测点的数量和分布进行调整。进而对调整之后的系统进行代表性评价。 <br /><strong>结果</strong> 全国、全国农村、全国城市,东、中、西部的城市,以及西部农村,与原全国疾病监测点系统中的相应地区之间均有一个或多个指标差异有统计学意义。调整后的全国疾病监测点系统共161个县(区),其中包含63个区和98个县(县级市)。对其进行代表性评价结果显示,DSPs中除城乡合计外,农村、城市,东、中、西部的城市、农村,与全国相应地区之间各类指标差异均无统计学意义。<br /><strong>结论</strong> 调整后的全国疾病监测点系统对全国城市和全国农村均具有良好的代表性,对全国合计的估计需要校正城市和农村的比例方可代表全国水平。</p>

DOI

[17]
曾韦霖,李春光,肖义泽,等.中国四城市温度对居民心脑血管疾病死亡影响的时间序列研究[J].中华流行病学杂志, 2012,33(10):1021-1025.目的 了解中国昆明、长沙、广州和珠海四城市温度在不同滞后日对心脑血管疾病(ICD-10:I00 ~ I99)死亡的影响.方法 收集四城市心脑血管疾病死亡与气象资料、大气污染物数据,利用分布滞后非线性模型研究不同城市温度与死亡关系,分析低温、中间温度、高温在不同滞后期对心 脑血管疾病死亡的累积效应,并用一般线性阈值模型评估温度对死亡的累积冷热效应.结果 四城市温度与死亡关系呈非线性,四城市居民最小死亡风险对应温度分别为长沙22.0℃、昆明20.0℃、广州26.0℃、珠海25.5℃;在研究滞后期间 内低温所致最大累积死亡风险值(95%CI)四城市分别为1.858(1.089~ 3.170)、1.537(1.306 ~ 1.809)、2.121(1.771 ~ 2.540)和1.934(1.469 ~ 2.548),高温分别为1.100(0.816 ~1.483)、1.061 (0.956~ 1.177)、1.134(1.047 ~ 1.230)和1.259(1.104 ~ 1.436).温度当天热效应大于冷效应,但随着滞后日增加,热效应迅速下降,而冷效应急剧上升,并持续至3~4周.结论 温度与心脑血管疾病死亡呈非线性关系.低温和高温均可增加心脑血管疾病的死亡风险,以低温的影响更显著.冷效应持续时间长,热效应短暂急促.

DOI

[18]
Akaike H.Information theory and an extension of the maximum likelihood principle[C]. Second International Symposium on Information Theory. Budapest, Hungary: Akademinai Kiado, 1973:267-281.

[19]
Chung J Y, Honda Y, Hong Y C, et al.Ambient temperature and mortality: An international study in four capital cites of East Asia[J]. Science of the Total Environment, 2009,408:390-396.

[20]
Kim H, Ha J-S, Park J.High temperature, heat index, and mortality in 6 major cities in South Korea[J]. Archives of Environmental &Occupational Health, 2006,61:265-270.The authors conducted a time-series analysis to estimate the acute effects of high temperature in 6 cities in Korea and to compare thresholds of temperature on daily mortality among the cities. They examined the association between total mortality and the daily mean temperature and heat index during the summers in Korea from 1994 to 2003. The threshold temperature was estimated to be between 27.0 degrees C and 29.7 degrees C for 4 cities. For a daily mean temperature increase of 1 degrees C above the thresholds in Seoul, Daegu, Incheon, and Gwangju, estimated percentage increases in daily mortality were 16.3 (95% confidence interval [CI] = 14.2-18.4), 9.10 (CI = 5.12-13.2), 7.01 (CI = 4.42-9.66), and 6.73 (CI = 2.47-11.2), respectively. These city-specific threshold temperatures and the magnitude of the effects of hot temperature indicate that any analysis of the impact of climate change should take into account regional differences.

DOI PMID

[21]
Samet J, Zeger S, Dominici F, et al.The national morbidity, mortality, and air pollution study. Part II: Morbidity and mortality from air pollution in the United States[R]. Boston, MA: Health Effects Institute, 2000.

[22]
孙朝阳,邵全琴,刘纪远.近40年来中国大陆地表气温变化估算[J].地球信息科学学报,2012,14(1):14-21.本文对近20年来中国地表气温变化估算方法进行了全面的总结,并对不同研究者所采用的资料、时间尺度及研究结果进行了对比分析。结合当前国际上应用较多的几种升温估算方法,本文以1970-2007年的气温数据为基础,分别应用直接算术平均法、逐站计算法、区域面积加权法、一级差分法和空间插值法,对中国大陆近40年的升温幅度分别进行了估算,从结果的对比分析中揭示中国地表气温变化估算中存在的不确定性:中国大陆地区近40年来的增温趋势在0.30~0.43℃/10a之间,升温幅度在1.16~1.56℃之间;冬季升温最为显著,夏季升温最少;整体上北方升温幅度高于南方。不同计算方法计算得到的增温速率在绝对值上有着一定差异,但整体趋势是相同的。

DOI

[23]
范泽孟,岳天祥,陈传法,等.中国气温与降水的时空变化趋势分析[J].地球信息科学学报,2011,13(4):526-533.如何对离散分布的气象台站观测数据进行高精度曲面模拟,为生态系统及服务功能时空变化趋势模拟及其综合评估提供高质量、高分辨率的空间气候数据,以满足栅格层次上的生态系统过程模型、生态系统格局模型及生态系统综合评估模型的参数需求,一直是存于生态学界的难点问题。在对全国1964-2007年的752个气象台站长期观测的气温和降水数据进行空间统计分析的基础上,综合考虑DEM数据、经纬度、坡向、坡度等系列地形特征因子对气温和降水空间分布的影响,对全国平均气温和平均降水空间分布趋势模型进行构建,并将其与高精度曲面建模(HASM)方法进行集成,实现研究周期内各时段的年平均气温和年平均降水时空变化趋势模拟。模拟结果表明,在1964-1974(C1)、1975-1985(C2)、1986-1996(C3)和1997-2007(C4)年4个时段内,全国年平均气温总体呈持续上升趋势(平均每10年上升近0.28℃),而全国平均降水总量变化幅度不大,存在显著的区域分布差异及变化特征。论文所建立的模型和方法,可以高效快速地实现将离散点气候观测数据转换成高分辨率的空间栅格数据,从而保证多尺度生态系统时空分析模型的参数精度需求。

DOI

[24]
Cheng X S, Su H.Effects of climatic temperature stress on cardiovascular diseases[J]. European Journal of Internal Medicine, 2010,21:164-167.lt;h2 class="secHeading" id="section_abstract">Abstract</h2><p id="simple-para0005">The climatic stress was anticipated to increase direct and indirect risks to human health via different pathways and mechanisms. Extremely high air temperature might trigger the onset of cardiovascular events in the vulnerable. Cold-related mortality was much less understood than heat-related one, and was considered another climatic example of the effects on the human health. Increases in mortality with cardiovascular diseases in extreme heat and cold weather had been studied in many regions. These results suggested that people died rapidly from climate-change related cardiovascular diseases before they were sent to hospital. Obviously, these findings reminded us that climatic stress can be considered as a new potential risk factor of sudden cardiovascular events in human health, and there was an urgent need for large-scale, prospective, community-based and international study of sudden cardiovascular events to explore deeply the risk factors to schedule preventive strategies.</p>

DOI PMID

[25]
Balloux F, Handley L J L, Jombart T, et al. Climate shaped the worldwide distribution of human mitochondrial DNA sequence variation[C]. Proceeding of the Royal Society. UK: London, 2009:3447-3455.

[26]
Griffiths E J.Mitochondria and heart disease[M]. Berlin, Germany: Springer, 2012:249-267.

Outlines

/