
Journal of Geo-information Science >
The Susceptibility Assessment of Debris Flow in Karst Region of Guizhou Province
Received date: 2014-12-25
Request revised date: 2015-05-19
Online published: 2015-11-10
Copyright
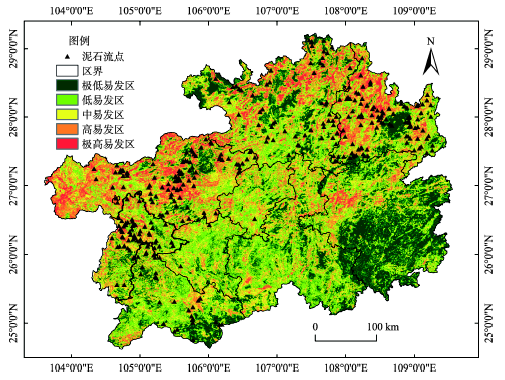
Guizhou is a typical karst mountainous province in China, which has unique geological disaster mechanism due to its unique geological environment. In this study, 10 factors were selected as the possible impact factors, and the cluster analysis and correlation analysis methods were used to identify the main risks of debris flow factors. Based on the techniques of geo-information system, information model was used to evaluate the spatial pattern of debris flow susceptibility. Soil erosion is identified as the most important factor to influence the occurrence of native debris flow, while fault has little impact on debris flow. Factors of soil erosion, slop, aspect, rock characteristics, land use, NDVI, distance to gully and days of daily precipitation greater than 25mm are proved to be independent and representative factors, and they served as indices for susceptibility assessment. The results show that 29.51% of the regions in Guizhou are heavy susceptibility regions, which were located in western Guizhou and the mountainous area, such as Dalou mountain, Wuling mountain and Miaoling in northern Guizhou. The central and southeastern Guizhou is identified as relative less susceptibility region. Heavy susceptibility areas have common characteristics of steep slope, low vegetation coverage, featuring with dry land, industrial and mining land, and are subjected to serious soil erosion. The debris flow density in heavy susceptibility region is 19 times of that in the low susceptibility region. The effective way to decrease debris flow disaster is to strengthen the management of dry land, industrial and mining land, and the area with lower vegetation cover.
Key words: karst; debris flow; susceptibility assessment; Guizhou; GIS
YUE Xiliu , HUANG Mei , XU Qingyong , CHEN Changyan , GU Xiaoping . The Susceptibility Assessment of Debris Flow in Karst Region of Guizhou Province[J]. Journal of Geo-information Science, 2015 , 17(11) : 1395 -1403 . DOI: 10.3724/SP.J.1047.2015.01395
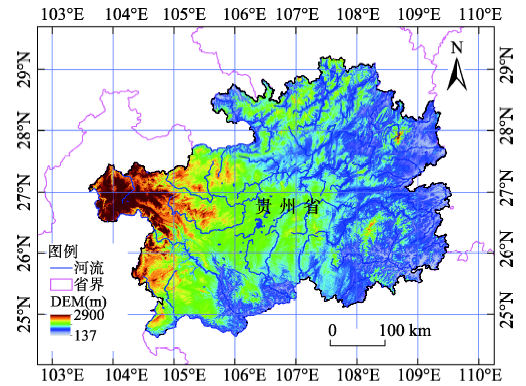
Fig. 1 The boundary map of Guizhou Province图1 贵州省行政区域图 |
Tab. 1 The classification of debris flow impact factors表1 泥石流灾害影响因子指标分级 |
| 影响因子 | 分级数 | 指标分级 | 分级方法及依据 | |
|---|---|---|---|---|
| 直接影响因子 | 土壤侵蚀 | 5 | 一级侵蚀(轻度侵蚀),二级侵蚀,三级侵蚀,四级侵蚀,五级侵蚀(重度侵蚀) | 土壤侵蚀等级数据(西南山地分中心发布) |
| 坡度 | 6 | <10°,10~15°,15~20°,20~25°,25~30°,>30° | 等间隔法;文献[30] | |
| 年平均降水 | 6 | <1000 mm,1000~1100 mm,1100~1200 mm,1200~1300 mm,1300~1400 mm,>1400 mm | 等间隔法 | |
| >25 mm降水日数 | 5 | <5 d,5~8 d,8~11 d,11~14 d,>14 d | 归一化分级 | |
| 间接影响因子 | 岩石性质 | 6 | 软硬岩互层岩,粘土岩、泥岩、页岩,砾岩、砂岩,灰岩、白云岩,变质岩,岩浆岩 | |
| 到断层的距离 | 5 | <0.5 km,0.5~1 km,1~1.5 km,1.5~2 km,>2 km | 等间隔法;文献[15] | |
| 坡向 | 5 | 阳坡(南坡:157.5~202.5°),半阳坡(东南坡:112.5~157.5°及西南坡:202.5~247.5°)、过渡坡(东坡:67.5~112.5°及西坡:247.5~292.5°)、半阴坡(东北坡:22.5~67.5°及西北坡:292.5~337.5°)、阴坡(北坡:337.5~22.5°及平地区域) | ArcGIS软件默认分类 | |
| 土地利用方式 | 5 | 旱地,耕地,城镇、工矿用地,草原,林地 | 文献[31]-[32] | |
| NDVI | <0.157,0.157~0.171,0.171~0.183,0.183~0.226,>0.226 | 自然断点法 | ||
| 到沟谷的距离 | 5 | <2 km,2~4 km,4~6 km,6~8 km,>8 km | 等间隔法 |
Tab. 2 Analysis of variance of causal impact factors表2 初选影响因子方差分析表 |
| 影响因子 | 方差 | 影响因子 | 方差 |
|---|---|---|---|
| 土壤侵蚀(X1) | 5.7774 | 到断层的距离(X6) | 0.0507 |
| 坡度(X2) | 0.2241 | 坡向(X7) | 0.2088 |
| 年平均降水(X3) | 0.3391 | 土地利用方式(X8) | 1.6792 |
| >25 mm降水日数(X4) | 0.9318 | NDVI(X9) | 0.7185 |
| 岩石性质(X5) | 0.3622 | 到沟谷的距离(X10) | 0.2282 |
Tab. 3 Correlation matrix of impact factors表3 影响因子相关性系数矩阵 |
| X1 | X2 | X3 | X4 | X5 | X6 | X7 | X8 | X9 | X10 | |
|---|---|---|---|---|---|---|---|---|---|---|
| X1 | 1.00 | -0.02 | -0.14 | -0.14 | 0.02 | -0.03 | 0.01 | 0.28 | 0.19 | 0.03 |
| X2 | -0.02 | 1.00 | 0.02 | 0.00 | 0.00 | -0.05 | -0.01 | -0.16 | -0.25 | 0.02 |
| X3 | -0.14 | 0.02 | 1.00 | 0.90 | -0.14 | 0.04 | 0.01 | -0.06 | -0.08 | -0.02 |
| X4 | -0.14 | 0.00 | 0.90 | 1.00 | -0.14 | 0.04 | 0.01 | -0.06 | -0.02 | 0.03 |
| X5 | 0.02 | 0.00 | -0.14 | -0.14 | 1.00 | 0.06 | -0.01 | 0.01 | 0.01 | -0.04 |
| X6 | -0.03 | -0.05 | 0.04 | 0.04 | 0.06 | 1.00 | 0.00 | 0.01 | 0.08 | 0.04 |
| X7 | 0.01 | -0.01 | 0.01 | 0.01 | -0.01 | 0.00 | 1.00 | 0.03 | 0.02 | 0.00 |
| X8 | 0.28 | -0.16 | -0.06 | -0.06 | 0.01 | 0.01 | 0.03 | 1.00 | 0.30 | 0.06 |
| X9 | 0.19 | -0.25 | -0.08 | -0.02 | 0.01 | 0.08 | 0.02 | 0.30 | 1.00 | 0.17 |
| X10 | 0.03 | 0.02 | -0.02 | 0.03 | -0.04 | 0.04 | 0.00 | 0.06 | 0.17 | 1.00 |
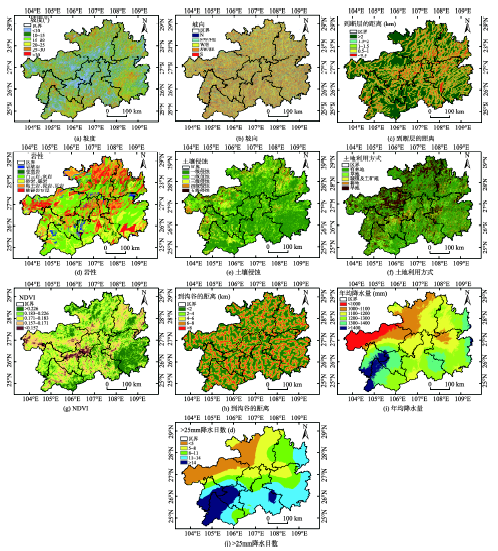
Fig. 2 Spatial distribution of impact factors according to their degrees图2 各因子等级空间分布图 |
Tab. 4 Assessment factors and their information quantities of debris-flow susceptibility表4 泥石流灾害易发性参评因子及信息量计算结果 |
| 因子 | 分级 | Si/S | Ni | I(L,Xi) | 信息量排序 |
|---|---|---|---|---|---|
| 土壤 侵蚀 | 一级 | 0.6195 | 107 | -0.6948 | 41 |
| 二级 | 0.2198 | 106 | 0.3323 | 7 | |
| 三级 | 0.1098 | 80 | 0.7446 | 4 | |
| 四级 | 0.0437 | 44 | 1.0676 | 2 | |
| 五级 | 0.0072 | 9 | 1.2833 | 1 | |
| 坡度(°) | <10 | 0.3313 | 86 | -0.2873 | 38 |
| 10~15 | 0.2217 | 68 | -0.1205 | 31 | |
| 15~20 | 0.1845 | 82 | 0.2501 | 13 | |
| 20~25 | 0.1278 | 53 | 0.1815 | 17 | |
| 25~30 | 0.0740 | 28 | 0.0894 | 21 | |
| >30 | 0.0607 | 29 | 0.3225 | 8 | |
| 坡向 | N | 0.1221 | 30 | -0.3424 | 39 |
| NW&NE | 0.2456 | 70 | -0.1938 | 33 | |
| E&W | 0.2549 | 87 | -0.0135 | 25 | |
| SW&SE | 0.2542 | 105 | 0.1772 | 18 | |
| S | 0.1233 | 54 | 0.2357 | 15 | |
| 岩性 | 岩浆岩 | 0.0325 | 9 | -0.2217 | 35 |
| 变质岩 | 0.0251 | 10 | 0.1405 | 19 | |
| 白云岩、灰岩 | 0.4406 | 138 | -0.0996 | 30 | |
| 砂岩、砾岩 | 0.1882 | 51 | -0.2443 | 36 | |
| 粘土岩、泥岩、页岩 | 0.1411 | 59 | 0.1895 | 16 | |
| 软硬岩互层 | 0.1725 | 79 | 0.2804 | 10 | |
| 土地利用方式 | 林地 | 0.5815 | 127 | -0.4600 | 40 |
| 草地 | 0.1764 | 58 | -0.0510 | 28 | |
| 城市及工矿地 | 0.0038 | 2 | 0.4256 | 5 | |
| 耕地 | 0.0705 | 25 | 0.0251 | 24 | |
| 旱地 | 0.1679 | 134 | 0.8359 | 3 | |
| NDVI | >0.226 | 0.2070 | 22 | -1.1802 | 42 |
| 0.183~0.226 | 0.3206 | 108 | -0.0268 | 27 | |
| 0.171~0.183 | 0.2798 | 127 | 0.2713 | 11 | |
| 0.157~0.171 | 0.1526 | 74 | 0.3375 | 6 | |
| <0.157 | 0.0400 | 15 | 0.0810 | 22 | |
| 到沟谷的距离(km) | <2 | 0.4322 | 120 | -0.2200 | 34 |
| 2~4 | 0.1238 | 42 | -0.0196 | 26 | |
| 4~6 | 0.1362 | 60 | 0.2414 | 14 | |
| 6~8 | 0.1465 | 47 | -0.0752 | 29 | |
| >8 | 0.1614 | 77 | 0.3215 | 9 | |
| >25 mm降水日数(d) | <5 | 0.1584 | 71 | 0.2588 | 12 |
| 5~8 | 0.2000 | 71 | 0.0259 | 23 | |
| 8~11 | 0.2100 | 82 | 0.1208 | 20 | |
| 11~14 | 0.3039 | 88 | -0.1781 | 32 | |
| >14 | 0.1277 | 34 | -0.2619 | 37 |
Fig. 3 Zonation of debris flow susceptibility in Guizhou Province图3 贵州省泥石流灾害易发区划分 |
Tab. 5 The statistics of debris flow distribution in the study area表5 研究区泥石流易发性分布统计 |
| 易发性分级 | 综合信息量区间 | 面积(km2) | 面积比(%) | 灾害数(处) | 分布密度(处/1000 km2) |
|---|---|---|---|---|---|
| 极低易发区 | (-3.6909)-(-1.8901) | 28 332 | 16.09 | 10 | 0.35 |
| 低易发区 | (-1.8901)-(-0.8568) | 50 700 | 28.78 | 43 | 0.85 |
| 中易发区 | (-0.8568)-0.0878 | 45 132 | 25.62 | 69 | 1.53 |
| 高易发区 | 0.0878-1.1801 | 33 168 | 18.83 | 98 | 2.95 |
| 极高易发区 | 1.1801-3.8666 | 18 816 | 10.68 | 126 | 6.70 |
The authors have declared that no competing interests exist.
| [1] |
|
| [2] |
|
| [3] |
|
| [4] |
|
| [5] |
|
| [6] |
|
| [7] |
|
| [8] |
|
| [9] |
|
| [10] |
|
| [11] |
|
| [12] |
|
| [13] |
|
| [14] |
|
| [15] |
|
| [16] |
|
| [17] |
|
| [18] |
|
| [19] |
|
| [20] |
|
| [21] |
|
| [22] |
|
| [23] |
|
| [24] |
|
| [25] |
|
| [26] |
|
| [27] |
|
| [28] |
|
| [29] |
|
| [30] |
|
| [31] |
|
| [32] |
|
| [33] |
|
| [34] |
|
| [35] |
|
| [36] |
|
| [37] |
|
| [38] |
《工程地质手册》编委会.工程地质手册[M].北京:中国建筑工业出版社,1992.
|
| [39] |
|
| [40] |
|
| [41] |
薛薇主编. SPSS统计分析方法及应用[M].北京:电子工业出版社,2013:242-256.
|
| [42] |
|
| [43] |
|
/
| 〈 |
|
〉 |