
Journal of Geo-information Science >
A Stacking-based Model for Urban Traffic Time-series Prediction
Received date: 2015-10-10
Request revised date: 2015-10-29
Online published: 2015-12-20
Copyright
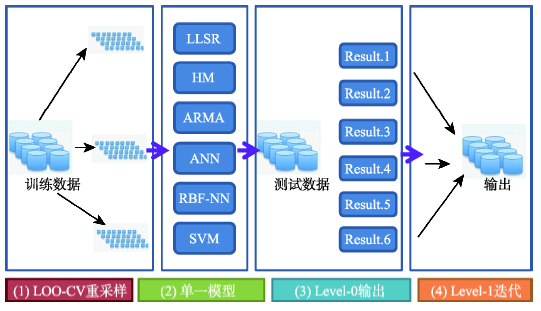
In general, the prediction of urban traffic time-series data often lacks priori knowledge and encounters lots of problems in parameter settings due to the dynamics of traffic. It’s still hard to get a satisfying result just from one model when facing the complexity of traffic phenomena. In view of the limitations of traditional approaches, in this paper we propose a pervasive, scalable ensemble learning framework for urban traffic time-series prediction from the floating car data based on stacked generalization (also known as stacking). Firstly, we analyzed the optimal linear combination of different models and redesigned the learning strategy in setting the Level-1 modeling of the stacking framework. In order to prove the effectiveness of the proposed stacking ensemble learning method, we implemented a mathematical justification based on the error-ambiguity decomposition technology. Secondly, we integrated six classical approaches into this stacking framework, including linear least squares regression (LLSR), autoregressive moving average (ARMA), historical mean (HM), artificial neural network (ANN), radical basis function neural network (RBF-NN), and support vector machine (SVM). We also conducted experiments with an actual urban traffic time-series dataset obtained from 400 main intersections in Beijing’s road networks. We further compared our results of the proposed model with other four traditional combination models, including equal weights method (EW), optimal weights method (OW), minimum error method (ME) and minimum variance method (MV). According to the variance and bias values of different models, the final results reveal that the proposed stacking ensemble approach behaves more robustly than any other single models. Moreover, the stacking ensemble learning approach shows its superior performance comparing to other traditional model combination strategies. These findings demonstrate the competitive properties of the stacking model in the prediction of urban traffic time-series data. We also present the possible explanations with mathematical analysis and plan our future research directions.
Key words: urban traffic; time-series prediction; ensemble learning; stacking; robustness
LIU Xiliang , LU Feng . A Stacking-based Model for Urban Traffic Time-series Prediction[J]. Journal of Geo-information Science, 2015 , 17(12) : 1474 -1482 . DOI: 10.3724/SP.J.1047.2015.01474
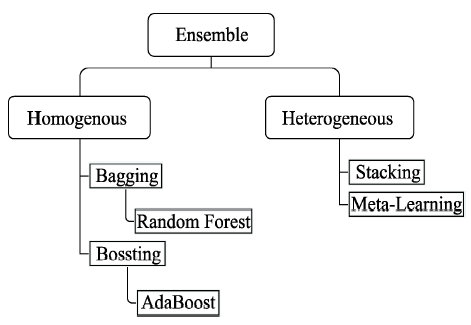
Fig. 1 The ensemble learning hierarchy图1 集成学习分类 |
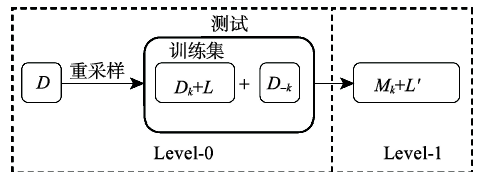
Fig. 2 The logic structure of stacking图2 层叠泛化模型逻辑图 |
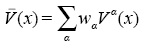
 。式(6)说明,层叠泛化模型的输出结果是对原始基础学习模型的加权平均。定义α学习器对于原始问题的解释度(Ambiguity)为式(7)。
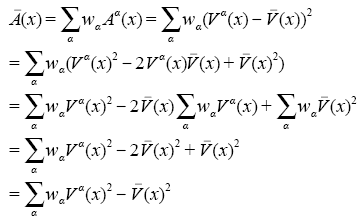

进行如下分解(式(12)):
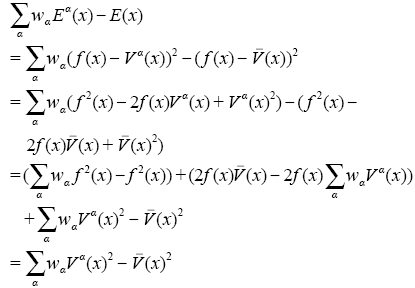
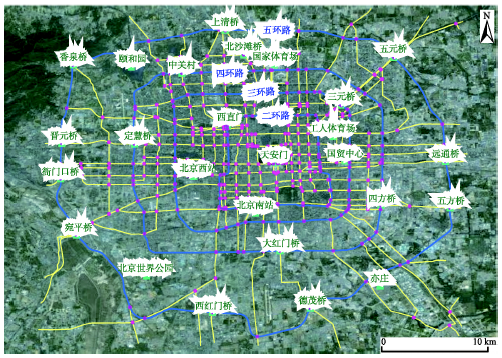
Fig. 3 Illustration of the study area图3 研究区域示意图 |
Tab. 1 Turn delay dataset in Beijing (part of the original data)表1 北京市城市路网交叉口通行耗时数据(部分) |
| ID | FID | TID | WID | TTP | TIID | TD |
|---|---|---|---|---|---|---|
| 174 | 704 | 705 | 1 | 2 | 95 | 43.59 |
| 174 | 704 | 705 | 1 | 2 | 96 | 50.65 |
| 174 | 704 | 706 | 2 | 3 | 1 | 66.41 |
| 174 | 704 | 706 | 2 | 3 | 2 | 54.28 |
| 174 | 704 | 706 | 2 | 3 | 3 | 58.83 |
| 174 | 704 | 706 | 2 | 3 | 4 | 62.10 |
| 174 | 704 | 706 | 2 | 3 | 5 | 72.60 |
| 174 | 704 | 706 | 2 | 3 | 6 | 56.20 |
| 174 | 704 | 706 | 2 | 3 | 7 | 59.45 |
| 174 | 704 | 706 | 2 | 3 | 8 | 65.54 |
| … | … | … | … | … | … | … |
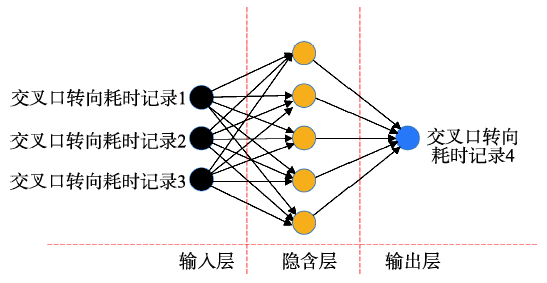
Fig. 4 The topology of ANN network图4 ANN网络拓扑结构图 |
Fig. 5 The flow chart of stacking图5 层叠泛化模型流程图 |
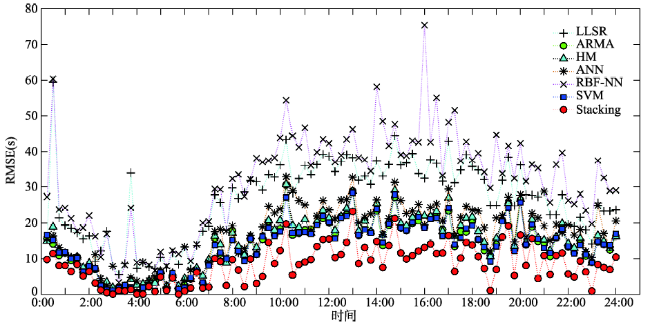
Fig. 6 The effect comparison between single models and stacking (RMSE)图6 单一模型与层叠泛化模型效果对比图(RMSE) |
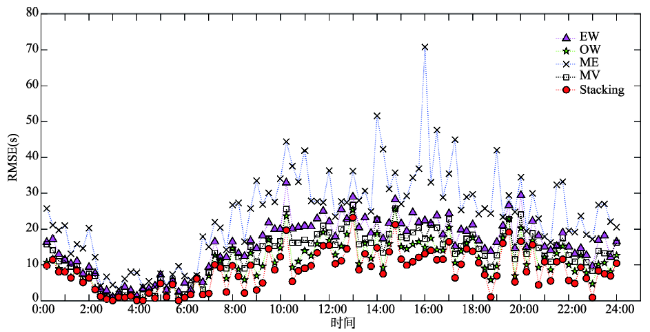
Fig. 7 The effect comparison between statistic-based models and stacking (RMSE)图7 数理统计混合模型与层叠泛化模型效果对比图(RMSE) |
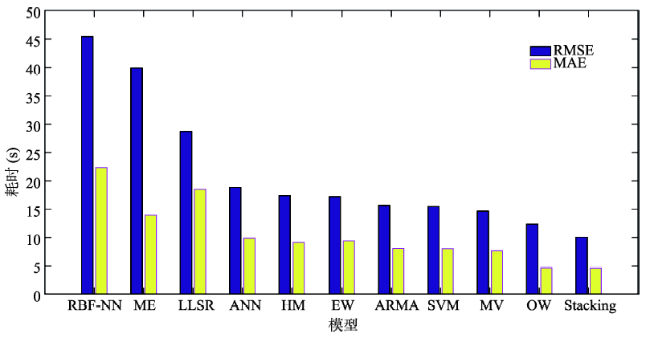
Fig. 8 The effect comparison between all models图8 所有模型效果对比图 |
The authors have declared that no competing interests exist.
| [1] |
|
| [2] |
|
| [3] |
|
| [4] |
|
| [5] |
|
| [6] |
|
| [7] |
|
| [8] |
|
| [9] |
|
| [10] |
|
| [11] |
|
| [12] |
|
| [13] |
|
| [14] |
|
| [15] |
|
| [16] |
|
| [17] |
|
| [18] |
|
| [19] |
|
| [20] |
|
| [21] |
|
| [22] |
|
| [23] |
|
/
| 〈 |
|
〉 |