
Journal of Geo-information Science >
A New Method of Rendering 2D Vector Line Symbols on 3D Terrain Surface
Received date: 2015-10-10
Request revised date: 2015-11-09
Online published: 2015-12-20
Copyright
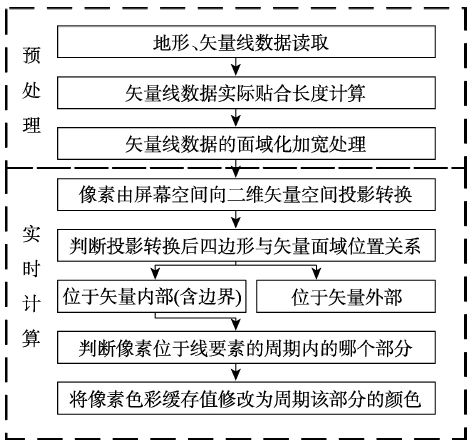
Two-dimensional (2D) vector symbols are important components on 2D maps. How to accurately overlay the symbols on the three-dimensional (3D) terrain surface becomes one of the research hotspots in geoscience at present. This paper proposes a method for mapping the 2D vector lines (simple lines and periodically changed lines) onto the 3D terrain model based on the inverse projection of screen coordinates, with an additional period judgment based on the spread lengths of lines on terrain surface. The method solves some problems that might occur within other existing methods, for example: the poor rendering accuracy, being sensitive to terrain model complexity, not fitting in the terrain surface tightly, and so on. The key steps of the method include: calculating the spread length of the overlaid lines on terrain surface and extending them into polygons during pre-processing; projecting every screen pixel to the 3D world space and then to the 2D vector plane, and ruling out the pixels that are out of the range of the polygons; setting the color for each of the remaining pixels in terms of the result of period judgment based on the spread lengths of lines on terrain surface. Attribute to a CPU-GPU heterogeneous parallel model, the running performance is improved evidently. The lines can be authentically overlaid on the terrain model and with its running performance independent to the complexity of terrain model. The final rendering effect shows that the periodically changed symbols can be evenly distributed over the line with a high rendering accuracy on screen.
Key words: GIS; 3D cartography; vector data; computer graphics; parallel computing
TAN Xin , SHE Jiangfeng . A New Method of Rendering 2D Vector Line Symbols on 3D Terrain Surface[J]. Journal of Geo-information Science, 2015 , 17(12) : 1483 -1489 . DOI: 10.3724/SP.J.1047.2015.01483
Fig. 1 Technique route图1 技术路线图 |
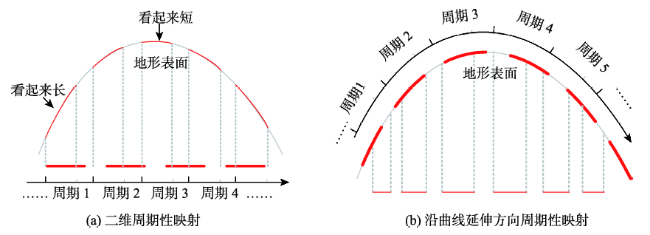
Fig. 2 Different cycle distributions of the cyclical-changed line symbol图2 周期变化线的不同周期性分布示意图 |
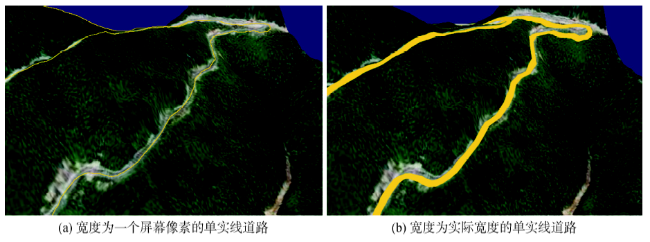
Fig. 3 Width optimization of line图3 线宽优化效果图 |
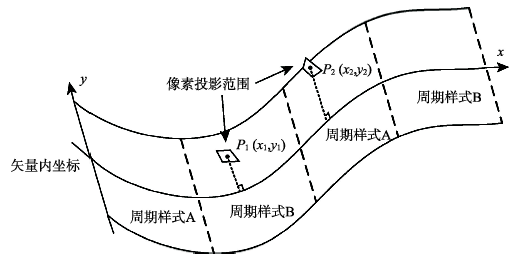
Fig. 4 Diagram of period judgment图4 周期判断方法示意图 |
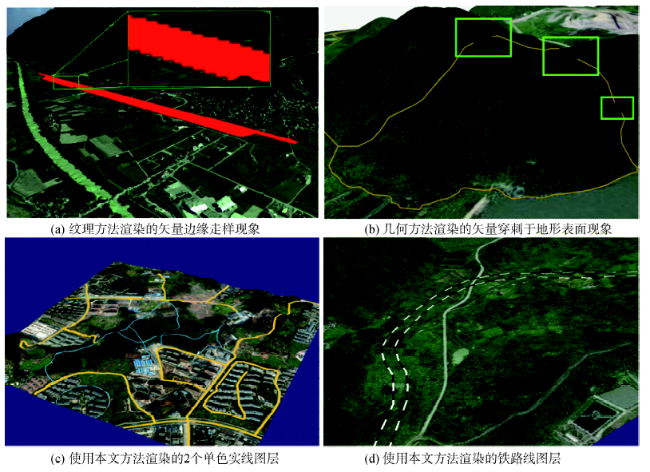
Fig. 5 Paralleled rendering of vectors on terrain surface图5 二维矢量在地表的并行渲染效果 |
Tab. 1 Hardware and software environment associated with algorithm developing and running表1 算法开发与运行平台软硬件环境 |
| 项目 | 参数 |
|---|---|
| 中央处理器 (CPU) | Inter® Xeon® CPU E5-2609 0 @2.4 Ghz |
| 图形处理单元 (GPU) | NVIDIA® Quadro® 4000 2GB RAM |
| 三维开发引擎 | OpenSceneGraph (OSG) |
| GPU并行工具包 | NVIDIA® CUDA™ v5.5 |
| 地形与矢量数据处理工具包 | Geospatial Data Abstraction Library (GDAL) |
Tab. 2 Experiments on real-time performance表2 实时性能测试 |
| 序号 | 矢量数据量 (顶点数) | 地形数据量 (三角形数) | 地形 LOD层 | 窗口大小 (宽×高,像素) | 并行块数量 | 并行块大小 (宽×高,像素) | 仅渲染地形时帧速(fps) | 渲染地形与矢量时帧速 | |
|---|---|---|---|---|---|---|---|---|---|
| 仅CPU(fps) | CPU+GPU(fps) | ||||||||
| 1 | 2134 | 3048 | 3 | 600 × 400 | 4800 | 10 × 20 | 75.9 | 1.1 | 29.8 |
| 2 | 2134 | 3048 | 3 | 1024 × 768 | 4800 | 10 × 20 | 68.3 | 1.1 | 22.1 |
| 3 | 2134 | 3048 | 3 | 1200 × 800 | 4800 | 10 × 20 | 60.8 | <1.0 | 20.2 |
| 4 | 2134 | 3048 | 3 | 1200 × 800 | 1600 | 20 × 30 | - | - | 12.6 |
| 5 | 2134 | 3048 | 3 | 1200 × 800 | 2400 | 20 × 20 | - | - | 19.5 |
| 6 | 2134 | 3048 | 3 | 1200 × 800 | 9600 | 10 × 10 | - | - | 20.2 |
| 7 | 1640 | 3048 | 3 | 1200 × 800 | 4800 | 10 × 20 | - | - | 23.3 |
| 8 | 4101 | 3048 | 3 | 1200 × 800 | 4800 | 10 × 20 | - | - | 15.5 |
| 9 | 10 171 | 3048 | 3 | 1200 × 800 | 4800 | 10 × 20 | - | - | 5.8 |
| 10 | 2134 | 1468 | 1 | 1200 × 800 | 4800 | 10 × 20 | - | - | 20.1 |
| 11 | 2134 | 10 475 | 5 | 1200 × 800 | 4800 | 10 × 20 | - | - | 20.1 |
| 12 | 2134 | 22 530 | 9 | 1200 × 800 | 4800 | 10 × 20 | - | - | 20.0 |
The authors have declared that no competing interests exist.
| [1] |
|
| [2] |
|
| [3] |
|
| [4] |
|
| [5] |
|
| [6] |
|
| [7] |
|
| [8] |
|
| [9] |
|
| [10] |
|
| [11] |
|
| [12] |
|
| [13] |
|
| [14] |
|
| [15] |
|
| [16] |
|
| [17] |
|
| [18] |
|
| [19] |
|
/
| 〈 |
|
〉 |