Orginal Article

Identification and Description of Manufacturing Clusters: A Case Study of Yangtze River Delta Region

  • YUAN Feng , 1, * ,
  • CHEN Wen 1 ,
  • SONG Zhengna 2
Expand
  • 1. Nanjing Institute of Geography and Limnology, Chinese Academy of Science, Nanjing 210008, China
  • 2. Nanjing University of Information Science & Technology, Nanjing 210044, China
*Corresponding author: YUAN Feng, E-mail:

Received date: 2013-12-11

  Request revised date: 2014-04-19

  Online published: 2015-12-20

Copyright

《地球信息科学学报》编辑部 所有

Abstract

Industrial vertical linkage and geographical proximity are not only the basic characteristics of industrial clusters, but also the main foundation to identify the clusters. With the applications of principal component analysis based on input-output table and spatial clustering analysis based on firm-level spatial distribution data, this paper quantitatively identified the major manufacturing clusters in the Yangtze River Delta region. Then the paper depicted and compared different spatial organization types of manufacturing clusters from three different scales, including the enterprise, industry and the regional scale. Results showed that: firstly, the Yangtze River Delta has formed 12 vertical close-knit manufacturing groups, such as metallurgy and equipment manufacturing, and information and communication technology manufacturing, which heavily aggregate along the "Z" shaped area enclosed by Shanghai-Nanjing railway, Shanghai-Hangzhou railway and Hangzhou-Ningbo railway; secondly, the regional manufacturing clusters have presented different organization patterns, which were highly affected by the industrial and regional characteristics; thirdly, the capital-intensive clusters represented by metallurgy and equipment manufacturing, the technology-intensive clusters represented by information and communication technology manufacturing and the labor-intensive clusters represented by textile and garment manufacturing have exhibited different industrial cluster organization patterns, including: the Spoke pattern based on large enterprises, the satellite pattern based on foreign capital enterprises and the Marshall pattern based on small and medium-sized enterprises; fourthly, Shanghai’s and Jiangsu’s manufacturing clusters were significantly greater than Zhejiang’s according to the cluster size and the proportion of large and foreign enterprises. Moreover, an obvious industrial specialization existed between different regional labor-intensive manufacturing clusters, while the industrial structures between the capital-intensive and technology-intensive regional clusters were similar.

Cite this article

YUAN Feng , CHEN Wen , SONG Zhengna . Identification and Description of Manufacturing Clusters: A Case Study of Yangtze River Delta Region[J]. Journal of Geo-information Science, 2015 , 17(12) : 1511 -1519 . DOI: 10.3724/SP.J.1047.2015.01511

1 引言

早在19世纪末,英国经济学家Marshall就发现制造业存在由大企业组织和由在特定区位集中的专业化小企业组织2种方式[1]。二战后,大批量生产技术的进步推动了大型垂直一体化企业成为制造业组织的主导形式[2-3]。但是,1970年代末,随着交通、通讯技术进步和经济全球化进程加快,地方化中小企业为主的组织方式又得到复苏[4-6]。学术界也复兴了对企业空间集聚现象的研究,并提出了“产业区”、“新的产业空间”、“学习型区域”等概 念[3,7-8],其中,最广为接受的是由Porter提出的“产业集群”理论[9-11]。目前,关于产业集群研究仍然存在激烈的学术争论[10,12],焦点之一是如何界定和辨识区域产业集群[13]
Porter将产业集群定义为某一特定领域内的公司及其相关机构,因共用性和互补性而形成的地理上接近的相互联系的群体[9],因此,产业集群的辨识至少要满足相关产业的功能联系和空间邻近2条准则[14]。从目前研究看,主要采用2类方法定量识别区域产业集群:(1)基于投入产出表的图谱分析、多变量聚类分析、主成分分析等方法[15-17],该类方法侧重于测度区域产业间的投入产出联系,未界定产业集群的空间集聚范围;(2)区位商、空间聚类等空间分析方法[9],该类方法重点测度特定产业的区位聚散结构,较少考虑产业间的垂直联系。针对单独使用这2类方法的局限性,有学者提出通过整合这2类方法来综合界定区域产业集群[14,18]。此外,以上方法主要采用产业—区域数据,在实际应用时还会产生可变区域单元问题(MAUP)[19]
为此,本文以长江三角洲地区(以下简称“长三角地区”)为例,试图从产业集群的功能联系和空间邻近性出发,采用企业数据界定边界更为精确的区域产业集群,并在此基础上分析所识别集群的组织特征。长三角地区包括上海、江苏、浙江两省一市的范围,面积21.07万 km2,是中国综合实力最强、城市化和工业化程度最高的区域[20-21],其中,上海、南京、苏州、无锡、常州、镇江、扬州、泰州、南通、杭州、宁波、湖州、嘉兴、绍兴、舟山、台州16市是长三角地区的核心区。制造业集群式和专业化分工发展是长三角地区制造业快速增长的重要因素[22-24],以该地区作为案例区具有一定典型性。

2 集群分析的理论背景

Boschma和Frenken认为产业集群分析,可从微观层面的企业、中观层面的产业及网络、宏观层面的区域系统3个维度进行剖析[25]

2.1 企业维度

传统的马歇尔产业区理论强调本地小企业、地方网络,以及自我支撑的内源式增长能力对产业集群形成和发展的影响[1,6]。近年来,学术界开始质疑甚至批判马歇尔产业区过于关注地方制度和网络,而忽视跨国公司和大企业的作用[26-28];Knorrina和Meyer-Stamer在Markusen研究的基础上,根据集群内部企业规模和组织方式,提出了马歇尔式产业集群、卫星式产业集群和轮辐式产业集群3种集群原型[29-30]表1)。目前,中国正处于经济转型阶段,国有企业、民营企业和外资企业,是塑造和推动产业集群发展的主要力量。外资进入成为许多集群形成的重要原因,例如,苏州电子信息产业的发展很大程度得益于台湾企业生产网络的跨界扩展,并通过产业链关系带动当地企业的发展[31]。而北京、青岛等国有企业发育地区,外资企业在当地集群中处于从属地位[32]
Tab. 1 Classification of regional clusters

表1 区域产业集群分类

马歇尔式产业集群 卫星式产业集群 轮辐式产业集群
主要特征 中小企业为主;专业化程度;密集的竞争与合作关系网络;基于信任关系 中小企业为主;对外部企业(母公司)依赖性强;基于低廉劳动力成本的产业低端环节 大型企业与中小企业共存、共生;
内部等级结构明显
优势 柔性专业化;较强的创新和学习能力 经营成本和风险小;通过母公司易于获取技术 经营成本低;技术扩散成本低
劣势 路径依赖与锁定;对剧烈的外部环境变化相应迟缓 生产和创新过于依赖外部企业;技术水平低 大型企业依赖;技术创新热情较低
发展轨迹 向轮辐式产业集群演变;部分活动外包给其他区域;衰弱或消亡 向马歇尔产业集群演变;企业向其他区域迁移而逐渐消亡 向卫星式产业集群演变;部分活动外包给其他区域;鼓励技术创新与对外合作

注:根据文献[29]、[30]整理

2.2 产业维度

无论是传统产业,还是高技术产业,都普遍存在产业集群现象,但是具体集群组织方式明显受到产业特征的影响[3]。王缉慈等根据产业特性将集群分为高端道路和创新的集群、低端道路和低成本的集群2类[33],认为前者形成的基础是创新、功能灵活性和良好的工作环境等,而后者形成的基础则是低成本竞争。曾刚和文嫮发现浦东信息产业集群具有外部联系广泛、内部水平垂直协作薄弱的特点[22],类似于卫星式产业集群组织方式;李小建等对钢卷尺企业集群的研究则发现类似于传统马歇尔产业区的组织特征,主要以小企业为主,是由外部规模经济、分工经济和网络联系三者共同作用的结果[34]

2.3 区域维度

由于不同国家和地区发展的历史阶段不同、制度和文化背景不同、在全球分工体系的地位和作用不同,所形成的产业集群所表现出的特征和运行机制也存在着差别,因此,对特定产业集群的把握,也要考虑其产生和发展的区域环境。一些学者逐渐开始关注地方人际信任、制度厚度、网络及其地方嵌入性对产业集群的影响[35]。长三角地区空间范围广阔,其内部区域存在着文化、制度等方面的显著差异。其中,传统的苏南模式以中小型乡镇企业为主要特征,目前通过嵌入全球生产网络,已经从以苏南模式著称的区域转变成一个外资驱动型的全球城市和高科技中心[36];传统的温州模式以家庭手工业为主要特征,目前通过企业兼并和并购形成了跨区域企业和大集团,并带动产业集群的升级[26]

3 研究方法与数据来源

本文基于投入产出表的主成分分析,以及基于企业数据的空间聚类分析等,综合产业功能联系和空间联系定量辨识区域制造业集群。

3.1 研究方法

(1)运用投入产出表的主成分方法界定长三角地区制造业间的功能联系。该方法将具有相似经济技术联系的产业组合成一个因子,每个因子反映产业间价值流的行业结构,提取出来的因子成为构造投入产出关系的制造业群组的雏形,每个制造业群组中存在若干个联系强度各异的产业链[37]。具体识别步骤如下:从投入产出表中截取所有制造业,则产业ij之间的垂直联系可由aijbij表示:
a ij = x ij P j b ij = y ij S i (1)
式中,xijj产业从i产业购买的中间投入;Pjj产业的总中间投入;yiji产业销售给j产业的中间产出;Sji产业的总中间产出。aijbij的集合分别构成矩阵A和矩阵B’,将矩阵B’转置得到矩阵B;根据矩阵AB,计算4个相关系数来衡量产业mn的投入产出结构的相似性:R(am,an)衡量2产业中间投入结构的相似程度;R(bm,bn)测量2个产业的中间产出结构的相似程度;R(am,bn)表示产业m中间投入结构与产业n中间产出结构的相似程度;R(bm,an)衡量产业m中间产出结构与产业n的中间投入结构的相似程度。取上述4个相关系数中绝对值最大者组成产业间投入产出结构相似矩阵C,矩阵C每一列反映了一个制造业产业由与其他制造业产业投入产出相关性表示的投入产出结构特征;将矩阵C的每一列作为一个变量,通过主成分分析,得到特征值大于1的主成分;然后,用方差极大法进行正交旋转将因子荷载差异最大化,根据旋转后的荷载矩阵,以确定各个制造业群组中的产业,本文将每个主成分中荷载值超过0.40的产业归入对应的制造业群组,其中,载荷值大于0.70的作为主要产业,载荷值在0.40~0.70之间的作为次要产业[37-38]。各产业在每组制造业群组中的地位可由中间投入贡献率(Gbi)和中间产出贡献率(Gfi)来定义,如式(2) 所示。
G bi = j k x ij i = 1 k P i × 100 G fi = j k x ij i = 1 k S i × 100 (2)
式中,k为产业集合内的产业个数。对于北京、上海等单一城市区域通过投入产出关系判定的制造业群组也满足企业间的空间邻近性的要求,可视为区域产业集群[37]
(2)运用空间聚类的方法测度不同群组制造业的空间特征和识别区域制造业集群。首先以县域为单元,通过Getis and Ord Gi*统计的方法测度长三角地区各制造业群组的整体分布情况。对于特定制造业群组q在县pGi*统计量可由式(3)定义:
G p * = Σ q w pq L q - W p L ̅ ( N S 1 p - W q 2 ) ( N - 1 (3)
式中,Lq是特定制造业群组n的就业人口;wpq是空间权重矩阵,通过县域之间的距离倒数定义;Wp是{wpq}的加和;N为县域单元的总数。
Getis and Ord Gi*方法无法判断由于企业内部规模经济引起的产业向个别企业集中引起的集聚现象[39]。所以,本文通过STAC方法来确定制造业集群更为精确的边界。该方法用标准离差椭圆或者多边形的方式来表示企业点分布的空间聚类,为了更符合集群的实际情况,研究中用多边形区域作为区域集群的具体边界。

3.2 数据来源与处理

合并2007年上海134部门、江苏144部门和浙江144部门投入产出表的基础上,构建长三角地区投入产出表,通过该方式得到的投入产出表一定程度上会忽略产业在上海、江苏和浙江3个地区之间的投入产出联系,但是不会对长三角整体产业间的功能联系产生根本性的影响。从中截取制造业的相关信息,获得74×74的投入产出流量信息。
企业层面数据来自于2004年第二次经济普查企业数据库,包含了企业名称、行业分类、产值、职工人数、地址等信息,共包含45.4万家制造业企业,职工总人数达到1594.1万人。根据地址信息采用地址解析(Geocoding)方法,对数据进行空间化处理。通过Google Map API批量导出企业的经纬度坐标,然后通过ArcGIS的Add XY data功能生成企业的空间矢量数据。除去部分地址不清晰和无法识别的企业,总共得到约38万家企业信息,总空间化率为83.7%。

4 长江三角洲地区制造业集群的识别分析

4.1 功能联系识别

对长三角地区投入产出表中74个制造业行业价值流量信息进行主成分分析,得到12个特征值大于1的因子,这12个因子解释了88.59%的总方差(表2),构成了12个基于投入产出关系的制造业群组的基础。计算每个群组中主要行业的中间投入贡献率和中间产出贡献率,将中间投入贡献率和中间产出贡献率最高的行业作为该群组中的核心投入行业和核心产出行业。从结果来看,每个群组的核心行业对该群组的中间投入贡献率从20.51%到88.93%,中间收入贡献率从17.17%到89.60%,说明了核心行业对集群形成的重要性。如表2所示,共辨识了冶金及装备制造、电子信息制造、纺织及服装制造等12个长三角地区垂直联系紧密的制造业群组。
Tab. 2 Factor analysis results with Varimax rotation

表2 方差极大方法正交旋转后的主成分结果

因子 特征值 解释方差(%) 累计方差(%) 核心投入行业(%) 核心产出行业(%)
1 21.93 29.64 29.64 钢压延加工业(25.50) 钢压延加工业(17.17)
2 10.71 14.47 44.11 电子元器件制造业(52.20) 通信设备制造业(21.28)
3 7.54 10.19 54.30 棉、化纤纺织及印染精加工业(32.82) 纺织服装、鞋、帽制造业(24.33)
4 7.34 9.92 64.22 基础化学原料制造业(20.51) 合成材料制造业(19.44)
5 3.75 5.07 69.29 电力、热力的生产和供应业(77.90) 电力、热力的生产和供应业(55.24)
6 3.16 4.28 73.57 造纸及纸制品业(65.35) 造纸及纸制品业(89.60)
7 2.91 3.93 77.50 其他食品加工和食品制造业(54.84) 其他食品加工和食品制造业(65.09)
8 2.30 3.10 80.60 木材加工及木、竹、藤、棕、草制品业(80.93) 家具制造业(38.54)
9 1.97 2.67 83.27 塑料制品业(53.69) 其他电气机械及器材制造业(44.60)
10 1.51 2.03 85.30 汽车零部件及配件制造业(74.46) 汽车制造业(52.44)
11 1.34 1.81 87.11 有色金属冶炼业(42.87) 其他电气机械及器材制造业(55.73)
12 1.10 1.48 88.59 饲料加工业(61.98) 饲料加工业(85.50)
通过绘制每个群组的投入(产出)联系图,可更直观地表达每个制造业群组中的投入产出关系。该方法首先从矩阵AB中挑选出每个制造业群组中主要行业和次要行业的中间投入系数和销售系数(aijbij),分别组成新的矩阵,然后选择一定的门槛值,用箭头将中间投入系数或者销售系数,超过该门槛值的行业对连接起来。为避免行业间的联系太多,选择0.015作为门槛值[37]。限于篇幅,本文仅绘制制造业群组的投入关系图,且选择冶金及装备制造、电子信息制造、纺织及服装制造3个群组分别代表资本密集型、技术密集型和劳动密集型不同类型的制造业群组(图1)。从图1(a)可看出,以钢压延加工业为核心投入行业的冶金及装备制造业群组中,主要行业还包括炼焦业、耐火材料制品制造业、炼铁业、炼钢业、铁合金冶炼业、金属制品业、锅炉及原动机制造业、金属加工机械制造业等,而有色金属冶炼业、有色金属压延加工业、汽车零部件及配件制造业、电机制造业等行业处于次要地位。同样,也可区分出图1(b)和图1(c)中的主要行业和次要行业及其投入联系。
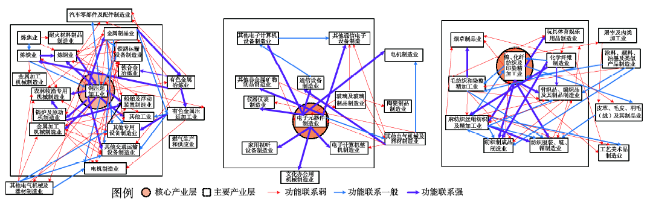
Fig. 1 Input linkages in the main manufacturing groups

图1 主要制造业群组的投入联系

4.2 区域制造业集群的辨识与结果分析

运用Getis and Ord Gi*方法测度冶金及装备制造、电子信息制造、纺织及服装制造3个群组的空间分布,考虑到县域规模差异对估计结果的影响,研究中将群组的职工人数取自然对数以后再代入式(3)[18],结果如图2所示。总体上来看,3个制造业群组在空间上均呈现高度集聚特征,主要集中在上海、苏南和浙北等长三角核心区,尤其呈现较为明显的沿沪宁线、沪杭线、杭甬线的“Z”字形分布特征,说明了长三角核心区在长三角地区制造业发展中的主体地位。
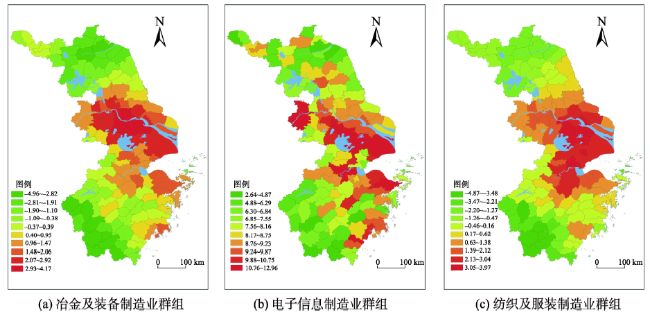
Fig. 2 Spatial linkage of the main manufacturing groups

图2 主要制造业群组的空间联系情况

在考虑产业功能联系和空间联系的基础上,通过STAC分析辨识的区域制造业集群结果如图3所示:冶金及装备制造、电子信息制造、纺织及服装制造3个群组中共存在14个区域集群,其中,冶金及装备制造形成了江苏沿江、上海沿江、杭州湾、宁波沿海、温州沿海5个区域集群;电子信息制造形成了沪宁沿线(上海-苏锡常,南京)、杭州城区、宁波城区、台州城区等5个区域集群;纺织及服装制造形成了上海-苏锡常-南通、杭州湾、温州、嘉兴4个区域集群。这3个群组中位于区域集群中的职工人数分别占到47.0%、68.5%和91.9%,表明产业集群式发展已经成为长三角产业组织的普遍形式。图3也表明了集群的地理范围可以从一个城市延伸到一个或多个省[39],除集群2、3、7近位于一个城市以外,其他11个集群的边界都是跨了2个以上的城市。
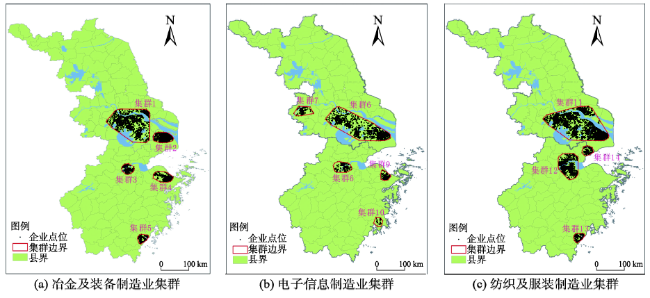
Fig. 3 The distribution of the main regional clusters

图3 主要制造业区域集群分布

5 长江三角洲地区制造业集群组织 特征分析

在区域制造业集群识别的基础上,本文通过统计上述14个区域集群的规模、产业结构、外资情况、企业规模等信息,从企业、产业、区域3个维度比较长三角地区制造业集群组织特征。

5.1 不同类型企业影响区域集群的规模

一般来说,国有企业和外资企业相较民营企业具有更大的企业规模,通过产业链联系带动集群的能力也较强,因此,国有企业和外资企业比重较大的集群,其规模和大中型企业所占比重也会相对较高。通过比较3个群组内部不同区域集群中国有企业和外资企业比重,以及区域集群规模和集群中大型企业所占比重,可发现以下特点:每个群组中,国有企业占比最高的集群和外资企业占比最高的集群规模,总是位于群组中区域集群规模的前两位,这表明了在长三角地区国有企业和外资企业相较民营企业具有更强的组织带动能力。与区域集群中大型企业所占比重来看,除冶金及装备制造群组外,总体上也呈现类似特点。考虑到企业维度分析是产业维度和区域维度分析的基础,以下着重比较不同产业特性和区域特点对区域制造集群组织特征的影响。

5.2 不同产业特性的区域集群倾向以不同的集群组织模式

表3所示,识别的14个集群规模差异很大,小到区域集群内总职工人数仅1.5万人,大到总职工人数将近220万人,但总体来看纺织及服装制造、冶金及装备制造区域集群的规模较大,纺织及服装区域集群可能与在长江三角洲地区发展较为成熟、城市之间已形成了较好的产业链关系有关;而冶金及装备制造区域集群则是由于该集群产业链较长、企业规模较大引起。区域集群内部的专业化程度普遍较高,就业人数最多的前三位行业占所在区域集群总就业人数的比重基本上都超过了50%,但是随着集群规模的扩大,集群内部多元化的特征就越明显。总体上看,资本密集型的冶金及装备制造集群更倾向于采用以内资,尤其国有企业为主体的轮辐式集群组织方式,5个区域集群内大型企业就业的总职工人数比重均超过了80%,外资企业职工人数占比在30%以下;技术密集型的电子信息通讯制造集群较多采用了卫星式产业集群的组织方式,中小企业职工人数的比重在60%以上,而外资比重除台州地区的集群外,均高于35%,远高于其他2类集群。类似于第三意大利的情况[6],劳动密集型的纺织及服装制造集群易采用内资为主的马歇尔式产业集群组织方式,中小企业职工人数比重高达80%以上,外资比重在50%以下。
Tab. 3 Profile of the regional clusters

表3 区域集群的基本情况

集群 所属群组 所在地区 总就业人数 前3位产业占比**(%) 国企占比(%) 外企占比(%) 企业规模情况*(%)
(万人) 占群组***(%) 小型 中型 大型
1 冶金及装备制造 江苏沿江 59.9 60.7 21.5 3.3 17.4 2.4 9.6 88.0
2 冶金及装备制造 上海 46.5 64.9 16.7 14.9 26.9 4.1 9.6 86.3
3 冶金及装备制造 杭州 8.8 82.1 3.2 1.9 4.4 1.4 9.2 89.4
4 冶金及装备制造 宁波、慈溪、余姚 8.0 67.5 2.9 0.8 19.6 2.9 14.0 83.2
5 冶金及装备制造 温州、乐清、瑞安 7.8 71.9 2.8 2.7 18.5 1.7 6.1 92.2
6 电子信息制造 上海、苏锡常 94.3 73.3 58.1 1.0 77.6 23.0 42.0 35.1
7 电子信息制造 南京 7.9 73.0 4.9 8.4 50.8 22.2 46.8 30.9
8 电子信息制造 杭州、富阳 5.5 73.2 3.4 1.9 55.0 25.7 49.0 25.3
9 电子信息制造 宁波、慈溪 2.0 86.2 1.2 1.0 37.6 68.9 31.1 0.0
10 电子信息制造 台州、温岭 1.5 92.5 0.9 0 6.0 61.8 38.2 0.0
11 纺织及服装制造 上海、苏锡常、南通 219.5 67.0 62.6 2.1 44.5 40.8 40.9 18.3
12 纺织及服装制造 杭州、绍兴、海宁 57.7 49.8 16.4 0.9 32.5 45.0 48.2 6.8
13 纺织及服装制造 温州、乐清、瑞安 24.4 91.2 7.0 0.1 17.2 37.7 55.3 7.0
14 纺织及服装制造 嘉兴、平湖、嘉善 20.8 87.2 5.9 0 36.4 39.0 57.7 3.3

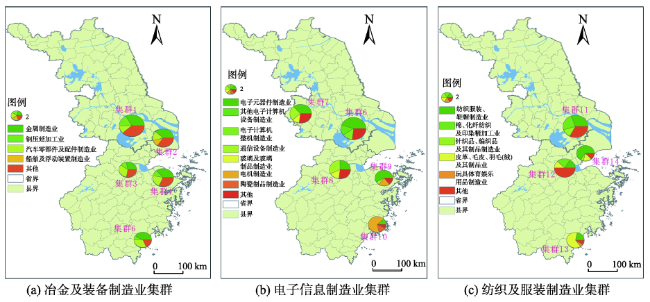
注:*职工人数300人以下为小型企业,300~2000人之间为中型企业,超过2000人为大型企业;**表格中所有数据均为职工人数及其比重;***具体产业名称及各产业占比见图4

Fig. 4 Input linkages among the regional clusters

图4 区域集群间的投入联系

图4所示,纺织及服装制造业区域集群间前三位行业的差异最大,而冶金及装备制造、电子信息制造2类区域集群间产业结构较为雷同,纺织及服装制造业区域集群间分工程度较高,而其他2类区域集群缺乏有效的分工;从投入联系来看,也是纺织及服装制造业区域集群较为紧密。这可能是由于纺织及服装制造业区域集群市场化和发育程度较高,且产品易于运输,从而形成了区域集群之间较好的分工关系。冶金及装备制造业集群可能是由于中间投入和中间产出均难以运输,所以,选择在本集群内部配套,导致了集群间的联系较为松散;而电子元器件制造集群主要是外资企业主导的,原材料和零部件,以及产品主要通过母公司统一调配,故其与集群之间的联系不紧密。

5.3 同一类型产业集群因地区差异而呈现不同的 组织特征

除了产业的差异外,区域文化、社会的差异也会影响区域制造业集群的组织方式。通过比较江苏和浙江的集群可发现,浙江无论在集群规模还是内部大企业所占比重,均低于江苏的同类集群,如以电子信息制造集群为例,浙江集群职工规模在1.5~5.5万人,远低于江苏的7.9万人,大企业所占比重基本在25%以下。但是浙江集群表现出更明显的内生特征,仅电子信息制造集群外资比重超过了50%,其他均在40%以下。从与上海的关系来看,也具有较大的差别,江苏的电子信息制造、纺织及服装制造与上海形成了共同的区域集群,如图3所示,集群6和11跨了上海、江苏2个省份,从中可看出上海和江苏之间产业的联系比较密切。但是浙江与上海的产业联系相对较弱,未与上海形成共同的区域产业集群。

6 结论与讨论

产业集群的形成是市场解和规划解的统一,政府单方面的规划和推动难以取得成功,因此,在实践中通过辨识出现有以及有潜力的产业集群进行培育和壮大尤为重要。针对现有方法主要单一侧重于界定产业集群的功能联系和空间集聚程度,本文提供了一种界定更为精确的集群产业边界和空间边界的分析方法和思路。该方法通过投入产出分析建立制造业间功能联系的基础上,通过企业数据分析识别集群内部联系。该方法克服了单纯运用投入产出方法导致集群边界的模糊,以及单纯使用产业集聚的方法导致对产业间投入产出联系的忽视。本文将该方法运用到长三角地区实证,发现有12组产业间存在着紧密的投入产出联系。在此基础上共识别了冶金及装备制造业、电子信息制造业和纺织及服装制造业群组内的14个具体的区域集群。从目前的情况来看,大部分的区域集群仍主要集中在长三角核心区域,这也是长三角地区形成了中心-外围的发展结构的重要原因之一。
区域制造业集群组织方式与产业特性相关,资本密集型集群易采用以大企业为主的轮辐式产业集群的组织方式,而技术密集型集群采用外资企业为主的卫星式产业集群的组织方式;类似于第三意大利的情况,劳动密集型制造业集群采用了中小企业为主的马歇尔式产业集群组织方式,这种差异还受区域社会、文化的影响,显示出区域差异性。冶金及装备制造集群中的冶金、船舶等资本和原材料密集型行业在布局选址中要满足大运量、大耗水的要求,所以,在空间上有向建港条件较好的沿江和沿海地区分布的倾向[40];电子信息制造集群中的企业大多属于技术密集型和附加值较高的行业,区位选址时更易于在技术水平较高和交通通讯条件较好的城区集聚[41],因而各地市的中心城市分布大量相关企业;纺织及服装制造集群中大部分企业属于劳动密集型行业,也是长三角地区传统优势产业和传统苏南模式、温州模式下发展的主要行业,发展基础较好,空间分布也较为广泛。地区间文化、社会等差异也影响集群的组织方式。例如,上海、江苏的集群表现出更明显的外资驱动特征,企业平均规模也较大;而浙江的集群主要以内资为主,企业平均规模也相对较小。路径依赖对区域集群的形成和发展具有较大的影响,上海和江苏的外资规模较大,除了受到区位影响外,很大程度上还与该地区历史上与国外联系紧密和工业基础密切相关。

The authors have declared that no competing interests exist.

[1]
Marshall A.Principles of economics (8th)[M]. London: Macmillan, 1925.

[2]
Martin R L, Sunley P J.The changing landsape of workplaces and work[A]. In: Martin R L, Sunley P J(eds.). Economic geography: Critical concepts in the social sciences[C]. London and New York: Routledge, 2008.

[3]
Scott A J.Flexible production systems and regional development: The rise of the new industrial space North America and Western Europe[J]. International Journal of Urban and Regional Research, 1988,12(2):171-183.

[4]
Amin A.Industrial district[A]. In: Sheppared E, Barnes T(eds.). A companion to economic geography[C]. Oxford: Blackwell, 2003.

[5]
Dichen P.Global shift: reshaping the global economic map in the 21st century (4th)[M]. London: Sage Publications, 2003.

[6]
Piore M J, Sabel C F.The second industrial divide: Possibilities for prosperity[M]. New York: Basic Books, 1986.

[7]
Harrison B.Industrial districts: Old wine in new bottles[J]. Regional Studies, 1992,26(5):469-483.

[8]
Asheim B.Industrial districts as 'learning regions'[J]. European Planning Studies, 1996,4(4):379-400.The concept of ‘learning regions’ is a product of the 1990s and reflects empirically the rapid economic development in places such as the ‘Third Italy’. Theoretically, it reflects the definition of post-Fordist societies as learning economies. ‘Learning regions’ has been used in at least three different contexts. The concept was introduced by economic geographers in the mid-1990s, when they used it to emphasize the role played by cooperation and collective learning in regional clusters and networks in order to promote the innovativeness and competitiveness of firms and regions. The second approach expressing the idea of learning regions originates from the writings of evolutionary and institutional economics on the learning economy, where innovation is seen as basically a socially and territorially embedded, interactive learning process, making knowledge the most fundamental resource and learning the most important process. The third approach, which conceptualizes learning regions as regionally based development coalitions, has been developed by action-oriented organizational researchers taking their knowledge of how to form intra- and interfirm learning organizations based on broad participation out of the firm context and applying it at the regional level as a bottom-up, horizontally based cooperation between different actors in a local or regional setting.

DOI

[9]
Porter M.Competitive advantage of nations[M]. New York: the Free Press, 1990.

[10]
Martin R, Sunley P.Deconstructing clusters: Chaotic concept or policy panacea?[J]. Journal of Economic Geography, 2003,3(1):5-35.

[11]
王缉慈. 创新的空间:企业集群与区域发展[M].北京:北京大学出版社,2001.

[12]
Malmberg A.Beyond the cluster-local milieus and global connections[A]. In: Peck J, Yeung H (eds.). Remaking the global economy[M]. London: Sage, 2003.

[13]
吕拉昌,魏也华.产业集群理论的争论、困惑与评论[J].人文地理,2007,22(4):21-26.产业集群理论是近年来在学术界 及政策界影响较大的理论之一。但产业集群理论仍是发展中的理论,在国外有很大的争论。本文介绍了西方学者对产业集群的争论,重点分析了产业集群空间界限及 划分、产业集群与产业演化及区域发展、产业集群与全球化及产业政策方面存在的问题,在此基础上,进行了理论评述。

[14]
Titzea M, Bracherta M, Kubis A.The identification of regional industrial clusters using qualitative input-output analysis[J]. Regional Studies, 2011,45(1):89-102.The ‘cluster theory’ has become one of the main concepts promoting regional competitiveness, innovation, and growth. As most studies focus on measures of concentration of one industrial branch in order to identify regional clusters, the appropriate analysis of specific vertical relations within a value-adding chain is developing in this discussion. This paper tries to identify interrelated sectors via national input-output tables with the help of Minimal Flow Analysis by Schnabl (1994). The regionalization of these national industry templates is carried out with the allocation of branch-specific production values on regional employment. As a result, the paper shows concentrations of vertical clusters in only 27 of 439 German NUTS-3 regions.

DOI

[15]
Campbell J.Application of graph theoretic analysis to interindustry relationships: The example of Washington state[J]. Regional Science and Urban Economics, 1975,5(1):91-106.

DOI

[16]
Feser E.An updated set of benchmark value chains for the United States[J]. Regional Economics Applications Laboratory, University of Illinois at Urbana-Champaign, 1997.

[17]
Feser E J, Bergman E M.National industry cluster templates: A framework for applied regional cluster analysis[J]. Regional Studies, 2000,34(1):1-19.A growing number of cities, states and regions in Europe, North America and elsewhere are designing development strategies around strategic clusters of industries. In many cases, a lack of data on local and interregional industrial linkages, shared business institutions, channels of technology and knowledge transfer, and other dimensions of the cluster concept means that relatively simple measures (location quotients, industry size) are often used to initially detect clusters in subnational regions. In this paper, we suggest a means of using available information on national interindustry linkages to identify potential clusters in subnational areas. Specifically, we derive a set of 23 US manufacturing clusters and employ them as templates in an illustrative analysis of the manufacturing sector in a single US state. The template clusters help detect gaps and specializations in extended product chains and therefore constitute a useful first step in more comprehensive examinations of local cluster patterns.

DOI

[18]
Feser E J, Koo K, Renski H C, et al.Incorporating spatial analysis in applied industry cluster studies[J]. Paper for Economic Development Quarterly, 2001.Most studies of industry clusters in states and regions define clusters as localized concentrations of linked sectors and enterprises along with supporting non-business organizations and programs. The challenge for researchers and development practitioners undertaking such studies is to find a means of systematically identifying clusters given typical sub-state industry data and virtually no information on direct patterns of interaction between regional firms. Ideally, cluster studies should also acknowledge development opportunities afforded by clusters in neighboring states or border regions, further complicating the analysis. In this paper, we argue that a hybrid methodology that combines an aspatial analysis of interindustrylinkages with spatial statistical analysis of employment patterns can yield rich information about industry clusters in state and sub-state areas. We illustrate the approach in a study of Kentucky’s economy. Incorporating Spatial Analysis in Applied Industry Cluster Studies The industry cluster has become an important concept in economic development research and practice. In their ideal form, clusters are essentially the empirical manifestation of the mutually reinforcing influences of first-mover effects, conventional business agglomeration economies,

[19]
Wong D W S, Lee J. Statistical analysis of geographic information with ArcView GIS and ArcGIS[M]. New York : John Wiley & Son, 2005.

[20]
段学军,虞孝感,Josef,等.从极化区的功能探讨长江三角洲的扩展范围[J].地理学报,2009,64(2):211-220.<p>极化区作为一种具有全球意义的区域发展模式和空间组合形式, 日益成为集聚经济要 素和支配国家乃至全球经济命脉的巨大载体, 承担着引领国家经济发展、参与世界竞争的功 能。长江三角洲地区经过了近30 年的高速发展, 已经初具极化区的特征。但是, 与其它世界 级极化区相比, 长江三角洲地区整体实力和带动能力仍然不足, 国际竞争力还很有限。通过 扩展极化区范围, 可以扩大长江三角洲核心地区的腹地, 缓解极化区资源环境瓶颈约束。关于长江三角洲地区的合理范围, 各界意见纷纭, 争论较多。基于&ldquo;长三角&rdquo; 作为世界极化区 的要求, 从极化区的科学概念、条件和以提高国际竞争力、完善极化区功能的目标出发, 通 过区域内城市之间的功能互补和经济联系分析, 结合区域一体化的现实性, 研究了扩大&ldquo;长 三角&rdquo; 的合理范围, 得出了应把温州、金华、盐城、淮安、马鞍山、芜湖、铜陵、巢湖、合 肥、滁州、宣城等城市作为扩展优先选择区, 把宿迁、徐州、连云港、丽水、衢州、池州、 安庆、蚌埠、黄山、宿州等城市作为扩展保留资格区, 从而把长江三角洲地区从16 个城市逐 步扩大到37 个城市的结论。</p>

[21]
李加林,许继琴,李伟芳,等.长江三角洲地区城市用地增长的时空特征分析[J].地理学报,2007,62(4):437-447.<p>以Landsat MSS、TM、ETM 卫星影像为主要数据源,利用遥感和GIS 手段,提取了长江三角洲地区5 个时相(1979 年、1990 年、1995 年、2000 年、2005 年) 城市用地信息,分析了城市用地扩展速度、扩展强度、空间结构的变化特征,进而探讨了长江三角洲1979 年以来的城市空间生长过程。结果表明:① 1979 年以来,长江三角洲城市用地增长呈明显的加快趋势,城市用地总体扩展强度也表现为不断提高。不同行政等级城市用地的扩展强度表现为直 辖市&gt; 地级市&gt; 副省级市&gt; 县(县级市)。② 长江三角洲城市用地空间结构的分维和稳定性特征具有一定的波动性。城市用地的空间结构特征与城市用地增长过程和发展阶段具有一定的联系。③ 长江三角洲城市生长表现出&ldquo;一核二带&rdquo;、&ldquo;二核三带&rdquo;、&ldquo;四核四带&rdquo;和&ldquo;五核五带&rdquo;的空间轨迹。</p>

[22]
曾刚,文嫮.上海浦东信息产业集群的建设[J].地理学报,2004,59(增刊):59-66.产业集群作为一种典型的经济活动空间组织现象,成为区域经济发展的成功模式.作者回顾了产业集群的基本内涵和类别,并从水平效应、垂直效应、内部制度环境、外部联系和平等与依赖的权利机构等5个方面从理论上系统地阐述了产业集群的内部机理.同时,结合实际调研资料,对上海浦东的信息产业集群建设问题进行了系统的分析和研究.作者认为,浦东信息产业集群具有规模扩张快、外部联系广泛,但内部水平垂直协作薄弱、内部制度环境建设滞后的特点.在此基础上,提出了加强本地网络联系、激发集体学习、注重外部联系、积极把握产业发展的主动权、构建适宜的区域制度环境等对策建议.

DOI

[23]
Yang Y, Hsia C.Spatial clustering and organizational dynamics of transborder production networks: A case study of Taiwanese information-technology companies in the Greater Suzhou Area, China[J]. Environment and Planning A , 2007,39(6):1346-1363.Transborder investment by Taiwanese information-technology (IT) companies has driven the development of a new industrial space in the Greater Suzhou Area (GSA) of China over the last ten years. In this paper we aim to explore some characteristics of this expansion from the perspective of the organizational dynamics of global production networks. We found that foreign brand-name companies have played a key role in propelling this wave of investment in the GSA by Taiwanese IT companies. At the same time, their business strategies have influenced the mechanisms governing these Taiwanese companies’ supply chains and have forged the dynamics of spatial agglomeration. We argue that the transborder extension of the production networks is interwoven with the exercise of power between enterprise organizations. Our findings suggest that interdependence among firms in close geographical proximity is inseparable from the asymmetrical power relations embodied in global commodity chains; a point emphasized by economic geographers as the main reason for transborder production shifts that result in the formation of new industrial spaces in developing countries. However, if these production networks can respond collectively to such a strict environment through instituting suitable organizational governance, then their competitive advantage will be enhanced, while also benefiting the host region’s development through localization.

DOI

[24]
Wei Y H D. China’s shoe manufacturing and the Wenzhou Model: perspectives on the world’s leading producer and exporter of footwear[J]. Eurasian Geography and Economics, 2009,50(6):720-739.A U.S.-based geographer and specialist on China advances his research on industrial districts and regional development by presenting a 2008 study of shoe manufa

DOI

[25]
Boschma R A, Frenken K.Why is economic geography not an evolutionary science? Towards an evolutionary economic geography[J]. Journal of Economic Geography, 2005,3(6):273-302.The paper explains the commonalities and differences between neoclassical, institutional and evolutionary approaches that have been influential in economic geography during the last couple of decades. For all three approaches, we argue that they are in agreement in some respects and in conflict in other respects. While explaining to what extent and in what ways the Evolutionary Economic Geography approach differs from the New Economic Geography and the Institutional Economic Geography, we can specify the value-added of economic geography as an evolutionary science.

DOI

[26]
Wei Y H, Li W, Wang C.Restructuring industrial districts, scaling up regional development: A study of the Wenzhou model, China[J]. Economic Geography, 2007,83(4):421-444.

[27]
Amin A, Thrift N.Neo-Marshallian nodes in global networks[J]. International Journal of Urban and Regional Research, 1992,16(4):571-587.

[28]
Whitford J.The decline of a model? Challenge and response in the Italian industrial districts[J]. Economy and Society, 2001,30(1):38-65.The article presents an extensive critical review of recent debates on the restructuring of Italian industrial districts in the 1990s. It shows that, despite consensus on the empirical 'facts' of district restructuring, there remains extensive disagreement over appropriate public policies. This debate fundamentally turns on analysts' interpretations of how, or indeed whether, strong institutions and localized subcultures allow territorial networks of small firms to compete successfully with larger and more highly capitalized multinational corporations. But perhaps the most crucial and contentious issues are questions about the past adequacy of the districts' regulatory and service institutions in overcoming structural difficulties of the model, and, more importantly, about further innovations that may be required given recent changes in the external economic context.

DOI

[29]
Knorringa P, Meyer-Stamer J. New dimensions in local enterprise co-operation and development: From clusters to industrial districts[EB/OL]. .

[30]
Markusen A.Sticky places in slippery space: A typology of industrial districts[J]. Economic Geography, 1996,72(3):293-313.Identifies and assesses three types of industrial districts that exist as alternatives to the "new industrial district" model, to remark on the limits

DOI

[31]
杨友仁,夏铸九.跨界生产网络的组织治理模式——以苏州地区信息电子业台商为例[J].地理研究,2005,24(2):253-264.<p>以最近8年内在苏州地区投资设厂的信息电子业台商为例,分析其本地集聚的供应链的企业间交易关系的本质和组织网络的治理模式,以探讨全球生产网络的地域性集聚的经济地理意义,以及企业组织间的治理结构对地方发展的影响。指出这一轮信息电子业台商的跨界投资基本上强化台湾代工厂商与品牌大厂之间的策略性合作,然而台商生产网络的跨界扩展也交织着企业组织间的权力运作,导致生产网络的治理模式发生改变并形成了空间集聚的动力。研究显示,从全球生产网络的厂商间交易治理结构出发的分析视角有助于理解区域发展的机会与限制,而就发展中国家由全球生产网络之跨界转移所形成的新工业空间而言,经济地理学所强调的厂商间具有地理邻近特征的&quot;互赖性&quot;并不能脱离全球商品链所内含的不对称权力关系。</p>

[32]
Kim J Y, Zhang L Y.Formation of foreign direct investment clustering: a new path to local economic development? The case of Qingdao[J]. Regional Studies, 2008,42(2):265-280.This paper investigates the clustering of Chinese electronics manufacturers, large and small, alongside established foreign producers in Qingdao, North China. It examines how the supplier–buyer linkages between foreign invested enterprises (FIEs) and local firms have driven the development of a successful electronic industry cluster around development zones established by the local authority, underpinning the success of the large domestic firms both at home and abroad. It also analyses how FIEs' collaboration with local firms fosters local economic development in Qingdao. By integrating the theoretical perspectives of the hub-and-spoke model from economic geography and flagship-and-five partner's model in the science of strategic management, it develops its own theoretical lens to investigate the inter-firm network between the FIEs and local firms. The secret of the success of the Chinese electronic producers lies in their ability to drive, rather than being subordinate to, this network.

DOI

[33]
王缉慈. 超越集群[M].北京:科学出版社,2010.

[34]
李小建,李二玲.中国中部农区企业集群的竞争优势研究——以河南省虞城县南庄村钢卷尺企业集群为例[J].地理科学,2004,24(2):136-143.中国中部农区企业集群的竞争优势来源既具有一般企业集群的共性——它是规模经济、分工经济和网络联系三者共同作用的结果,又具有其特殊的个性——模仿创新的普遍发生、中原文化背景、制度扶持和较低的劳动力、土地等要素成本起决定作用。以河南省虞城县南庄村钢卷尺企业集群为例,详细分析了中国中部农区企业集群竞争优势的内在来源。

DOI

[35]
Gordon I R, Mccann P.Industrial clusters: Complexes, agglomeration and/or social Networks[J]. Urban Studies, 2000,37(3):513-532.The concept of industrial clusters has attracted much attention during the past decade, both as descriptive of an increasingly important phenomenon and as a basis for effective public intervention in the economies of lagging city-regions. However, there is much ambiguity in the way in which this concept is used, presenting an obstacle both to empirical testing and to realistic assessments of policy relevance. In this paper, we distinguish three ideal-typical models of processes which may underlie spatial concentrations of related activities, with very different implications both in terms of relevant evidence and the scope for promotional policies. Survey data for the London conurbation are used to explore the relation between concentration and different forms of linkage, with results which point to the dominance of pure agglomeration effects in this context at least.

DOI

[36]
Wei Y H D, Lu Y, Chen W. Globalizing regional development in Sunan, China: Does Suzhou Industrial Park fit a Neo-Marshallian district model[J]. Regional Studies, 2009,43(3):409-427.中国科学院机构知识库(中国科学院机构知识库网格(CAS IR GRID))以发展机构知识能力和知识管理能力为目标,快速实现对本机构知识资产的收集、长期保存、合理传播利用,积极建设对知识内容进行捕获、转化、传播、利用和审计的能力,逐步建设包括知识内容分析、关系分析和能力审计在内的知识服务能力,开展综合知识管理。

DOI

[37]
贺灿飞,梁进社,张华.区域制造业集群的辨识——以北京市制造业为例[J].地理科学,2005,25(5):521-528.辨识产业集群的定性方法,过于 依赖专家的主观判断,存在诸多局限性。基于投入产出表构建一个反映产业之间功能联系的矩阵,采用主成分分析定量辨识基于经济技术联系的区域产业集群。此 外,设计了几个衡量集群内产业联系强度的系数来判定被辨识集群的合理性,并通过相关系数衡量集群内产业的空间集聚特性。以北京市1997年投入产出表上 74个制造业行业为例,采用主成分分析方法辨别出14个产业集群,包括钢压延加工集群、有机化学制品集群、电子元器件集群以及棉毛纺织集群等。集群内产业 功能联系紧密,相关产业内的企业在空间上集聚,符合产业集群的理论定义。

DOI

[38]
吕卫国,陈雯.江苏省制造业产业集群及其空间集聚特征[J].经济地理,2009,29(10):1677-1684.空间集聚是产业集群固有特征,也是产业集群识别和分析的核心。采用Ellison和 Glaeser1997设计的产业集聚指数和产业间共同集聚指数,重点对江苏省5个典型的制造业产业集群的空间集聚特征进行了分析。结果表明,5个典型的 制造业产业集群均存在明显的产业集聚和产业间共同集聚。通过比较县域和市域两个尺度下的产业集聚和产业间共同集聚特征,发现,各集群空间集聚范围有一定差 异,钢铁、机械装备制造集群、石油、化学加工集群和汽车制造集群的空间集聚范围明显超越县域在市域,电子、通讯制造集群集聚范围在县域和市域尺度同时存 在,而棉毛纺织服装制造集群集聚范围主要在县域。还发现,各集群的集聚程度也存在差异,电子、通讯制造集群无论是产业内还是产业间集聚程度最高,达高集聚 水平,表明电子、通讯制造集群内外部性很高,集群内企业具有很强的相互吸引作用。汽车制造集群集聚程度较低,其他集群集聚程度为中等水平。

[39]
Porter M E. Locations, Clusters,Company Strategy[A]. In Clark G L, Feldman M. and Gertler M S(eds.). Oxford Handbook of Economic Geography[M], 1999.

[40]
Ellison G, Glaeser E L.Geographic concentration in U.S. manufacturing industries: A dartboard approach[J]. Journal of Political Economy, 1997,105(5):889-927.This paper discusses the prevalence of Silicon Valley-style localizations of individual manufacturing industries in the United States. Several models in which

DOI

[41]
袁丰,魏也华,陈雯,等.苏州市区信息通讯企业空间集聚与新企业选址[J].地理学报,2010,64(2):153-163.高科技产业是全球化背景下城市发展与区域竞争的关键,但是高科技产业发展空间极不平衡,空间要素显著影响高科技企业区位选择及空间集聚.针对现有研究主要集中在国家、省等大尺度单元,本文引入空间点模式分析方法,探讨了1996-2006年间苏州市区不同空间尺度上信息通讯企业的时空集聚特征.研究发现:在0~6 km的尺度上,信息通讯企业表现出明显的集聚特征,并随着尺度的增加呈现出倒"U"型集聚趋势;随着时间的推移,企业空间集聚的"热点地区"逐渐从老城区向外围推移,但是集聚峰区依然主要分布在老城区及其外围的国家和省级开发区;同时,新企业的选址与原有企业的分布特征表现出很强的相关性.运用计数模型的计量结果也表明企业集聚特征对新企业区位选择具有显著影响,同时起作用的还有地方政府政策影响下的开发区建设、城市内外交通条件、自然环境条件等因素.

DOI

Outlines

/