
Journal of Geo-information Science >
Research on Classification of Plant Community Using Projection Pursuit Learning Network Algorithm on High Resolution Remote Sensing Images
Received date: 2015-01-16
Request revised date: 2015-03-06
Online published: 2016-01-10
Copyright
Plant community is a significant content in the ecosystem. Traditional investigation method for plant community is mainly based on statistical sampling, which is limited by the data acquisition from complex terrain areas. In contrast, high-resolution remote sensing technique provides a convenient way to quickly access data in a large area. To overcome the shortcomings derived from the high dimensional features, which is caused by related data increasing, we choose the algorithm of projection pursuit learning network (PPLN) along with field samples of typical plant communities to realize a fast classification on the vegetation in the east of Shenzhen. Then,in the experiment, the spectral and texture information extracted from Pléiades images, and the terrain interpolated from topographic map are selected and used to build high dimensional features, which is crucial to the vegetation classification using remote sensing images. The learning network for projection pursuit is applied to discriminating the typical communities in both plantation and natural secondary forest in the study area. Compared with Maximum-likelihood classification (MLC) and Support Vector Machine (SVM), PPLN can achieve more accurate results for plant community classification. As a conclusion, the plant community classification with PPLN meets the requirements of the investigation project, achieves the quick updating of some basic information related to forest resources, and looks forward to involve in some other ecological research as well.
DU Xin , HUANG Xiaoxia , LI Hongga , SHEN Liqiang . Research on Classification of Plant Community Using Projection Pursuit Learning Network Algorithm on High Resolution Remote Sensing Images[J]. Journal of Geo-information Science, 2016 , 18(1) : 124 -132 . DOI: 10.3724/SP.J.1047.2016.00124
Tab. 1 Bands information of Pléiades data表1 Pléiades数据波段信息 |
| 光谱类型 | 波段范围(nm) | 分辨率(m) |
|---|---|---|
| 全色(Pan) | 480 ~ 830 | 0.5 |
| 蓝(B) | 430 ~ 550 | 2 |
| 绿(G) | 490 ~ 610 | 2 |
| 红(R) | 600 ~ 720 | 2 |
| 近红外(NIR) | 750 ~ 950 | 2 |
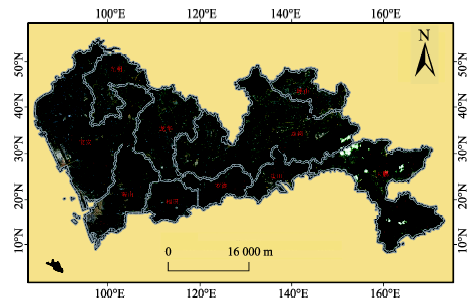
Fig. 1 Distribution of collected sample points in the field图1 野外采集样本点分布图 |
Tab. 2 Example list of the sample species information表2 样方物种信息示例表 |
| 序号 | 群落名称 | 生态系统类型 | 种名 | 多度 | 频度 | 相对多度(%) | 相对频度(%) | 显著度(%) | 重要值 |
|---|---|---|---|---|---|---|---|---|---|
| 64 | 台湾相思 | 人工林 | 台湾相思 | 481 | 9 | 83.8 | 25 | 91.6 | 200.4 |
| 野牡丹 | 55 | 7 | 9.58 | 19.44 | 3.9 | 32.92 | |||
| 鸭脚木 | 7 | 5 | 1.22 | 13.89 | 2.32 | 17.42 | |||
| 桃金娘 | 6 | 4 | 1.05 | 11.11 | 0.21 | 12.37 | |||
| 银柴 | 12 | 3 | 2.09 | 8.33 | 1.19 | 11.62 | |||
| 梅叶冬青 | 3 | 3 | 0.52 | 8.33 | 0.2 | 9.05 | |||
| 栀子 | 4 | 2 | 0.7 | 5.56 | 0.11 | 6.36 | |||
| 变叶榕 | 3 | 2 | 0.52 | 5.56 | 0.14 | 6.22 |
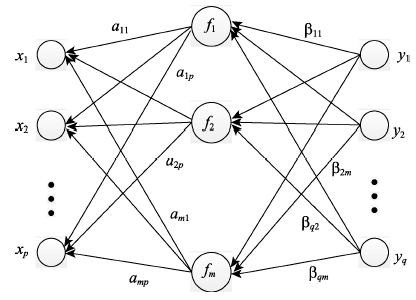
Fig. 2 Sketch map of the project pursuit learning network图2 投影寻踪学习网络示意图 |
Tab. 3 List of input variables表3 输入变量列表 |
| 维度序号 | 输入变量 | 表达信息 | 维度序号 | 输入变量 | 表达信息 |
|---|---|---|---|---|---|
| 1 | B1 | 蓝波段 | 10 | R6 | B3/B4 |
| 2 | B2 | 绿波段 | 11 | NDVI | 植被指数 |
| 3 | B3 | 红波段 | 12 | Elevation | 高程 |
| 4 | B4 | 近红外波段 | 13 | Slope | 坡度 |
| 5 | R1 | B1/B2 | 14 | Mean(B3) | 红波段均值 |
| 6 | R2 | B1/B3 | 15 | Correlation(B3) | 红波段相关性 |
| 7 | R3 | B1/B4 | 16 | Mean(B4) | 近红外波段均值 |
| 8 | R4 | B2/B3 | 17 | Correlation(B4) | 近红外波段相关性 |
| 9 | R5 | B2/B4 | 18 | Entropy(B4) | 近红外波段熵 |
Tab. 4 Comparison of classification accuracies amongseveral methods表4 各方法分类结果精度对比表 |
| 分类方法 | 类别 | |||
|---|---|---|---|---|
| 相思群落 | 分类精度(%) | 浙江润楠-鸭脚木群落 | 分类精度(%) | |
| 最大似然法 | 91 | 91 | 70 | 70 |
| SVM算法 | 90 | 90 | 70 | 70 |
| PPLN算法 | 93 | 93 | 73 | 73 |
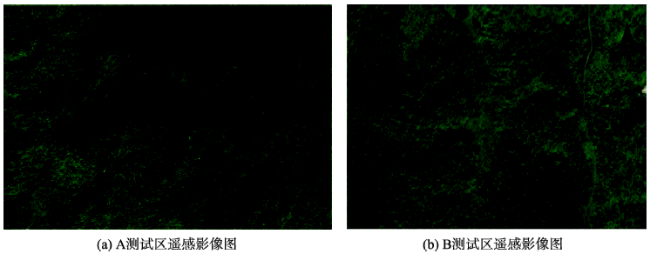
Fig. 3 Remote sensing images of two test regions图3 2个测试区遥感影像图 |
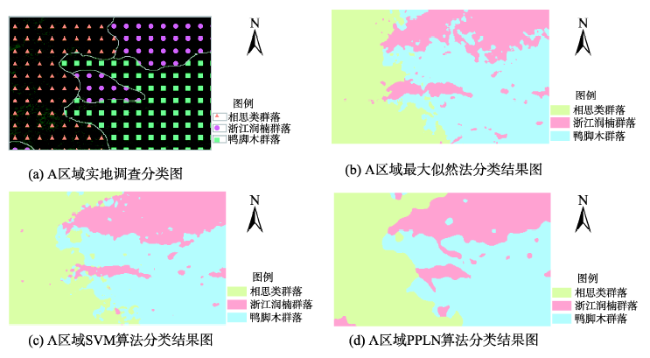
Fig. 4 Investigation classification map and classification result with three methods for region A图4 A区域实地调查分类图及3种方法分类结果 |
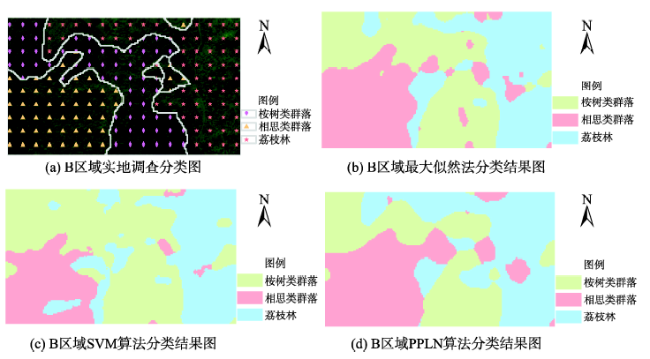
Fig. 5 Investigation classification map and classification result with three methods for region B图5 B区域实地调查分类图及3种方法分类结果 |
Tab. 5 Assessment list of region A′s classification accuracy表5 A区域分类精度评价表 |
| 分类方法 | 类别 | 生产者精度(%) | 用户精度(%) | 总体精度(%) | Kappa系数 |
|---|---|---|---|---|---|
| 最大似然法 | 相思林群落 | 76.01 | 89.30 | 70.0 | 0.64 |
| 浙江润楠群落 | 63.89 | 59.83 | |||
| 鸭脚木群落 | 80.66 | 76.40 | |||
| SVM算法 | 相思林群落 | 80.04 | 84.37 | 78.0 | 0.68 |
| 浙江润楠群落 | 67.15 | 73.22 | |||
| 鸭脚木群落 | 83.01 | 75.42 | |||
| PPLN算法 | 相思林群落 | 80.01 | 87.49 | 80.6 | 0.70 |
| 浙江润楠群落 | 75.24 | 68.15 | |||
| 鸭脚木群落 | 82.83 | 82.06 |
Tab. 6 Assessment list of region B′s classification accuracy表6 B区域分类精度评价表 |
| 分类方法 | 类别 | 生产者精度(%) | 用户精度(%) | 总体精度(%) | Kappa系数 |
|---|---|---|---|---|---|
| 最大似然法 | 桉树林群落 | 78.87 | 65.62 | 72.0 | 0.61 |
| 相思林群落 | 76.98 | 75.24 | |||
| 荔枝林 | 67.12 | 82.30 | |||
| SVM算法 | 桉树林群落 | 62.41 | 91.03 | 73.7 | 0.60 |
| 相思林群落 | 83.41 | 62.72 | |||
| 荔枝林 | 77.43 | 67.92 | |||
| PPLN算法 | 桉树林群落 | 80.05 | 80.64 | 80.7 | 0.71 |
| 相思林群落 | 83.31 | 74.95 | |||
| 荔枝林 | 79.16 | 86.14 |
The authors have declared that no competing interests exist.
| [1] |
[
|
| [2] |
[
|
| [3] |
|
| [4] |
[
|
| [5] |
[
|
| [6] |
|
| [7] |
|
| [8] |
[
|
| [9] |
|
| [10] |
[
|
| [11] |
[
|
| [12] |
[
|
| [13] |
[
|
| [14] |
[
|
| [15] |
[
|
| [16] |
[
|
| [17] |
[
|
| [18] |
[
|
| [19] |
[
|
| [20] |
[
|
| [21] |
[
|
| [22] |
[
|
| [23] |
Jimenez,
|
| [24] |
[
|
| [25] |
[
|
| [26] |
|
| [27] |
[
|
| [28] |
[
|
| [29] |
[
|
| [30] |
|
| [31] |
|
| [32] |
|
/
| 〈 |
|
〉 |