Lithological Mapping by Multiple Reference Spectra Based SAM

  • SHUAI Shuang , 1, 2 ,
  • ZHANG Zhi , 2, * ,
  • WANG Shaojun 2 ,
  • CHEN An 2, 3
Expand
  • 1. Hubei Institute of Land Surveying and Mapping, Wuhan 430010, China
  • 2. China University of Geoscience(Wuhan) Public Administration College, Wuhan 430074, China
  • 3. Wuhan Fourteenth High School, Wuhan 430061, China
*Corresponding author: ZHANG Zhi, E-mail:

Received date: 2015-03-16

  Request revised date: 2015-04-30

  Online published: 2016-01-10

Copyright

《地球信息科学学报》编辑部 所有

Abstract

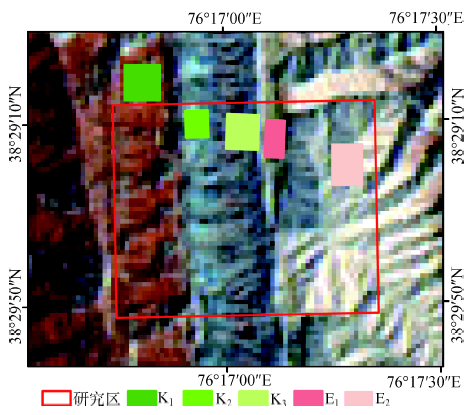
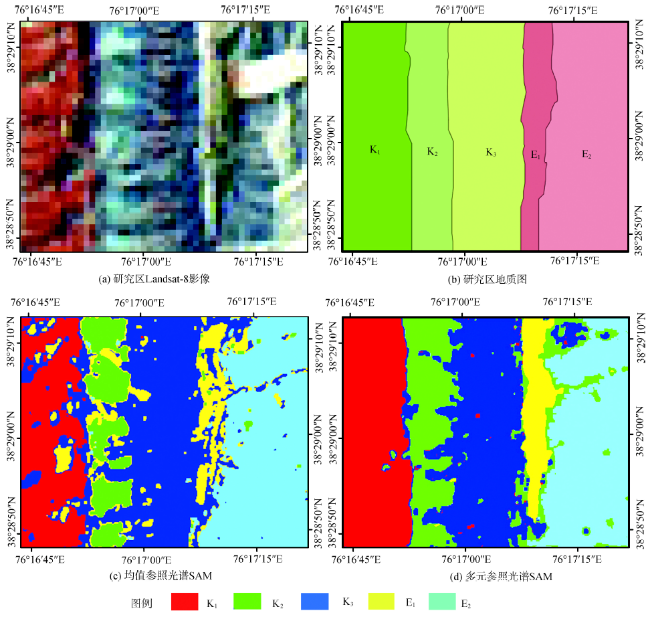
The spectral angle mapper (SAM) is a spectral matching method. This method can determine the types of target objects through quantifying the spectral similarity between a target pixel spectrum and a known reference spectrum.SAM has been widely used in rock type identification that uses multispectral data. In the most existing studies, a mean reflectance spectrum of a specific lithological training area has been used as the reference spectrum for the lithological class in SAM. However, the SAM, which uses the mean spectrum, does not take into account the spectral variability, which is an inherent property of many rocks. Andthe spectral variabilityseriously affects SAM classification results.In order to eliminate the impactof the spectral variability inside the lithological classes, a SAM method based on multiple reference spectra is used in this research. First, a geological map of the study area was used to select training areas forfive lithological classes from the Landsat-8 data of the study area.Then the spectral variability inside the lithological classes and the separability between the lithological classeswereexamined. At last, both ofthe SAM with mean reference spectrum and the multiple reference spectra based SAM wereused in lithological mapping of Landsat-8 data in the study area.The results show that the multiple reference spectra based SAM successfully eliminated the influence of the spectral variability on the SAM with mean reference spectrum, and madesignificant improvement tothe accuracy of lithological mapping.

Cite this article

SHUAI Shuang , ZHANG Zhi , WANG Shaojun , CHEN An . Lithological Mapping by Multiple Reference Spectra Based SAM[J]. Journal of Geo-information Science, 2016 , 18(1) : 133 -140 . DOI: 10.3724/SP.J.1047.2016.00133

1 前言

岩石是矿物的集合体,不同类型岩石、矿物的光谱特征有所差异。遥感图像真实记录了岩石光谱辐射特征[1],是利用遥感图像对矿物信息提取、划分岩性的基础。随着TM、ETM+、ASTER等多光谱遥感数据相继投入使用,国内外学者利用多光谱遥感数据进行了大量的岩石地层划分研究,并取得了巨大进展[2-7]
光谱角制图(SAM)是目前广泛使用的一种岩性划分方法[8-10],利用光谱角来度量影像上目标地物光谱和标准参照光谱的相似程度进而对遥感图像进行分类的一种方法。光谱角制图法的分类精度主要取决于参照光谱库的选择。Hecker等评估了运用不同类型参照光谱库进行SAM分类的效果,发现使用影像像元光谱作为参照光谱库的SAM分类效果优于使用其他类型的参照光谱库(野外实测光谱或实验室标准光谱)[11]。尽管目前已经有了一些使用影像像元光谱作为参照光谱的SAM岩性划分研究[12-14],然而,选择恰当的参照光谱仍是一个值得探讨的问题。
目前的研究中,大都假设待分类岩石单元均具有可区分的光谱特征,并将影像上各岩石单元训练区内像元的均值光谱,作为代表这些岩石单元的参照光谱。事实上,这种将均值光谱作为参照光谱的方法,并未考虑各岩石单元组成的复杂性导致其内部的光谱差异性(Spectral variability)。这种差异性表现为光谱整体形状的变化,吸收谷、反射峰位置的变化及吸收、反射强度的变化。一方面,影像上岩石单元可以是不同种类岩石的组合,而岩石又是多种矿物的集合体,其光谱特征受到组成矿物的成分、化学结构及粒度等因素影响。另一方面,遥感数据的获取过程也放大了这种光谱差异性,例如,传感器的拍摄角度、入射照度及成像时大气状况的影响[10]。SAM对光谱曲线形状敏感,但基本不受反射率强度的影响,在进行SAM岩性划分时,由于岩石单元内部像元光谱形状的变化性、吸收谷、反射峰位置的变化,以及吸收反射强度的变化,使均值光谱(Mean spectrum)难以代表岩石单元内部所有像元,也可能导致一些岩石单元的均值光谱难以区分,进而影响SAM的分类精度。因此,探究消除SAM岩性划分中岩石光谱的差异影响显得尤为重要。

2 SAM岩性划分的思路与方法

已有研究表明,使用图像像元光谱作为参照光谱库,进行SAM分类可获得更好的分类效果[11]。本研究使用2种图像像元选取参照光谱库的SAM方法进行岩性划分:(1)将影像上各岩石单元训练区内所有像元的均值光谱,作为参照光谱对影像进行SAM岩性划分,称为均值参照光谱库的SAM岩性划分(SAM with mean reference spectrum);(2)选取各岩石单元训练区内多像元光谱作为参照光谱,对影像进行SAM岩性划分,称为多元参照光谱库的SAM岩性划分(Multiple reference spectra based SAM)。在进行SAM分类前,首先对影像进行必要的预处理;其次根据地质图资料和岩石地层影像特征,在遥感影像上选取各岩石单元训练区,并验证各训练区内像元光谱的差异性,计算各训练区间的样本可分离性;最后,按照上述2种方法分别进行岩性划分实验,并评价划分精度。

2.1 均值参照光谱库的SAM岩性划分方法

SAM是利用图像像元的光谱角度信息,对图像进行分类的一种监督分类算法。算法中多光谱影像的每个像元光谱都是一个n维向量,维数n是多光谱影像的波段数。SAM算法是利用计算待分类像元光谱和参照光谱间的光谱角度,以判断它们的相似程度。二者间光谱角度越小越相似。
目标像元光谱和参照光谱间的光谱角度的计算公式如式(1):
α = co s - 1 i = 1 n a i b i i = 1 n a i 2 1 2 i = 1 n b i 2 1 2 (1)
式中:n代表多光谱数据的波段数;ai为待分类像元第i波段的反射率值;bi为参照光谱第i波段的反射率值。
均值参照光谱库的SAM岩性划分方法,是使用岩石单元训练区内所有像元的均值光谱作为参照光谱与待分类像元光谱进行光谱角计算,若光谱角度小于设定的阈值,则认为该待分类像元属于该岩石单元,否则将目标像元归入背景值或其他类别。若待分类岩石单元为多个,则计算待分类像元与各岩石单元的均值光谱间的光谱角度,将其归入与之角度最小的岩石单元。

2.2 多元参照光谱库的SAM岩性划分方法

由于影像上岩石单元组成的复杂性,岩石单元内部像元的光谱特征往往存在差异[15],而均值参照光谱库的SAM岩性划分方法没有考虑该差异。Cho[16]、Murphy[10]和Zhang[1]等使用多影像像元光谱库来替代均值参照光谱库,并使用最小角度原则在高光谱影像上,分别对植被和岩石单元进行SAM分类,成功改进了分类效果。但这种方法在多光谱影像上的分类效果并未得到验证。
多元参照光谱库的SAM岩性划分方法的具体思路为:首先,将待分类像元光谱与某岩石单元训练区内,所有像元光谱进行光谱角运算;然后,在获得的光谱角中求最小值作为待分类像元与该岩石岩石单元的代表光谱角;最后,在待分类像元与所有岩石单元的代表光谱角集合中求得最小代表光谱角,并与预先设定的阈值作比较,若小于阀值,则认为待分类像元属于该岩石单元。具体算法过程如下。
假如某岩石单元训练区中有n个像元,即参照光谱库 b = { b 1 , b 2 , b 3 , , b n } 。那么待分类像元光谱向量a与参照光谱库中某一光谱向量bi间的光谱角ai计算如式(2)所示。
α i a , b i = co s - 1 a b i a b i (2)
待分类像元与该岩石单元间的代表光谱角 α ( a , b ) 可由式(3)表示。
α a , b = min α 1 a , b 1 , α 2 a , b 2 , , α n a , b n (3)
式中: min [ ] 代表求待分类像元光谱向量a与参照光谱库b中所有光谱向量间光谱角度的最小值。

2.3 岩性划分训练区优化

在实际研究中,由于混合像元现象严重,在Landsat-8影像上选取的岩石单元训练区内可能存在一些异常像元,这些异常像元会对图像像元光谱的SAM分类结果造成很大影响。所以,需对训练区内像元进行筛选,剔除异常像元,完成对训练区的优化。
训练区的优化通过设定阈值对初选的训练区内像元进行筛选实现。具体过程:将训练区内某像元c与训练区内其他像元一一计算光谱角度,在计算获取的所有光谱角中求得最小值 c min ;将 c min 与设定的阈值作比较,若 c min 小于阈值,则通过筛选,若 c min 大于阈值,则认为像元c为异常像元,并将其剔除。需要说明的是,为了统一标准,训练区优化过程设定的阈值与随后的SAM分类过程中设定的阈值相同。

2.4 光谱差异(Spectral variability)及样本可分离性(Separability)分析

对于将图像像元光谱作为参照光谱的SAM岩性分类方法,影像岩石单元内部像元光谱曲线形状的变化及吸收谷、反射峰的位置变化(光谱差异),以及各影像岩石单元间的样本可分离性会影响SAM岩性分类的精度。所以,在进行SAM岩性分类之前,要对各岩石单元内部的光谱差异,以及各岩石单元间的样本可分离性进行检验。岩石单元内部的光谱差异通过计算影像上岩石单元训练区内像元间光谱角度的标准差和均值来反应,而岩石单元间的可分离性由J-M距离来表现。J-M距离是广泛使用的度量遥感类别的可分离性指标。J-M距离公式定义为式(4):
B ij = 1 2 ( M i - M j ) T V i + V j ) 2 - 1 ( M i - M j ) + 1 2 ln ( V i + V j ) 2 V i V j (4)
J M ij = 2 ( 1 - e - B ij ) (5)
式中:ViVji类别和j类别的矩阵样本协方差;MiMj为对应的样本均值向量;Bij为Bhattacharyya距离;JMij为类别i和类别jJ-M距离。
2个类别间J-M距离越接近2.0可分性越好。一般来说,J-M距离大于1.90,认为2个类别可分性良好;如果J-M距离小于1.0,则认为2个类别可分性差。

3 Landsat-8影像的SAM岩性划分分析

3.1 岩性划分研究区地理特征

研究区位于新疆喀什市阿克陶县克孜勒乡,区内岩石地层出露良好,气候干燥少雨,植被覆盖度很低,有利于遥感影像地层划分。数据源自2013年6月3日采集的Landsat-8数据。Landsat-8数据包含了ETM+传感器所有的波段,为了尽量消除大气吸收的影响,进行了逐波段的重新调整,调整比较大的是Band 5(0.845~0.885 μm),排除了0.825 μm处水汽吸收特征。此外,Landsat-8新增了用于海岸带观测的深蓝波段和用于云检测的短波红外波段。

3.2 岩石单元分区及训练区选取

依据1:25万英吉沙幅(J43C002003)区域地质调查资料,对研究区进行了岩石单元分区。将岩石单元分区图与Landsat-8影像套合,裁剪出研究区影像,共2989个像元。同时,根据岩石单元分区图,在影像上选取了各岩石单元的训练区,选择训练区时避免在各岩石单元间的过渡地带选取。具体岩性训练区选取情况如图1所示。
Fig. 1 The choice of lithological training areas

图1 岩石单元训练区的选择

3.3 光谱差异和样本可分离性分析

由于各岩石单元训练区内部像元的光谱差异和训练区间的样本可分离性,对影像像元光谱的SAM分类结果有重要影响,故需先对各训练区内部像元的光谱差异和训练区间的样本可分离性进行分析。
3.3.1 光谱差异分析
图2为在Landsat-8影像上选取的5个岩石单元训练区内所有像元的光谱曲线和均值光谱曲线。从图2可看出,岩性训练区内各像元的光谱曲线无论从形状和量级都有一定差异。SAM的分类效果主要受光谱曲线形状变化的影响,而受到反射率量级变化的影响较小。图2中岩石单元K1、K3、E2内部像元的光谱曲线反射率量级差距较大,但光谱曲线形状比较相似,在SAM分类中受影响较小。岩石单元K2内部像元的光谱曲线无论形状还是反射率量级都有较大差异。岩石单元E1内部像元光谱曲线的形状和反射率量级,在可见光到近红外波段比较近似,但在短波红外波段差异比较大。所以,岩石单元K2和E1在SAM分类中受影响可能较大。另外,岩石单元训练区内像元光谱与其均值光谱的差异都较大,所以,在利用均值光谱作为参照光谱进行SAM岩性分类时,分类精度可能都会受到一定影响。
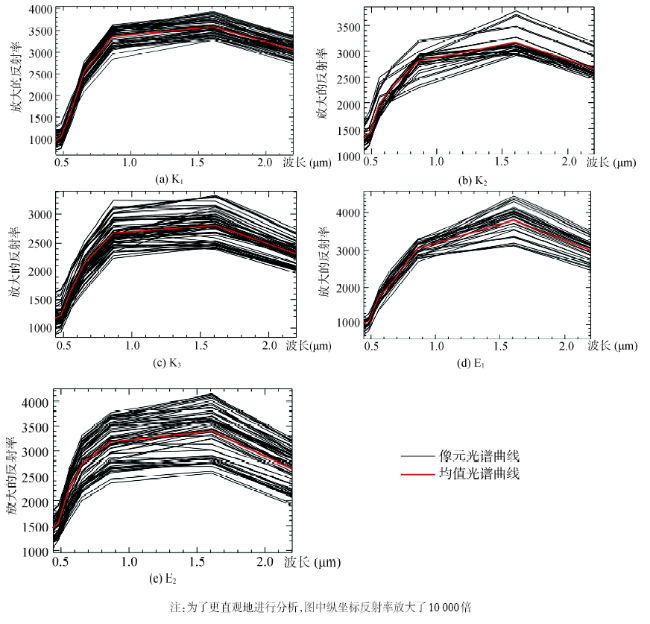
Fig. 2 The mean spectral curves and pixels’ spectral curves of different lithological training areas

图2 各岩石单元训练区像元光谱曲线和均值光谱曲线

表1为各岩石单元训练区内像元间光谱角度均值及标准差的计算结果。像元间光谱角度均值和标准差越大则说明该岩石单元训练区内部像元光谱差异大。表中可看出,K2与E1的光谱角均值和标准差分别达到了3.2127、1.6973以及3.4711、1.8437,大于其他岩石单元,说明这2个岩石单元内部的光谱差异相对较大。在均值参照光谱的SAM分类中这2个岩石单元的分类效果可能会受到影响。
Tab. 1 The mean angle and standard deviation between pixels of different lithological training areas

表1 各岩石单元训练区内像元间光谱角均值、标准差表

K1 K2 K3 E1 E2
均值 2.5742 3.2127 2.7956 3.4711 2.7143
标准差 1.4546 1.6973 1.2803 1.8437 1.4631
3.3.2 样本可分离性分析
表2为各岩石单元训练区间的J-M距离。从表2可看出,大部分训练间的J-M距离均大于1.90,可分性很好,只有K2与K3J-M距离为1.869,小于1.90,可分性一般,这是由于K2和K3同属英吉沙群的2个组,岩性分别为页岩互层和泥岩互层,比较近似。
Tab. 2 The J-M values of different lithological training areas

表2 各岩石单元间J-M距离

J-M距离 K1 K2 K3 E1 E2
K1 1.989 1.998 1.993 2.000
K2 1.989 1.869 1.960 1.995
K3 1.998 1.869 1.989 1.981
E1 1.993 1.960 1.989 2.000
E2 2.000 1.995 1.981 2.000

3.4 训练区优化

通过计算各岩石单元训练区内像元间的光谱角度,并设定阈值将其他像元光谱角度值过大的像元剔除,从而完成对各岩石单元训练区的优化。各岩石单元训练区优化情况如表3所示。由于对各岩石单元训练区像元进行筛选时,所使用的光谱角度阈值是相同的,可看出E1的像元剔除率最大。
Tab. 3 The optimization of different lithological training areas

表3 各岩石单元训练区像元优化情况

训练区 K1 K2 K3 E1 E2
原始像元数 64 30 64 36 63
剩余像元数 60 28 55 27 55
像元剔除率(%) 6.25 6.67 14.06 25.00 12.70

3.5 2种SAM方法岩性划分结果及精度评价

图3为研究区Landsat-8影像、地质图,以及采用均值参照光谱库和多元参照光谱库的SAM岩性划分实验结果图。2种分类方法分类精度如表4所示。从图3可看出,2种方法的岩性划分结果图,都反映了研究区岩石单元分布的基本形态。表4中多元参照光谱的SAM岩性划分结果的总体分类精度和kappa系数为86.4557%和0.825,均高于均值参照光谱库的SAM岩性划分结果的76.8057%和0.6989。
Tab. 4 Confusion matrices of the classification results of two SAM methods

表4 2种SAM岩性划分结果精度评价

类别 均值参照光谱库的SAM 多元参照光谱库的SAM
生产者精度(%) 用户精度(%) 生产者精度(%) 用户精度(%)
K1 68.21 95.98 93.39 96.93
K2 58.80 92.98 80.03 63.44
K3 89.07 64.48 89.43 80.44
E1 45.21 34.78 72.10 93.66
E2 91.40 90.96 85.11 98.06
总体精度 76.8057 86.4557
Kappa系数 0.6989 0.8250
Fig. 3 The classifications effects of two SAM methods

图3 2种SAM方法的分类效果图

从单个岩石单元来看,对于岩石单元K1、K3、E1,无论是用户精度还是生产者精度,多元参照光谱库的SAM分类结果优于均值参照光谱库的SAM分类结果。例如,岩石单元K1,多元参照光谱库的SAM分类结果的生产者精度和用户精度分别提高了25.18%和0.95%。从分类效果来看,均值参照光谱库的SAM分类结果图中,K1山体阴坡的像元出现大量的误分,这是由于K1均值光谱曲线与阴坡像元光谱曲线有一定差距,而使用多像元光谱作为参照光谱则大大减少了这些误分,分类精度显著提高。再如岩石单元E1,生产者精度和用户精度分别提高了26.89%和58.88%。均值参照光谱库的SAM分类结果中E1中有较多像元被误分为K3,岩石单元整体形态也与地质图中E1形态差距较大,而多元参照光谱库的SAM分类结果中岩石单元E1内部较均一,整体形态也与地质图中相符。对于岩石单元K3,均值参照光谱库的SAM划分结果图中K1山体的阴坡有较多像元被误分为K3,而多元参照光谱库的SAM类型结果则解决了这一问题,进而用户精度显著提高。但2种方法的分类结果中K3与K2的都有较大程度的混分,这是由于K2、K3同属英吉沙群,岩性上又比较接近,这与上述样本可分离性分析的结果也相符。
对于岩石单元K2,多元参照光谱库的SAM分类结果的生产者精度从58.80%提高到80.03%,而用户精度从92.98%下降到63.44%。从分类效果图3(c)可看出,均值参照光谱库的SAM分类结果中K2在岩层走向是不连续的,阴坡上大量像元被误分为E1、K3,是受到了地形和岩性相似的影响,而多元参照光谱库SAM分类效果图图3(d)中K2在走向上基本连续,保持了岩石单元在空间上的连续性,分类效果有所改善。对于岩石单元E2,多元参照光谱库的SAM分类结果的生产者精度有所提高,而用户精度有所下降。从分类效果图上看,2种分类方法都反映了E2的基本形态特征,岩石单元内部也比较均一,分类效果都比较好。多元参照光谱库的SAM分类图中,北部山体的阴坡和较深的一条沟谷中有较多像元被误分为K2和K3,这也导致了K2的用户精度和E2生产者精度有所降低。
结合上述光谱差异分析的结果,光谱差异较小的K3,E2在2种分类方法中都取得了较高的分类精度和较好的分类效果;光谱差异最大的E1在使用均值参照光谱库的SAM分类结果中分类效果最差,分类精度最低。而对比采用多元参照光谱库的SAM分类结果中可看出,E1的分类效果和分类精度改善最大。一方面说明了均值参照光谱库的SAM分类方法,很大程度上受岩石单元内部的光谱差异影响;另一方面表明了多元参照光谱库的SAM分类方法,很大程度解决了岩石单元内部光谱差异的影响,改善了分类效果。但光谱差异较小的K1,在均值参照光谱的分类结果中分类效果较差,反映出这种方法一定程度上受地形的影响。
综上可知,多元参照光谱库的SAM岩性分类方法较好地克服了岩石单元内部光谱差异,对于均值参照光谱库的SAM分类方法的影响,岩性划分精度显著提高。然而,仍未能完全解决地形对于岩性划分的影响,均值参照光谱的分类结果图中K1阴坡的误分情况得以改善,但K2阴坡及E2沟谷和阴坡上的像元,在2种分类方法结果图中都出现了不同程度的误分。这是下一步研究需解决的关键问题。

4 结论

光谱差异表现为岩石单元内部像元光谱曲线形状的变化,吸收谷、反射峰的位置的变化及吸收、反射强度的变化,这些都会对影像像元光谱的SAM岩性分类精度造成影响。此前SAM的岩性分类研究中,大都采用影像上各岩石单元训练区内像元的均值光谱,作为参照光谱库进行岩性划分。然而,岩石单元内部的光谱差异使训练区的均值光谱不能代表岩石单元内部所有像元的光谱特征。通过对研究区影像上5种岩石单元的光谱差异分析,表明了5种岩石单元内部均存在不同程度的光谱差异,岩石单元内部像元的光谱曲线无论从形状上还是吸收、反射强度上都有所差异,同时各岩石单元训练区的均值光谱也与各像元光谱存在很大差异。
前人提出使用训练区多像元光谱作为参照光谱库进行SAM分类,并在高光谱影像上对植被和岩石作分类实验,取得了良好的效果。本文首次使用这种多元参照光谱库的SAM分类方法,在多光谱影像上进行岩性划分,并与均值参照光谱库的SAM岩性划分结果进行了对比。结果显示,多元参照光谱库的SAM岩性划分方法较好地克服了岩石单元内部的光谱差异,与均值参照光谱库的SAM方法相比,这种方法对岩石单元内各个像元更有代表性。经过2种分类方法对研究区影像的岩性分类效果与精度对比,认为均值参照光谱库的SAM分类方法,很大程度上受岩石单元内部的光谱差异影响,而多元参照光谱库的SAM分类方法,较好地解决了这种差异影响,改善了分类效果。但是,本文在利用SAM算法进行岩性划分时,光谱角阈值的选择是通过经验值确定的,具有一定的盲目性,同时,2种方法不同程度上均受地形的影响。因此,定量分析光谱角阈值的选取,应尽可能消除SAM岩性分类中地形的干扰,这是有待今后深入研究的问题。

The authors have declared that no competing interests exist.

[1]
Zhang X Y, Li P J.Lithological mapping from hyperspectral data by improved use of spectral angle mapper[J]. International Journal of Applied Earth Observation and Geoinformation, 2014,31:95-109.The spectral angle mapper (SAM), as a spectral matching method, has been widely used in lithological type identification and mapping using hyperspectral data. The SAM quantifies the spectral similarity between an image pixel spectrum and a reference spectrum with known components. In most existing studies a mean reflectance spectrum has been used as the reference spectrum for a specific lithological class. However, this conventional use of SAM does not take into account the spectral variability, which is an inherent property of many rocks and is further magnified in remote sensing data acquisition process. In this study, two methods of determining reference spectra used in SAM are proposed for the improved lithological mapping. In first method the mean of spectral derivatives was combined with the mean of original spectra, i.e., the mean spectrum and the mean spectral derivative were jointly used in SAM classification, to improve the class separability. The second method is the use of multiple reference spectra in SAM to accommodate the spectral variability. The proposed methods were evaluated in lithological mapping using EO-1 Hyperion hyperspectral data of two arid areas. The spectral variability and separability of the rock types under investigation were also examined and compared using spectral data alone and using both spectral data and first derivatives. The experimental results indicated that spectral variability significantly affected the identification of lithological classes with the conventional SAM method using a mean reference spectrum. The proposed methods achieved significant improvement in the accuracy of lithological mapping, outperforming the conventional use of SAM with a mean spectrum as the reference spectrum, and the matching filtering, a widely used spectral mapping method.

DOI

[2]
李培军. 用ASETR图像和地统计学纹理进行岩性分类[J].矿物岩石,2004(3):116-120.运用新获取的ASTER数据可以对岩性进行识别与分类:首先运用地统计学中的变差函数来计算分析几种选定的岩性单元的灰度值空间变化特征;运用ASTER数据的可见光一近红外波段、短波红外(SWIR)波段以及二者的组合进行岩性的分类,分析分类精度的变化。用变差函数作为纹理的计算函数来提取图像纹理,并与原始的光谱数据结合,进行岩性的分类。结果表明,与单纯的光谱分类相比,加入纹理信息可显著改善分类精度;用不同方向的滞后距离提取的图像纹理对图像的分类结果有一定的差异,尤其是对存在明显的各向异性的岩石单元。

DOI

[ Li P J.Lithological discrimination using ASTER image and geostatistical texture[J]. Mineral Petrol, 2004,3:116-120. ]

[3]
余海阔,李培军.运用LANDSAT ETM+和ASTER数据进行岩性分类[J].岩石学报,2010(1):345-350.本文评价了运用ASTER和LANDSAT ETM+数据进行岩性制图的性能。分别利用ASTER数据不同波段区图像及其组合,以及ETM+数据进行岩性分类,并探讨了将ASTER和ETM+数据叠加在一起进行了岩性分类;利用现有地质图对所有分类结果进行了定量评价。结果表明,ASTER数据不同波段的岩性识别能力不同,并且较ETM+数据能更准确地识别岩性。更重要的是,把ASTER与ETM+数据结合在一起进行岩性分类,可获得比用任一数据单独分类更高的分类精度,表明二者的光谱特征具有一定的互补性。

[ Yu K H, Li P J.Lithologic Mapping Using LANDSAT ETM+ and ASTER Data. Acta Petrologica Sinica, 2010,1:345-350. ]

[4]
宋晚郊,张绪教,高万里,等.东昆仑造山带巴颜喀拉山群ASTER岩性信息提取[J].现代地质,2013,1:116-123.巴颜喀拉山群在东昆仑地区分布广泛,岩性复杂,准确划分其岩性对 巴颜喀拉山群的地层划分及构造属性的研究具有重要意义.对东昆仑造山带巴颜喀拉山群地区ASTER图像进行几何校正和大气校正后,通过主成分分析和矿物指 数等岩性信息提取方法,获得主成分分析及比值图像;根据不同地质体的影像特征并结合野外地质调查,对研究区的巴颜喀拉山群进行了岩性段的划分.研究发现: 分布于南部的上巴颜喀拉山群(T3by)岩性相对单一,主要为灰-深灰色粉砂质板岩和砂岩,在影像上特征不明显,所以仍将其划分为2个岩性段;而分布于研 究区北部的原下巴颜喀拉山群(T1by),影像上色调纹理特征差异较大,由此将原来的2段细化分为4段,a段主要为深灰色粉砂岩和千枚岩,b段为灰绿色细 砂岩,c段为黄褐色细砂岩,d段为深灰色细砂岩夹板岩.研究结果较好地体现了遥感技术在高原区域岩性划分中的优点,同时为巴颜喀拉山群地层的对比提供了参 考.

DOI

[ Song W J, Zhang X J, Gao W L, et al.Extraction of lithological information from Bayan Har mountain group of east kunlun orogenic belt using ASTER image. Geoscience, 2013,1:116-123. ]

[5]
Lawrence C R.Lithologic mapping in the Mountain Pass, California area using Advanced Spaceborne Thermal Emission and Reflection Radiometer (ASTER) data[J]. Remote Sensing of Environment, 2003,84:350-366.Evaluation of an Advanced Spaceborne Thermal Emission and Reflection Radiometer (ASTER) image of the Mountain Pass, California area indicates that several important litbologic groups can be mapped in areas with good exposure by using spectral-matching techniques. The three visible and six near-infrared bands, which have 15-m and 30-m resolution, respectively, were calibrated by using in situ measurements of spectral reflectance. Calcitic rocks were distinguished from dolomitic rocks by using matched-filter processing in which image spectra were used as references for selected spectral categories. Skarn deposits and associated bright coarse marble were mapped in contact metamorphic zones related to intrusion of Mesozoic and Tertiary granodioritic rocks. Fe-muscovite, which is common in these intrusive rocks, was distinguished from Al-muscovite present in granitic gneisses and Mesozoic granite. Quartzose rocks were readily discriminated, and carbonate rocks were mapped as a single broad unit through analysis of the 90-m resolution, five-band surface emissivity data, which is produced as a standard product at the EROS Data Center. Three additional classes resulting from spectral-angle mapper processing ranged from (1) a broad granitic rock class (2) to predominately granodioritic rocks and (3) a more mafic class consisting mainly of mafic gneiss, amphibolite and variable mixtures of carbonate rocks and silicate rocks. (C) 2002 Elsevier Science Inc. All rights reserved.

DOI

[6]
Lawrence C R.Lithologic mapping of the Mordor, NT, Australia ultramafic complex by using the Advanced Spaceborne Thermal Emission and Reflection Radiometer (ASTER)[J]. Remote Sensing of Environment, 2005,99:105-126.ASTER TIR spectral emittance data and laboratory emissivity measurements document a wide wavelength range of Si-O spectral features, which reflect the lithological diversity of the Mordor ultramafic complex and adjacent rocks. SAM processing of the spectral emittance data distinguished 2 classes representing the mafic–ultramafic rocks and 4 classes comprising the quartzose to intermediate composition rocks. Utilization of the complementary attributes of the spectral reflectance and spectral emittance data resulted in discrimination of 4 mafic–ultramafic categories; 3 categories of alluvial–colluvial deposits; and a significantly more completely mapped quartzite unit than could be accomplished by using either data set alone.

DOI

[7]
Zhang XF.Lithologic and mineral imformation extraction for gold exploration using Aster data in the south chocolate mountains(California)[J]. Journal of Photogrammetry &Remote Sensing, 2007,62:271-282.

[8]
Kruse F A, Lefkoff A B, Boardman J W, et al.The spectral image processing system (SIPS)-interactivevisualization and analysis of imaging spectrometer data[J]. Remote Sensing of Environment, 1993,44:145-163.The Center for the Study of Earth from Space (CSES) at the University of Colorado, Boulder, has developed a prototype interactive software system called the Spectral Image Processing System (SIPS) using IDL (the Interactive Data Language) on UNIX-based workstations. SIPS is designed to take advantage of the combination of high spectral resolution and spatial data presentation unique to imaging spectrometers. It streamlines analysis of these data by allowing scientists to rapidly interact with entire datasets. SIPS provides visualization tools for rapid exploratory analysis and numerical tools for quantitative modeling. The user interface is X-Windows-based, user friendly, and provides point and click' operation. SIPS is being used for multidisciplinary research concentrating on use of physically based analysis methods to enhance scientific results from imaging spectrometer data. The objective of this continuing effort is to develop operational techniques for quantitative analysis of imaging spectrometer data and to make them available to the scientific community prior to the launch of imaging spectrometer satellite systems such as the Earth Observing System (EOS) High Resolution Imaging Spectrometer (HIRIS).

DOI

[9]
Crosta A P, Sabine C, Taranik J V.Hydrothermal alteration mapping at Bodie,California, using AVIRIS hyperspectraldata[J]. Remote Sensing of Environment, 1998,65:309-319.AVIRIS data covering the Bodie and neighboring Paramount mining districts, eastern California, were used to map hydrothermal alteration minerals. Two spectral analysis algorithms were used: Spectral Angle Mapper (SAM) and Tricorder. The objective was to compare the performance of the two algorithms where no ground or atmospheric information is available. AVIRIS data were calibrated to apparent surface reflectance using a modified MODTRAN radiative transfer model in conjunction with laboratory and in-flight calibration data. Both algorithms appear to produce satisfactory results for geologic reconnaissance and mapping applications, but Tricor- der generally classified more pixels and identified more mineral species than SAM. For some minerals, such as Na-montmorillonite, results from Tricorder and SAM matched reasonably well, but major differences appeared in how the two algorithms classified kaolinite group minerals and ferric oxides. Laboratory spectra of rock samples from five localities were compared to reference spectra of minerals identified by the classification algorithms for corresponding pixels, with the results matching to some extent.

DOI

[10]
Murphy RJ, Monteiro ST, Schneider S.Evaluating classification techniques for mapping vertical geology using field-based hyperspectral sensors[J]. IEEE Transactions on GeoscienceAndRemote Sensing, 2012,50:3066-3080.Hyperspectral data acquired from field-based platforms present new challenges for their analysis, particularly for complex vertical surfaces exposed to large changes in the geometry and intensity of illumination. The use of hyperspectral data to map rock types on a vertical mine face is demonstrated, with a view to providing real-time information for automated mining applications. The performance of two classification techniques, namely, spectral angle mapper (SAM) and support vector machines (SVMs), is compared rigorously using a spectral library acquired under various conditions of illumination. SAM and SVM are then applied to a mine face, and results are compared with geological boundaries mapped in the field. Effects of changing conditions of illumination, including shadow, were investigated by applying SAM and SVM to imagery acquired at different times of the day. As expected, classification of the spectral libraries showed that, on average, SVM gave superior results for SAM, although SAM performed better where spectra were acquired under conditions of shadow. In contrast, when applied to hypserspectral imagery of a mine face, SVM did not perform as well as SAM. Shadow, through its impact upon spectral curve shape and albedo, had a profound impact on classification using SAM and SVM.

DOI

[11]
Hecker C, van der Meijde M, van der Werff H, et al. Assessingthe influence of reference spectra on synthetic SAM classification results[J]. IEEETransactions on Geoscience and Remote Sensing, 2008,46:4162-4172.Spectral matching algorithms, such as the Spectral Angle Mapper (SAM), utilize the spectral similarity between individual image pixel spectra and a spectral reference library with known components. Here, we illustrate and quantify the effects that different sources of reference libraries have on SAM classification results. Synthetic images of three mineral endmembers were classified by using reference libraries derived from airborne hyperspectral imagery, ground spectra (Portable Infrared Mineral Analyser), and from a standard library (United States Geologic Survey). Results show that the source of the reference library strongly influences the classification results if all available wavelengths are used. This effect can be partially neutralized by using appropriate preprocessing methods. Two different types of spectral subsetting of the data, two types of continuum removal, and a combination thereof were tested. Best results were achieved by using a feature subset (i.e., limiting the input wavelengths to the diagnostic absorption features). This increased the average classification accuracy from 74% to 95% (ground spectral library) and from 68% to 94% (standard library).

DOI

[12]
Bowers T L, Rowan L C.Remote mineralogic and lithologic mapping of theice river alkaline complex, British Columbia, Canada, using AVIRIS data[J]. Photogrammetric Engineering &. Remote Sensing, 1996,62:1379-1386.The Ice River Alkaline Complex is a late Paleozoic intrusion of mafic alkaline racks, syenite, and carbonatite exposed in southeastern British Columbia, Canada. The complex intrudes Cambrian and Ordovician shales, slates, and limestones of the Chancellor and Ottertail Formations and the McKay Group. We examined the alkaline complex and adjacent country rocks using Airborne Visible-infrared imaging Spectrometer (AVIRIS) data. The data were first calibrated to relative reflectance and then used to spectrally map mineralogies in the study area by using a linear spectral unmixing program. This technique models each pixel spectrum in an AVIRIS image as a linear combination of unique endmember spectra. We selected endmember spectra from well-exposed and spectrally distinct mineralogic units, vegetation, and snow. Four of the endmembers reflect mineralogic variations within the McKay group in the study area, and may represent lateral and vertical variations of sedimentary or metamorphic facies. Otherwise, the resultant spatial distribution of endmembers shows generally close agreement with the published geologic map, although, in several places, our image-map is more accurate than the published map.

DOI

[13]
Chen X F, Warner T A, Campagna D J.Integrating visible, near-infrared andshort-wave infrared hyperspectral and multispectral thermal imagery for geo-logical mapping at Cuprite, Nevada[J]. Remote Sensing Environment, 2007,110:344-356.This study investigated the potential value of integrating hyperspectral visible, near-infrared, and short-wave infrared imagery with multispectral thermal data for geological mapping. Two coregistered aerial data sets of Cuprite, Nevada were used: Airborne Visible/Infrared Imaging Spectrometer (AVIRIS) hyperspectral data, and MODIS/ASTER Airborne Simulator (MASTER) multispectral thermal data. Four classification methods were each applied to AVIRIS, MASTER, and a combined set. Confusion matrices were used to assess the classification accuracy. The assessment showed, in terms of kappa coefficient, that most classification methods applied to the combined data achieved a marked improvement compared to the results using either AVIRIS or MASTER thermal infrared (TIR) data alone. Spectral angle mapper (SAM) showed the best overall classification performance. Minimum distance classification had the second best accuracy, followed by spectral feature fitting (SFF) and maximum likelihood classification. The results of the study showed that SFF applied to the combination of AVIRIS with MASTER TIR data are especially valuable for identification of silicified alteration and quartzite, both of which exhibit distinctive features in the TIR region. SAM showed some advantages over SFF in dealing with multispectral TIR data, obtaining higher accuracy in discriminating low albedo volcanic rocks and limestone which do not have unique, distinguishing features in the TIR region. (c) 2007 Published by Elsevier Inc.

DOI

[14]
Harris J, McGregor R, Budkewitsch P. Geological analysis of hyperspectraldata over southwest Baffin Island: methods for producing spectral maps thatrelate to variations in surface lithologies[J]. Canadian Journal of Remote Sensing, 2010,36:412-435.

[15]
Zhang J, Rivard B, Sanchez-Azofeifa A.Intra- and inter-classspectral variability of tropical tree species at La Selva, Costa Rica: Implicationsfor species identification using HYDICE imagery[J]. Remote Sensing Environment, 2006,105:129-141.

[16]
Cho M A, Debba P, Mathieu R, et al.Improving discrimination of savanna tree species through a multiple-endmember spectral angle mapper approach: canopy-level analysis[J]. IEEE Transactions on Geoscience and Remote Sensing, 2010,48:4133-4142.

DOI

Outlines

/