
Journal of Geo-information Science >
The Application of Multiple Movement Parameters in Trajectory Classification for Moving Objects
Received date: 2015-04-13
Request revised date: 2015-10-10
Online published: 2016-02-04
Copyright
The purpose of trajectory classification is to predict the class labels of unknown trajectories in terms of the trajectory characteristics. Trajectory classification has many real-world applications, for examples: suspicious vehicles identification, illegal fishing vessels detection, transportation mode detection, etc. Currently, most trajectory classification methods only take two movement parameters which are speed and acceleration into account, and only employ simple statistics such as the mean, median and maximum values, thus they can't fully explore the characteristics of trajectories, which leads to relatively low classification accuracy. In order to solve this problem, based on a thorough literature review on movement parameters and quantitative statistics, this paper proposes a trajectory classification method based on the movement characteristics of moving objects. For movement parameters of velocity, acceleration, sinuosity, direction and turning angle, this method employs statistics such as skewness, kurtosis, coefficient of variation and autocorrelation from time series analysis to construct discriminative global features. In addition, this method extracts local features from sub-trajectories after trajectory segmentation. For direction and turning angle, this method incorporates directional statistics to compute their features accurately. The experimental results of this method based on three real trajectory datasets including vessel, wild animal and hurricane datasets, indicate that the classification accuracies of this method are 100%, 80% and 71.43% respectively. The experiments verify the movement features constructed in this paper are discriminative and effective.
ZHU Jin , JIANG Nan , HU Bin . The Application of Multiple Movement Parameters in Trajectory Classification for Moving Objects[J]. Journal of Geo-information Science, 2016 , 18(2) : 143 -150 . DOI: 10.3724/SP.J.1047.2016.00143
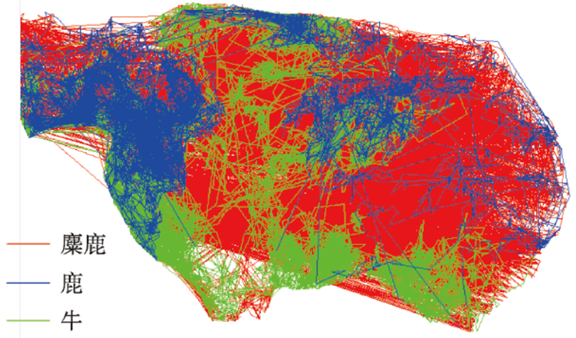
Fig. 1 Animal dataset including three types of animals图1 3种动物的轨迹数据集 |
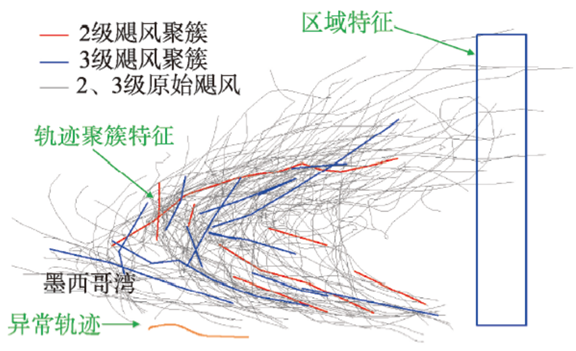
Fig. 2 Hurricane dataset, including scale 2 and scale 3 hurricanes图2 飓风数据集(包含2、3级飓风) |
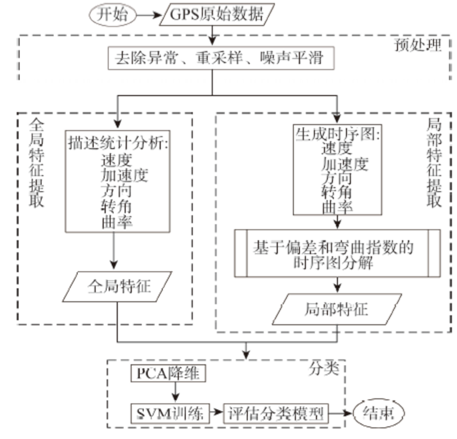
Fig. 3 Trajectory classification according to global and local movement characteristics图3 利用全局和局部运动特征进行轨迹分类 |
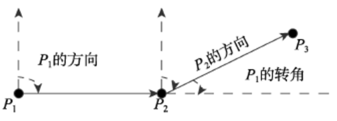
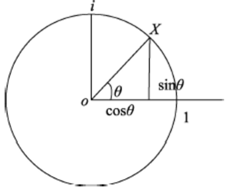
Fig. 4 Direction and turning angle图4 方向和转角 |
Fig. 5 The direction representation of using angle图5 通过角表示的方向 |
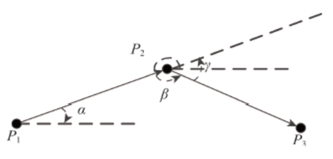
Fig. 6 Calculation of the turning angle图6 转角的计算 |
Tab. 1 Classification accuracy for vessel dataset表1 船舶数据集的分类精度 |
| 特征 | RB-TB | G1(L) | L1(L) | G1+L1(L) | G2(L) |
|---|---|---|---|---|---|
| 精度 / (%) | 40 | 80 | 100 | 100 | 100 |
Tab. 2 The meanings of prefixes in statistics表2 统计量前缀的含义 |
| 前缀 | 含义 | 前缀 | 含义 | 前缀 | 含义 |
|---|---|---|---|---|---|
| M1 | 均值 | B1 | 最小值 | AUTO | 自相关系数 |
| M2 | 中值 | B2 | 第二小值 | S | 偏度系数 |
| T1 | 最大值 | B3 | 第三小值 | K | 峰度系数 |
| T2 | 第二大值 | STD | 标准差 | ||
| T3 | 第三大值 | CV | 变异系数 |
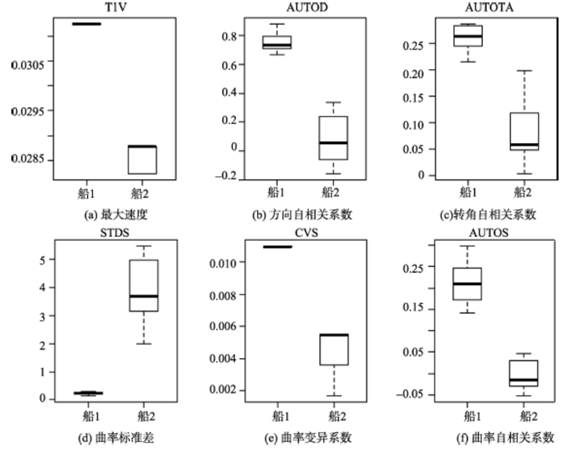
Fig. 7 The boxplots of statistics for vessels图7 船舶数据集运动特征的箱线图 |
Tab. 3 Classification accuracy for wild animal dataset表3 野生动物数据分类精度 |
| 特征 | 精度 / (%) | 特征 | 精度 / (%) |
|---|---|---|---|
| RB-TB | 36.67 | G1(L) | 40 |
| L1(L) | 36.67 | L1(R) | 56.67(21) |
| G1+L1(L) | 40 | G1+L1(R) | 53.33(9) |
| G2(L) | 80 | G2(R) | 43.33(18) |
| G2+L1(L) | 80 | G2+L1(R) | 73.33(18) |
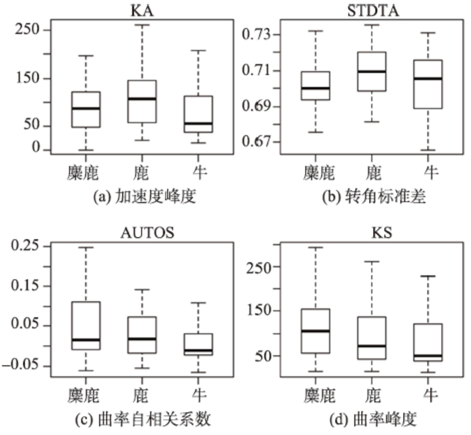
Fig. 8 The boxplots of global features for animals图8 动物数据集全局特征的箱线图 |
Tab. 4 Classification accuracy for hurricane dataset表4 飓风数据集的分类精度 |
| 特征 | 精度 / (%) | 特征 | 精度 / (%) |
|---|---|---|---|
| RB-TB | 50 | G1(L) | 46.43 |
| L1(L) | 46.43 | L1(R) | 71.43 |
| G1+L1(L) | 39.29 | G1+L1(R) | 64.29 |
| G2(L) | 53.57 | G2(R) | 67.86 |
| G2+L1(L) | 57.14 | G2+L1(R) | 71.43 |
The authors have declared that no competing interests exist.
| [1] |
[
|
| [2] |
|
| [3] |
|
| [4] |
[
|
| [5] |
[
|
| [6] |
|
| [7] |
|
| [8] |
|
| [9] |
|
| [10] |
|
| [11] |
|
| [12] |
|
| [13] |
|
| [14] |
|
| [15] |
|
| [16] |
Schuessler N, Axhausen K W. Processing GPS raw data without additional information [R/OL]. [2008-08-27]. .
|
| [17] |
|
| [18] |
|
| [19] |
|
| [20] |
|
| [21] |
|
| [22] |
|
| [23] |
Hsu C, Chang C, Lin C, et al. A practical guide to support vector classification[R/OL]. [2010-04-15]. .
|
| [24] |
|
| [25] |
|
| [26] |
|
/
| 〈 |
|
〉 |