Orginal Article

Precision Estimation of the Average Daily Precipitation Simulated by IPCC AR5 GCMs in China

  • SUN Zhen , 1, 2 ,
  • JIA Shaofeng , 1, * ,
  • LV Aifeng 1 ,
  • ZHU Wenbin 1, 2 ,
  • GAO Yanchun 1
Expand
  • 1. Key Laboratory of Water Cycle and Related Land Surface Processes, Institute of Geographic Sciences and Natural Resources Research, CAS, Beijing 100101, China
  • 2. University of Chinese Academic of Sciences, Beijing 100049, China
*Corresponding author: JIA Shaofeng, E-mail:

Received date: 2015-04-16

  Request revised date: 2015-06-04

  Online published: 2016-02-04

Copyright

《地球信息科学学报》编辑部 所有

Abstract

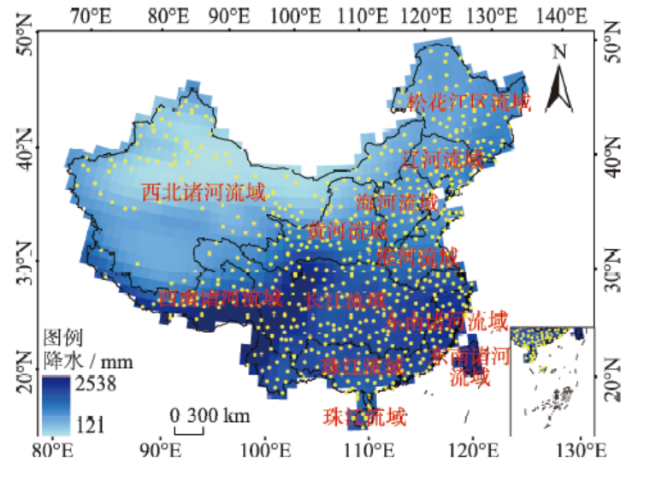
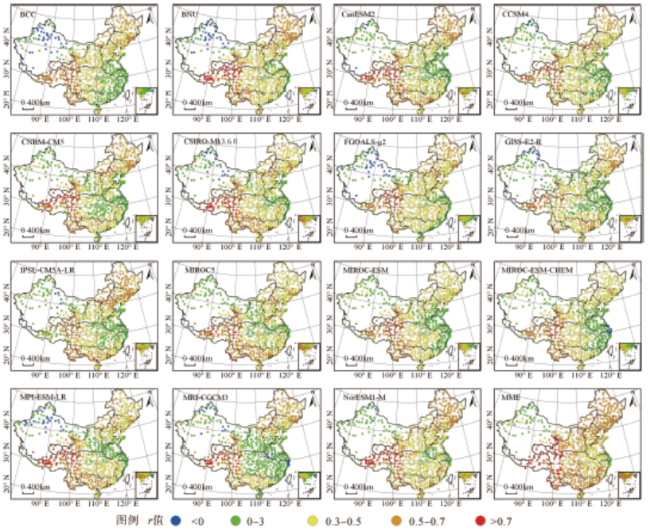
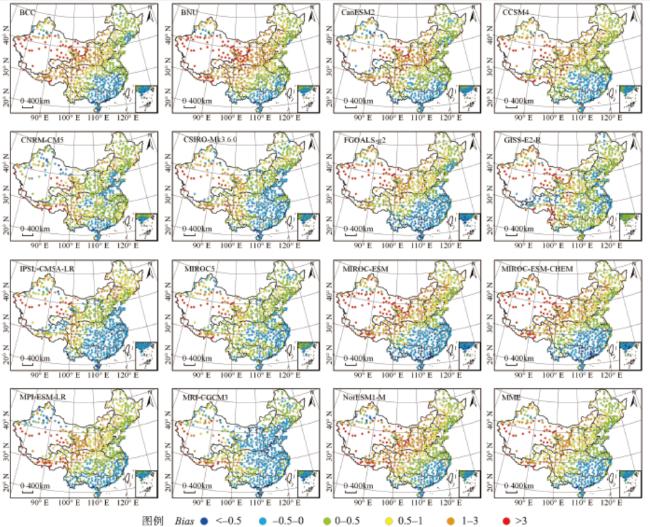
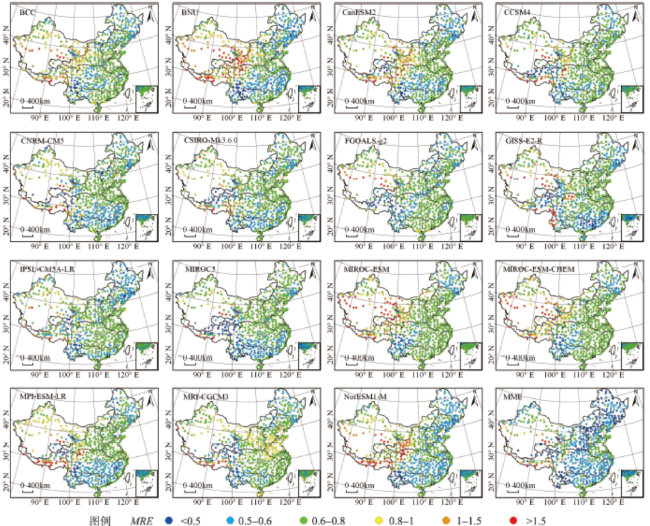
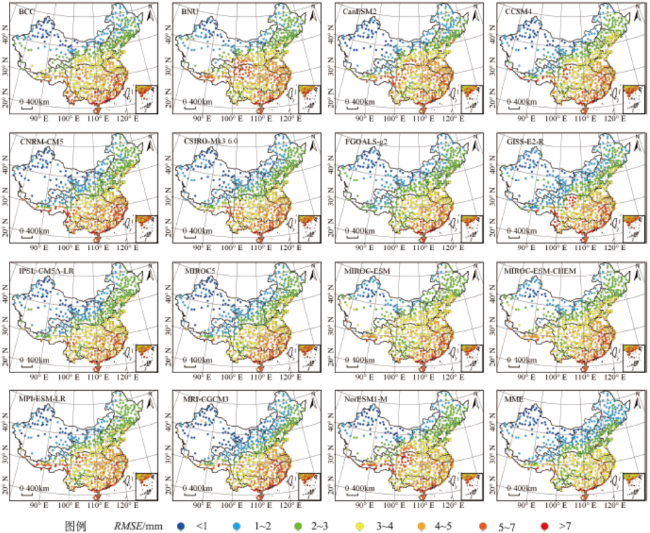
This article estimated the precision of the precipitation simulated by 15 IPCC AR5 (the Fifth Assessment Report of the Intergovernmental Panel on Climate Change, IPCC AR5) GCMs (Global Climate Models) and the multi-model ensemble (MME), based on the observed precipitation from 660 stations in China during 1996 to 2005. We firstly extracted the model simulation value at the corresponding position of the meteorological station, using the bilinear interpolation method, and took the average value of different models at the same station as the multi-model ensemble simulation value, then estimated the precision of the precipitation simulated by 15 IPCC AR5 GCMs and MME based on the observation of meteorological station. There were four evaluation parameters, including Corr (correlation coefficient), Bias, MRE (Mean Relative Error), and RMSE (Root Mean Square Error). Results show that the biases of the average daily precipitations simulated by IPCC AR5 GCMs present a gradually downward trend from northwest to southeast, and the RMSEs show a gradually increasing trend from northwest to southeast, while MREs in the east are less than those in the west. 82.3% of the average daily precipitations simulated by MRI-CGCM3 have relatively small biases, ranging from -0.5 to 0.5. The precisions of average daily precipitations simulated by BNU and MIROC-ESM are lower than that of others. Compared with other models, the MME simulation has the largest percentages of which the correlation coefficients are more than 0.5, MREs are less than 0.5, and RMSEs are less than 4mm, which accounted for 64.8%, 25.8% and 86.4% respectively. And the percentage of the biases ranging from -0.5 to 0.5 is relatively large, which is 56.7%, indicating that the simulation precision of MME is better than that of any other GCMs, and the MME can reduce the uncertainty of a single GCM simulation in future scenarios. Therefore, it is more scientific and reasonable to select the precipitation simulated by MME as the climate change condition, while studying subjects related to climate change.

Cite this article

SUN Zhen , JIA Shaofeng , LV Aifeng , ZHU Wenbin , GAO Yanchun . Precision Estimation of the Average Daily Precipitation Simulated by IPCC AR5 GCMs in China[J]. Journal of Geo-information Science, 2016 , 18(2) : 227 -237 . DOI: 10.3724/SP.J.1047.2016.00227

1 引言

全球气候系统变暖已经成为不争的事实[1-5]。IPCC AR5(IPCC fifth assessment report)的评估结论显示:与过去1400年相比,近30年(1983-2012年)可能是最暖的,并且这种变暖趋势在未来仍将继续[1]。目前,GCMs是模拟历史气候特征和预估未来气候变化的主要工具,IPCC专门对全球气候变化进行评估,得到了很多重要结论,其支持数据主要来源于GCMs的模拟结果[1];GCMs模拟结果在研究环境、生态和农业等领域对气候变化的响应和适应对策[6-11]方面也得到了广泛的应用。但是,由于气候系统中各种生物、化学和物理过程及其相互之间属性的复杂性,GCMs对全球气候系统的模拟存在一定的不确定性,所以,以实际观测值为基准,对GCMs模拟结果进行评估是十分必要的。
中国地处东亚季风区,是一个干湿交替的中纬度地区,并且具有明显的干湿季节,降水变化异常复杂[12],全球气候模式在中国地区的降水模拟结果是否可靠?以往的研究[13-19]主要基于IPCC AR4的模拟,研究表明,模式集合模拟降水的能力优于大部分单个模式,模式对降水的模拟在大地形区和季风区存在偏差,模式模拟能力还需进一步改进。相较于IPCC AR4的“耦合模式比较计划”(CMIP4),由CMIP5研究开发的GCMs具有更高的可信度,表现在4个方面:更高的空间分辨率、更加完善的参数化方案、以及对物理过程和动力框架更好的表述[20],其模拟结果能够代表当前气候模拟的国际最高水准[21]
关于IPCC AR5 GCMs对中国地区降水模拟能力的评估已经有了一些初步结论。李振朝等[22]评估了IPCC AR5中8个GCMs在青藏高原的月尺度降水模拟结果,检验结果表明:各模式模拟的青藏高原平均年降水量均大于实测降水,而且相关性很小,但空间分布比较一致;Xu等[23]认为大部分模式高估了中国地区的平均降水,对降水的时间变率模拟能力有限;Song等[24]指出CMIP5全球气候模式较CMIP3能更好地模拟出中国地区夏季风降水;陈晓晨[25]对月、季、年尺度的降水气候平均态进行评估,指出模式集合平均值的模拟效果优于大多数单个模式。
以上研究在IPCC AR5 GCMs中国区域降水模拟能力评估方面,做出了重要贡献,但关于GCMs模拟的日尺度降水模拟效果评价的研究还鲜有报道。IPCC AR5 GCMs在中国区域的日降水模拟精度具有怎样的空间分布特征?哪些区域的降水模拟精度比较差?哪些区域的降水模拟精度比较好?不同GCMs的降水模拟效果表现如何?哪个GCM的降水模拟效果最差?哪个GCM的降水模拟效果比较好?因此,本文以中国地区660个气象观测站点1996-2005年日尺度降水观测资料为基准,评估IPCC AR5提供的15个新一代GCMs以及MME的日降水模拟值精度,探讨IPCC AR5 GCMs对中国地区日平均降水的模拟能力,从而为中国水资源应对未来气候变化研究,选择更为合理的气候背景场提供可靠依据。

2 研究区背景与数据获取

中国位于亚洲东部、太平洋的西岸(3.85º~53.55ºN,73.55°~135.08ºE),南北跨越的纬度近50度,东西跨越经度60多度。中国地势西高东低,地形复杂多样,西部平均海拔4000 m以上,有“第三极”之称的青藏高原[26],形成的气候类型复杂多样,东部属季风气候,西北部属温带大陆性气候,青藏高原属高寒气候[27-29]。中国干湿类型有4种:干旱地区、半干旱地区、半湿润地区、湿润地区,而在相同的气候类型中,也会有热量与干湿程度的差异[30-32]。由于受青藏高原地形、季风气候和干湿交替等因素的影响,中国地区降水时空分布异常复杂,如何准确地模拟中国地区的降水,一直都是学者关注的焦点问题。
中国地区1996-2005年有观测资料的气象站点共660个(源自中国气象科学数据共享服务网,下载网址:http://cdc.nmic.cn/home.do),中国气象站点空间分布见图1。气候变化会引起水循环变化,从而在一定程度上改变水资源的空间配置状态[33-34],因此,本文根据水资源区分析中国降水的空间分布,中国水资源一级区[35]共有10个(图1)。
Fig. 1 The spatial distribution of annual precipitation simulated by MME during 1996-2005, meteorological stations and watershed in China

图1 MME模拟的中国地区1996-2005年年平均降水、气象站点和水资源一级区分布图

本文以气象观测站点1996-2005年日尺度降水观测资料为基准,评估IPCC AR5 GCMs在历史背景(历史模拟一般只到2005年)下模拟的降水(下载网址:http://www.ipcc-data.org/index.html)精度。获取研究区范围内的降水模拟值是进行评估的前提,由于不同GCM的空间分辨率不一致,并且同一GCM全球范围内的空间分辨率也不均匀(表1),所以,需要统计每一个GCM经纬度读取范围(统计方法见下文matlab计算代码),以确保读取的GCM范围包含整个研究区;确定了GCM经纬度读取范围之后,就可以从全球范围的数据集中,读取本文研究区范围内的降水模拟数据;读取的研究区范围内的GCM降水模拟数据以矩阵形式储存。需要指出的是,GCM数据集空间分辨率以行数和列数形式记录(表1):经向记录行数,即纬度数据集长度;纬向记录列数,即经度数据集长度。
Tab. 1 The basic description of IPCC AR5 GCMs

表1 IPCC AR5GCMs基本信息描述

模式名称 国家 研究机构 空间分辨率(纬向×经向) 时间步长(√考虑闰年)
BCC 中国 国家气候中心 64×128
BNU 中国 北京师范大学 64×128
CanESM2 加拿大 CCCma 64×128
CCSM4 美国 NCAR 192×288
CNRM-CM5 法国 CNRM 128×256
CSIRO-MK3.6.0 澳大利亚 CSIRO 96×192
FGOALS-g2 中国 中国科学院大气物理研究所和清华大学 60×128
GISS-E2-R 美国 GISS/ NASA 90×144
IPSL-CM5A-LR 法国 IPSL 96×96
MIROC5 日本 AORI/NIES/JAMSTE 128×256
MIROC-ESM 日本 64×128
MIROC-ESM-CHEM 日本 64×128
MPI-ESM-LR 德国 MPI 96×192
MRI-CGCM3 日本 MRI 160×320
NorESM1-M 挪威 NCC 96×144
统计GCMs经纬度读取范围Matlab代码如下:
lat_read_min=max(lat_GCM(find(lat_GCM<lat_ studyarea_min)));
lat_read_max=min(lat_GCM(find(lat_GCM>lat_studyarea_max)));
lon_read_min=max(lon_GCM(find(lon_GCM<lon_studyarea_min)));
lon_read_max=min(lon_GCM(find(lon_GCM>lon_studyarea_max)));
代码变量意义说明如下:
lat_GCM:GCM纬度数据集;
lon_GCM:GCM经度数据集;
lat_read_min:读取GCM纬度最小值;
lat_read_max:读取GCM纬度最大值;
lon_read_min:读取GCM经度最小值;
lon_read_max:读取GCM经度最大值;
lat_studyarea_min:研究区纬度最小值,本文取值为3.85ºN;
lat_studyarea_max:研究区纬度最大值,本文取值为53.55ºN;
lon_studyarea_min:研究区经度最小值,本文取值为73.55ºE;
lon_studyarea_max:研究区经度最大值,本文取值为135.08ºE;

3 IPCC AR5模式模拟降水评估方法

本文首先从全球范围的数据集中,读取研究区范围内的GCMs降水模拟数据;然后,提取气象站点处的GCMs模拟值;其次,所有GCMs在同一站点的模拟值相平均,得到MME模拟值;最后,以气象站点实际观测值为基准,评估GCMs日降水模拟值精度。
(1)双线性插值
气象站点处的GCMs模拟值提取方法,一般采用双线性插值方法[36],该方法是分别在目标点(x,y)最邻近4个已知点(如(x1,y1,z1),(x2,y1,z3),(x1,y2,z2),(x2,y2,z4))的xy 2个方向进行一次线性插值,得到目标点处z[37]
z x 2 - x y 2 - y x 2 - x 1 y 2 - y 1 z 1 + x 2 - x y - y 1 x 2 - x 1 y 2 - y 1 z 2 + x - x 1 y 2 - y x 2 - x 1 y 2 - y 1 z 3 + x - x 1 y - y 1 x 2 - x 1 y 2 - y 1 z 4 (1)
(2)多年日平均降水Pi
P i = j = 1 N P i , j N (2)
式中:i为年中的第几天(day of year),在文中取值1~365;N为年数,本文中N=10;j为年份,本文取值范围为1996-2005年;Pi为第i日平均降水量;Pi,j为在j年第i日的降水量。
(3)日平均降水精度评估参数
日平均降水精度评估参数包括以下4个:相关系数r(Correlation Coefficient)、偏差Bias、平均相对误差MRE(Mean Relative Error)和均方根误差RMSE(Root Mean Square Error)。
r = i = 1 n O i - O ̅ M i - M ̅ i = 1 n ( O i - O ̅ ) 2 i = 1 n M i - M ̅ 2 (3)
Bias = i = 1 n M i i = 1 n O i - 1 (4)
MRE = 1 n i = 1 n M i - O i O i (5)
RMSE = i = 1 n ( M i - O i ) n (6)
式中:M为GCMs模拟值;O为站点观测值; M ̅ 为GCMs模拟平均值; O ̅ 为站点观测平均值。

4 IPCC AR5GCMs模拟日均降水评估结果与分析

4.1 GCMs多年日均降水模拟值与站点观测值相关系数

IPCC AR5 GCMs 1996-2005年日均降水模拟值与气象站实际观测值时间序列相关系数在中国地区的空间分布如图2所示,蓝、绿、黄、红代表r逐渐增大,r越大代表GCMs模拟值与气象站点观测值相关性越好。r>0.7的点主要分布在西南诸河流域、长江流域西部和黄河流域西部,MME在该范围内(r>0.7)的点数最多(表2),占13.2%;其次是CSIRO-Mk3.6.0和BNU,分别占6.8%和6.7%;IPSL-CM5A-LR、GISS-E2-R、CCSM4最少,分别占0.3%、0.6%、1.4%。在0.5<r<0.7范围内的点,降水模拟值与站点观测值的相关性比较好,MME在该范围内的点占51.7%,主要分布在松花江流域、辽河流域、海河流域西北诸河北部、珠江流域、长江流域南部和黄河流域北部;其次是IPSL-CM5A-LR和NorESM1-M,仅占29.1%和28.3%,分布范围相似,主要分布在松花江流域、辽河流域、海河流域北部、长江流域西部和西南诸河流域南部;MIROC-ESM在该范围内的点最少,占16.9%,主要分布在西南诸河流域、长江流域西部和黄河流域西部。在r>0.5(包括r>0.7和0.5<r<0.7)范围内的点都属于相关性比较好的点,在该范围内的点所占比例越大,表明该GCM相关性越好。MME模拟值在该范围的点最多,占64.8%;其次是NorESM1-M和BNU,分别占34.5%和32.7%;GISS-E2-R和MIROC-ESM-CHEM的点最少,仅占18.0%和18.9%。需指出的是,r>0.5的点均通过了p<0.01显著性检验。r<0表明GCMs降水模拟值与观测值负相关,本文检测的GCMs中均存在一定负相关点,BCC、BNU和FGOALS-g2负相关点数最多,主要分布在西北诸河流域,分别占5.6%,5.1%和4.4%,但通过显著性检验的比例仅有3.1%、1.7%和1.1%;MIROC-ESM-CHEM、CCSM4、NorESM1-M、MIROC5、MIROC-ESM、MME有个别点模拟值与站点观测值负相关,且均未通过显著性检验。
Fig. 2 The spatial distributions of the correlation coefficients between average daily precipitation simulations and station records in China during 1996-2005

图2 IPCC AR5 GCMs 1996-2005年平均日降水模拟值相关系数空间分布

4.2 GCMs模拟多年日均降水偏差

IPCC AR5 GCMs 1996-2005年平均日降水模拟值Bias在中国地区的空间分布,均呈现出从西北向东南逐渐减小的趋势(图3),蓝色代表Bias<0的点,表示GCMs模拟值比站点观测值小,主要分布于珠江流域、东南诸河流域、淮河流域南部和长江流域南部,MRI-CGCM3在该范围内的点比例最大(表2),占59.1%;其次是IPSL-CM5A-LR和CSIRO-Mk3.6.0,分别占41.4%和37.7%;BNU和NorESM1-M模拟值普遍偏高,在该范围内的点比例最少,仅占15.9%和19.8%。模式模拟值Bias介于-0.5到0.5之间的点,属于模拟值Bias较小的点,MRI-CGCM3在该范围内的点所占比例最大,达到82.3%,分布在中国大部分地区;其次是MIROC5、CSIRO-Mk3.6.0和GISS-E2-R,占76.8%、70.3%和67.0%;BNU、MIROC-ESM和MIROC-ESM-CHEM比例最少,分别为43.8%,45.8%和46.7%,主要分布在松花江流域部分地区、辽河流域北部、海河部分地区、淮河流域、长江流域东部、珠江流域和东南诸河流域。红色代表Bias>3的点,主要分布在西北诸河流域西北部和西南诸河流域部分地区,BNU占的比例最大,达到11.4%;其次是MIROC-ESM、MIROC-ESM-CHEM、BCC、GISS-E2-R和NorESM1-M,分别为9.7%、8.8%、7.7%、7.6%和7.1%;其他模式所占比例均小于6%。可见,BNU、MIROC-ESM和MIROC-ESM-CHEM模式模拟值Bias介于-0.5到0.5之间的点所占比例最少,并且Bias>3的点所占比例最高,因此,BNU、MIROC-ESM和MIROC-ESM-CHEM模拟值Bias比较大。
Fig. 3 The spatial distributions of the Bias of average daily precipitation simulations based on station records in China during 1996-2005

图3 IPCC AR5 GCMs 1996-2005年平均日降水模拟值Bias空间分布

Fig. 4 The spatial distributions of the MRE of average daily precipitation simulations based on station records in China during 1996-2005

图4 IPCC AR5 GCMs 1996-2005年平均日降水模拟值MRE空间分布

Fig. 5 The spatial distributions of the RMSE of average annual precipitation simulations based on station records in China during 1996-2005

图5 IPCC AR5 GCMs 1996-2005年平均日降水模拟值RMSE空间分布

4.3 GCMs模拟多年日均降水平均相对误差

IPCC AR5 GCMs 1996-2005年日均降水模拟值MRE在中国东部地区普遍小于1,在西部地区空间分布比较复杂,西部诸河流域呈现出从北向南逐渐变大的趋势,西南诸河流域东部的MRE普遍较小,而西部的MRE一般较大(图4)。蓝色代表MRE<0.5的点,表示GCMs模拟值的MRE较小,MME模拟值MRE在该范围内的点比例最大(表2),占25.8%,主要分布在松花江流域、辽河流域、海河流域、黄河流域、长江流域西南部和西南诸河 流域东南部;其次是MIROC5和CNRM-CM5,分别占9.5%和7.0%,主要分布于西南诸河流域和长江流域西南部;MIROC-ESM-CHEM、BCC和MIROC-ESM所占比例最小,分别为1.5%、2.3%和2.4%。模式模拟值MRE>1.5,属于误差较大的点,主要分布在中国西部地区,BNU模拟值相对误差较大的点 所占比例最大,达到5.6%;然后是NorESM1-M和MIROC-ESM,所占比例分别为5.3%和4.8%;其 次是MME和MIROC5,所占比例为1.2%;CSIRO-Mk 3.6.0和IPSL-CM5A-LR模拟值相对误差较大的点所占比例最小,分别为0.9%和0.3%。MIROC-ESM不但MRE<0.5的点所占比例较小,而且MRE>1.5的点所占比例也较大,因此MIROC-ESM模式模拟值的MRE较大。相反地,MME和MIROC5不仅满足MRE<0.5的点所占比例比较大,而且同时满足MRE>1.5的点所占比例比较小,因此,MME和MIROC5模式模拟值与站点观测值的MRE较小。

4.4 GCMs模拟多年日均降水均方根误差

IPCC AR5 GCMs 1996-2005年平均日降水模拟值RMSE在中国地区的空间分布,呈现从西北向东南递增的特征(图5),红色表示RMSE>7 mm的点,MME和BNU所占比例最小(表2),仅有0.76%;其次是CanESM2和CSIRO-Mk 3.6.0,只有0.91%;NorESM1-M和GISS-E2-R在该范围内的点数最多,分别占3.48%和3.64%。RMSE>5 mm(包括 5 mm<RMSE<7 mm和RMSE>7 mm 2个范围)的点主要分布在西南诸河流域、长江流域、东南诸河流域、淮河流域南部和珠江流域沿海地区,MME在该范围内的点数最少,仅占4.55%;其次是IPSL-CM5A-LR和FGOALS-g2,分别占8.03%和8.79%;BNU和CNRM-CM5最多,占14.39%。RMSE<4 mm属于模拟效果较好的点,分布于中国大部分地区,MME在该范围内的点最多,所占比例高达86.4%;其次是FGOALS-g2、IPSL-CM5A-LR、MIROC5和MIROC-ESM,分别占78.3%、74.5%、72.6%和72.4%;CNRM-CM5、CanESM2和BNU所占比例最小,分别为65.2%、62.3%和58.3%。MME不仅满足RMSE>5 mm的点所占比例最少,而且同时满足RMSE<4 mm的点所占比例最大,所以,MME模拟值与站点观测值的RMSE较小的比例最大。相反地,BNU和CNRM-CM5模拟值不仅RMSE>5 mm的点所占比例都比较大,而且RMSE<4 mm的点所占比例都比较小,其中,BNU模拟值RMSE<4 mm的点所占比例最小。
Tab. 2 Estimations on precision of average daily precipitations simulated by IPCC AR5 GCMs / (%)

表2 IPCC AR5 GCMs日平均降水模拟值精度评估结果 / (%)

模型 r>0.5 r<0 |Bias|<0.5 Bias>3 RMSE<4 RMSE>5 MRE<0.5 MRE>1.5
BCC 23.8 5.6 51.8 7.7 67.3 12.0 2.3 1.7
BNU 32.7 5.2 43.8 11.4 58.3 14.4 4.7 5.6
CanESM2 31.7 1.1 58.0 4.1 62.3 11.8 3.8 1.5
CCSM4 19.7 0.8 53.6 5.0 68.3 12.7 3.8 2.1
MPI-ESM-LR 28.2 3.9 55.8 4.8 66.1 11.5 3.8 3.3
MRI-CGCM3 24.4 3.6 82.3 2.4 67.6 12.6 3.8 1.5
NorESM1-M 34.5 0.5 47.9 7.1 65.9 13.3 3.3 5.3
CNRM-CM5 27.1 0.2 65.9 2.4 65.2 14.4 7.0 1.4
CSIRO-Mk3.6.0 28.0 2.6 70.3 2.7 69.8 9.5 4.4 0.9
FGOALS-g2 21.8 4.4 57.4 5.8 78.3 8.8 5.3 1.4
GISS-E2-R 18.0 2.0 67.0 7.6 67.9 13.8 5.5 3.5
IPSL-CM5A-LR 29.4 1.1 64.5 3.6 74.5 8.0 3.8 0.3
MIROC5 26.1 0.3 76.8 4.1 72.6 9.2 9.5 1.2
MIROC-ESM 19.1 0.2 45.8 9.7 72.4 10.5 2.4 4.8
MIROC-ESM-CHEM 18.9 1.4 46.7 8.8 68.3 10.3 1.5 3.6
MME 64.8 0.2 56.7 5.3 86.4 4.5 25.8 1.2

5 结论

本文以中国地区660个气象观测站点1996-2005年地面日尺度降水资料为基准,评估了IPCC AR5提供的15个新一代GCMs和MME多年日平均降水模拟精度,主要结论包括:
(1)IPCC AR5 GCMs 1996-2005年日均降水模拟值与站点实际观测值时间序列相关系数最大(r>0.7)的点,主要分布在西南诸河流域、长江流域西部和黄河流域西部;r>0.5范围内的点相关性比较好,MME在该范围内的点数最多,共占有64.8%的比例,因此,MME模拟值与站点观测值相关性较好的点比例最多。r<0表明GCMs模拟值与站点观测值呈现负相关关系,本文中检测的GCMs均存在不同比例的负相关点,其中,BCC、BNU和FGOALS-g2负相关点数最多,主要分布在西北诸河流域。
(2)IPCC AR5 GCMs 1996-2005年平均日降水模拟值Bias在中国地区的空间分布,均呈现出从西北向东南逐渐减小的趋势。MRI-CGCM3模拟值的Bias介于-0.5到0.5之间的点最多,比例达到82.3%。BNU、MIROC-ESM和MIROC-ESM-CHEM模拟值Bias>3的点所占比例最大,主要分布在西北诸河流域西北部和西南诸河流域部分地区。
(3)IPCC AR5 GCMs 1996-2005年平均日降水模拟值MRE在中国东部地区较小,MRE较大的点主要分布在西部地区。MME和MIROC5降水模拟值的MRE<0.5的点所占比例较多,MRE>1.5的点的所占比例较小,因此MME和MIROC5模式模拟值的MRE较小;MIROC-ESM模拟值的MRE<0.5的点所占比例最小,仅有2.4%,但有4.8%的MRE>1.5,因此MIROC-ESM模式模拟值的MRE较大。
(4)IPCC AR5 GCMs 1996-2005年平均日降水模拟值RMSE在中国地区的空间分布,呈现从西北向东南递增的特征。MME有86.4%的模拟值的RMSE<4 mm,BNU仅占58.3%。RMSE>5 mm的点,主要分布在西南诸河流域、长江流域、东南诸河流域、淮河流域南部和珠江流域沿海地区,BNU所占比例最高,达到14.39%。
(5)对于中国地区1996-2005年平均日降水量,BNU和MIROC-ESM模拟的效果最差。BNU模拟值与站点观测值呈现负相关性的点较多,并且BiasRMSE较大;MIROC-ESM模拟值与站点观测值的BiasMRE较大。
(6)综合考虑气候模式模拟值精度评估参数(r, Bias, MRE, RMSE),MME模拟的中国地区1996-2005年平均日降水量优于大部分单个模式,因此,MME可更好地实现中国地区历史数据的模拟。
(7)CMIP5模式历史模拟试验(1850-2005年),是利用实际的外强迫(包括人为因素和自然因素)驱动耦合模式,模拟历史气候的演变过程[21-22]。历史数据模拟的不确定性主要来源于:气候系统认知水平的局限性和模式结构及参数的不确定性[3-5],本文通过气象站点数据对不同模式的历史模拟数据进行精度评估,发现MME历史数据的模拟在一定程度上减少了单个模式历史数据模拟的不确定性。虽然对于不同模式未来气候的预估,新情景(Representative Concentration Pathways,RCPs)的设置也增加了气候模式未来预估数据的不确定性[1],例如,人口和经济的增长,科学技术的演变,考虑到人类活动减缓气候变化的贡献等其他因素,给气候预估带来的不确定性,但是选择历史数据模拟较好的气候模式MME,可在一定程度上减少单个模式未来情景模拟的不确定性。因此,未来在中国水资源等受气候变化影响的研究中,选择MME新情景下的预估结果,作为气候背景场更为科学合理。

The authors have declared that no competing interests exist.

[1]
IPCC. Climate change: Work group Icontribution to the IPCC fifth assessment report (AR5)[R]. Switzerland: IPCC, 2013.

[2]
IPCC. Climate change 2007: The physical science basis[M]. New York: Cambridge University Press, 2007.

[3]
王绍武,罗勇,赵宗慈,等.IPCC第5次评估报告问世[J]. 气候变化研究进展,2013,9(6):436-439.正IPCC第5次评估报告 (AR5)第一工作组评估报告发布的前后一段时间内,国际上对报告的反应十分强烈。Nature杂志于2013年9月19日发表了一个专栏,包括编者按及 对IPCC 25年回顾,共发表了9篇文章~([1-9]),Nature Geoscience~([10])及Nature Climate Change~([11])发表了编者按。Science也发表了编者按~([12])和评论~([13])。下面对这些文章中讨论较多的几个问题,作一 个扼要的介绍。1人类活动影响全球变暖的可信度提高

DOI

[ Wang S W, Lou Y, Zhao Z C, et al.The fifth IPCC assessment report hits the streets[J]. Progressus Inquisitiones de Mutatione Climatis, 2013,9(6):436-439. ]

[4]
沈永平,王国亚.IPCC第一工作组第五次评估报告对全球气候变化认知的最新科学要点[J].冰川冻土,2013,35(5):1068-1076.2013年9月27日,在瑞典 首都斯德哥尔摩,联合国政府间气候变化专门委员会第一工作组第五次评估报告《Climate Change 2013:The Physical Science Basis》决策者摘要(Summary for Policymakers,SPM)发布,随后于9月30日公布了报告全文.报告指出,全球气候系统变暖的事实是毋庸置疑的,自1950年以来,气候系统 观测到的许多变化是过去几十年甚至近千年以来史无前例的.全球几乎所有地区都经历了升温过程,变暖体现在地球表面气温和海洋温度的上升、海平面的上升、格 陵兰和南极冰盖消融和冰川退缩、极端气候事件频率的增加等方面.全球地表持续升温,1880-2012年全球平均温度已升高 0.85℃[0.65~1.06℃];过去30a,每10a地表温度的增暖幅度高于1850年以来的任何时期.在北半球,1983—2012年可能是最近 1 400a来气温最高的30a.特别是1971-2010年间海洋变暖所吸收热量占地球气候系统热能储量的90%以上,海洋上层(0~700m)已经变暖. 与此同时,1979-2012年北极海冰面积每10a以3.5%~4.1%的速度减少;自20世纪80年代初以来,大多数地区多年冻土层的温度已升高.全 球气候变化是由自然影响因素和人为影响因素共同作用形成的,但对于1950年以来观测到的变化,人为因素极有可能是显著和主要的影响因素.目前,大气中温 室气体浓度持续显著上升,CO2、CH4和N2O等温室气体的浓度已上升到过去800ka来的最高水平,人类使用化石燃料和土地利用变化是温室气体浓度上 升的主要原因.在人为影响因素中,向大气排放CO2的长期积累是主要因素,但非CO2温室气体的贡献也十分显著.控制全球升温的目标与控制温室气体排放的 目标有关,但由此推断的长期排放目标和排放空间数值在科学上存在着很大的不确定性.

DOI

[ Shen Y P, Wang G Y.Key findings and assessment results of IPCC WGI Fifth assessment report[J]. Journal of Glaciology and Geocryology, 2013,35(5):1068-1076. ]

[5]
秦大河,Thomas Stocker,259名作者和TSU(驻伯尔尼和北京).IPCC第五次评估报告第一工作组报告的亮点结论[J].气候变化研究进展,2014,10(1):1-6.IPCC第五次评估报告(AR5)第一工作组(WGI)报告的亮点结论,是过去7年全世界气候变化科学研究成果凝练出来的精华。20世纪50年代以来全球气候变暖的一半以上是人类活动造成的。1971年以来人为排放温室气体产生热量的93%进入了海洋,海洋还吸收了大约30%人为排放的CO<sub>2</sub>,导致海表水pH值下降了0.1,等等。采用全球耦合模式比较计划第五阶段(CMIP5)的模式,预估未来全球气候变暖仍将持续,21世纪末全球平均地表温度在1986&mdash;2005年的基础上将升高0.3~4.8℃。限制气候变化需要大幅度持续减少温室气体排放。如果将1861&mdash;1880年以来人为CO<sub>2</sub>累积排放控制在1000 GtC,那么人类有超过66%的可能性把未来升温幅度控制在2℃以内(相对1861&mdash;1880年)。

DOI

[ Qin D H, Stocker T, 259 Authors and TSU (Bern & Beijing). Highlights of the IPCC working group I fifth assessment report[J]. Progressus Inquisitiones De Mutatione Climatis, 2014,10(1):1-6. ]

[6]
Verburg P H, Soepboer W, Veldkamp A, et al.Modeling the spatial dynamics of regional land use: the CLUE-S model[J]. Environmental Management, 2002,30(3):391-405.lt;a name="Abs1"></a><div class="AbstractPara"> <div class="">Land-use change models are important tools for integrated environmental management. Through scenario analysis they can help to identify near-future critical locations in the face of environmental change. A dynamic, spatially explicit, land-use change model is presented for the regional scale: CLUE-S. The model is specifically developed for the analysis of land use in small regions (e.g., a watershed or province) at a fine spatial resolution. The model structure is based on systems theory to allow the integrated analysis of land-use change in relation to socio-economic and biophysical driving factors. The model explicitly addresses the hierarchical organization of land use systems, spatial connectivity between locations and stability. Stability is incorporated by a set of variables that define the relative elasticity of the actual land-use type to conversion. The user can specify these settings based on expert knowledge or survey data. Two applications of the model in the Philippines and Malaysia are used to illustrate the functioning of the model and its validation.

DOI PMID

[7]
Parry M L, Rosenzweig C, Iglesias A, et al.Effects of climate change on global food production under SRES emissions and socio-economic scenarios[J]. Global Environmental Change, 2004,14(1):53-67.The use of the SRES scenarios highlights several non-linearities in the world food supply system, both in the biophysical sense, where the levels of atmospheric CO 2 tested reach new levels, and the socio-economic sense, where changes in population dynamics and economic and political structures complicate the translation of biophysical climate change impacts into social indices, such as the number of people at risk of hunger.

DOI

[8]
Fowler H J, Blenkinsop S, Tebaldi C.Linking climate change modelling to impacts studies: recent advances in downscaling techniques for hydrological modelling[J]. International Journal of Climatology, 2007,27(12):1547-1578.Abstract There is now a large published literature on the strengths and weaknesses of downscaling methods for different climatic variables, in different regions and seasons. However, little attention is given to the choice of downscaling method when examining the impacts of climate change on hydrological systems. This review paper assesses the current downscaling literature, examining new developments in the downscaling field specifically for hydrological impacts. Sections focus on the downscaling concept; new methods; comparative methodological studies; the modelling of extremes; and the application to hydrological impacts. Consideration is then given to new developments in climate scenario construction which may offer the most potential for advancement within the 鈥榙ownscaling for hydrological impacts鈥 community, such as probabilistic modelling, pattern scaling and downscaling of multiple variables and suggests ways that they can be merged with downscaling techniques in a probabilistic climate change scenario framework to assess the uncertainties associated with future projections. Within hydrological impact studies there is still little consideration given to applied research; how the results can be best used to enable stakeholders and managers to make informed, robust decisions on adaptation and mitigation strategies in the face of many uncertainties about the future. It is suggested that there is a need for a move away from comparison studies into the provision of decision-making tools for planning and management that are robust to future uncertainties; with examination and understanding of uncertainties within the modelling system. Copyright 漏 2007 Royal Meteorological Society

DOI

[9]
Jacob D J, Winner D A.Effect of climate change on air quality[J]. Atmospheric Environment, 2009,43(1):51-63.Air quality is strongly dependent on weather and is therefore sensitive to climate change. Recent studies have provided estimates of this climate effect through correlations of air quality with meteorological variables, perturbation analyses in chemical transport models (CTMs), and CTM simulations driven by general circulation model (GCM) simulations of 21st-century climate change. We review these different approaches and their results. The future climate is expected to be more stagnant, due to a weaker global circulation and a decreasing frequency of mid-latitude cyclones. The observed correlation between surface ozone and temperature in polluted regions points to a detrimental effect of warming. Coupled GCM–CTM studies find that climate change alone will increase summertime surface ozone in polluted regions by 1–1002ppb over the coming decades, with the largest effects in urban areas and during pollution episodes. This climate penalty means that stronger emission controls will be needed to meet a given air quality standard. Higher water vapor in the future climate is expected to decrease the ozone background, so that pollution and background ozone have opposite sensitivities to climate change. The effect of climate change on particulate matter (PM) is more complicated and uncertain than for ozone. Precipitation frequency and mixing depth are important driving factors but projections for these variables are often unreliable. GCM–CTM studies find that climate change will affect PM concentrations in polluted environments by ±0.1–102μg02m 613 over the coming decades. Wildfires fueled by climate change could become an increasingly important PM source. Major issues that should be addressed in future research include the ability of GCMs to simulate regional air pollution meteorology and its sensitivity to climate change, the response of natural emissions to climate change, and the atmospheric chemistry of isoprene. Research needs to be undertaken on the effect of climate change on mercury, particularly in view of the potential for a large increase in mercury soil emissions driven by increased respiration in boreal ecosystems.

DOI

[10]
Challinor A J, Wheeler T R, Hemming D, et al.Ensemble yield simulations: Crop and climate uncertainties, sensitivity to temperature and genotypic adaptation to climate change[J]. Climate Research, 2009,38(2):117-127.Estimates of the response of crops to climate change rarely quantify the uncertainty inherent in the simulation of both climate and crops. We present a crop simulation ensemble for a location in India, perturbing the response of both crop and climate under both baseline (12 720 simulations) and doubled-CO2 (171 720 simulations) climates. Some simulations used parameter values representing genot...

DOI

[11]
杨绚,汤绪,陈葆德,等.利用CMIP5多模式集合模拟气候变化对中国小麦产量的影响[J].中国农业科学,2014,47(15):3009-3024.利用最新的国际耦合模式比较计划第五阶段(CMIP5)中30个 全球大气-海洋耦合模式(AOGCMs)在典型浓度路径(RCPs)情景下的气候预估结果,基于集合模拟的方法评估气候变化对中国未来小麦产量的影响。气 候变化对农业的影响评估通常基于未来逐日的气象资料,然而AOGCMs模拟的逐日数据存在较大的不确定性。利用“虚拟气候变暖”(PGW)的方法,将 CMIP5模式预估的未来气候变化的信号与当前气候的逐日站点观测资料相结合,得到未来气候预估的逐日数据集合。结合作物过程模型 CERES-Wheat,利用集合模拟的方法,以概率的形式量化表述气候变化对中国小麦产量影响的不确定性。未来中国冬春小麦代表站在其小麦生育期内的平 均气温均有升高。预估21世纪末期,冬小麦代表站平均增温2.7-2.9℃,春小麦代表站平均增温3.0-3.3℃。RCP8.5情景比 RCP2.6情景增温显著。预估未来冬、春小麦在其生育期内的降水量普遍增加,并随着排放量的增长,降水量表现出逐渐增多的趋势。在仅改变未来气候变化的 条件下,冬、春小麦的灌溉小麦单产相对于1996-2005年普遍减产,并且随着气候变化,灌溉小麦的减产概率上升。春小麦代表站在灌溉条件下小麦减产的 程度比冬小麦代表站更显著。预估到21世纪末期,冬小麦代表站在RCP2.6情景下减产2%左右,在RCP4.5情景下减产6%左右,在 RCP8.5情景下减产9%左右,减产概率超过85%。预估春小麦代表站在 RCP2.6情景下减产5%,在RCP4.5情景下减产8%以上,在RCP8.5情景下减产15%以上,减产概率超过90%。在雨养条件下,冬小麦代表站 的小麦单产相较于1996-2005年显著增产。预估到21世纪末期,冬小麦代表站在RCP2.6情景下增产21%以上,在RCP4.5情景下增产22% 以上,在RCP8.5情景下增产25%以上,增产概率超过90%。利用PGW方法获得未来气候预估的逐日数据集合有效的保留了当前气候的天气信息,尤其是 极端天气事件的信息。利用集合模拟的方法评估未来气候在RCP2.6、RCP4.5和RCP8.5情景下对中国小麦单产的影响,表明在灌溉条件下,随着排 放量的增加,气候变化导致中国小麦单产减产的概率逐渐上升。雨养小麦单产集合的不确定性较灌溉条件大。

DOI

[ Yang X, Tang X, Chen B D, et al.Impacts of climate change on wheat yield in China simulated by CMIP5 Multi-Model Ensemble projections[J]. Scientia Agricultura Sinica, 2014,47(15):3009-3024. ]

[12]
Zeng N, Ding Y, Pan J, et al.Climate change-the Chinese challenge[J]. Science, 2008,319(5864):730-731.Controlling COemissions without hindering economic development is a major challenge for China and the world.

DOI

[13]
Sun Y, Solomon S, Dai A, et al.How often does it rain ?[J]. Climate, 2005,19:916-934.Abstract Daily precipitation data from worldwide stations and gridded analyses and from 18 coupled global climate models are used to evaluate the models' performance in simulating the precipitation frequency, intensity, and the number of rainy days contributing to most (i.e., 67%) of the annual precipitation total. Although the models examined here are able to simulate the land precipitation amount well, most of them are unable to reproduce the spatial patterns of the precipitation frequency and intensity. For light precipitation (1–10 mm day 611 ), most models overestimate the frequency but produce patterns of the intensity that are in broad agreement with observations. In contrast, for heavy precipitation (>10 mm day 611 ), most models considerably underestimate the intensity but simulate the frequency relatively well. The average number of rainy days contributing to most of the annual precipitation is a simple index that captures the combined effects of precipitation frequency and intensity on the water supply. The different measures of precipitation characteristics examined in this paper reveal region-to-region differences in the observations and models of relevance for climate variability, water resources, and climate change.

DOI

[14]
Phillips T J, Gleckler P J.Evaluation of continental precipitation in 20th-century climate simulations: The utility of multi-model statistics[J]. Water Resource Research, 42:W03202, doi: 10.1029/2005WR004313,2006.At the request of the Intergovernmental Panel on Climate Change (IPCC), simulations of 20th-century climate have been performed recently with some 20 global coupled ocean-atmosphere models. In view of its central importance for biological and socio-economic systems, model-simulated continental precipitation is evaluated relative to three observational estimates at both global and regional scales. Many models are found to display systematic biases, deviating markedly from the observed spatial variability and amplitude/phase of the seasonal cycle. However, the point-wise ensemble mean of all the models usually shows better statistical agreement with the observations than does any single model. Deficiencies of current models that may be responsible for the simulated precipitation biases as well as possible reasons for the improved estimate afforded by the multi-model ensemble mean are discussed. Implications of these results for water-resource managers also are briefly addressed.

DOI

[15]
张莉,丁一汇,孙颖.全球海气耦合模式对东亚季风降水模拟的检验[J].大气科学,2008,32(2):261-276.以CMAP(Climate Prediction Center Merged Analysis of Precipitation)月平均降水资料和欧洲中期天气预报中心(ECMWF)的40年再分析资料集ERA40为观测基础,分析了当前政府间气候变化专门委员会第四次评估报告(IPCC AR4)的17个全球海气耦合模式对东亚季风区夏季降水和环流的模拟能力。结果表明:(1)模式基本上都能够模拟出降水由东亚东南部海洋至东亚西北部中国内陆减少的空间分布特征,部分模式能够模拟出降水的部分主要模态;(2)大部分模式基本上能够模拟出中国东部陆地降水的季节进退。但同时也存在相当的差异,这包括:(1)多数模式普遍存在模拟降水量偏少、降水变幅偏小的缺陷;(2)雨带的季节推进过程与观测存在一定偏差,尤其海洋上的季节进退过程模拟较差,有的模式甚至不能模拟出东亚季风区东部海洋上大致的季节进程。因此,模式对东亚季风区降水的模拟能力还是比较有限的,需要进一步改进。多模式集合的夏季环流场以偏弱为主,不利于降水的形成,这在中国东部大陆部分比较明显。另外,空气湿度模拟值偏低、从而造成水汽输送偏弱也是导致东亚季风区夏季降水模拟偏小的原因之一。

DOI

[ Zhang L, Ding Y H, Sun Y.Evaluation of precipitation simulation in east Asian monsoon areas by coupled ocean atmosphere general circulation models[J]. Chinese Journal of Atmospheric Sciences, 2008,32(2):261-276. ]

[16]
孙颖,丁一汇.IPCC AR4气候模式对东亚夏季风年代际变化的模拟性能评估[J].气象学报,2008,66(5):765-779.文中使用多种观测资料和分类的方法评估了IPCC AR4(政府间气候变化委员会第4次评估报告)气候模式(亦称Coupled Model Intercomparison Program 3, CMIP3)对东亚夏季风降水与环流年代际变化的模拟性能。结果表明,在评估的19个模式中,有9个模式可以较好地再现中国东部地区多年平均降水场,但仅有3个模式(第1类模式)可以较好地对东亚夏季风降水的年代际变化作出模拟,这3个模式是:GFDL-CM2.0、MIROC3.2(hires)和MIROC3.2(medres),其中模式GFDL-CM2.0具有最好的模拟性能。进一步的分析表明,大部分模式对东亚夏季风变化模拟能力的缺乏是因为这些模式没有抓住东亚夏季风降水变化的主要动力和热力学机制,即东亚地区在过去所出现的大范围对流层变冷和变干。而第1类模式由于较好地再现了东亚地区垂直速度场(动力学因子)和水汽场(热力学因子)的变化特征,因此较好地模拟出中国东部南涝北旱的气候变化特征。本文的评估清楚地表明,当选择不同模式进行集合时,模式对某一研究变量的模拟性能好坏极大地影响了集合的结果。当模拟性能较好的模式在一起进行集合时,所得到的结果更加接近于真实的观测结果。就特定的研究变量而言,这种集合更加优于将可得到的所有模式进行集合。这说明,虽然多模式集合一般优于单个模式的结果,但应考虑使参与集合的模式对所研究变量具有一定的模拟能力。

DOI

[ Sun Y, Ding Y H.Validation of IPCC AR4 climate models in simulating interdecadal change of East Asian summer monsoon[J]. Acta Meteorologica Sinica, 2008,66(5):765-779. ]

[17]
江志红,陈威霖,宋洁,等.7个IPCC AR4模式对中国地区极端降水指数模拟能力的评估及其未来情景预估[J]. 大气科学,2009,33(1):109-120.利用中国区域550个站点 1961~2000年日降水量资料,考察参与政府间气候变化委员会(IPCC)第四次评估报告的7个新一代全球模式及多模式集合对现代气候情景下 (20C3M)5个极端降水指数的模拟能力,同时进行中国区域未来不同排放情形下极端降水事件变化的预估,结果表明:最新全球模式能较好地模拟出极端降水 指数气候场的空间分布及其中国区域的线性趋势,且模式集合模拟能力优于大部分单个模式,但在青藏高原东侧、高原南部存在虚假的极端降水高值区,模拟的东部 季风区的极端降水强度系统性偏低,区域平均序列年际变率的模拟能力也较低。中国地区21世纪与降水有关的事件都有趋于极端化的趋势,极端降水强度可能增 强,干旱也将加重,且变化幅度与排放强度成正比。

DOI

[ Jiang Z H, Chen W L, Song J, et al.Projection and evaluation of the precipitation extremes indices over China based on seven IPCC AR4 coupled climate models[J]. Chinese Journal of Atmospheric Sciences, 2009,33(1):109-120. ]

[18]
刘敏,江志红.13个IPCC AR4模式对中国区域近40 a气候模拟能力的评估[J].南京气象学院学报,2009,32(2):256-268.

[ Liu M, Jiang Z H.Simulation ability evaluation of surface temperature and precipitation by thirteen IPCC AR4 coupled climate models in China during 1961-2000[J]. Journal of Nanjing Institute of Meteorology, 2009,32(2):256-268. ]

[19]
许崇海,沈新勇,徐影.IPCC AR4模式对东亚地区气候模拟能力的分析[J].气候变化研究进展,2007,3(5):287-292.利用CRU地面温度、降水的陆地月平均观测资料,以及参与IPCC第四次评估报告的22个海气耦合模式的模拟结果,分析了这些模式对东亚地区当前气候的模拟能力.结果表明:虽然所有模式对东亚地区的气候都有一定的模拟能力,但各模式模拟效果差异较大;与单个模式相比,模式集合平均值能更好地反映气候变化趋势;多数模式的温度模拟值偏低,降水模拟值偏高;对1980-1999年20a平均气候态空间分布、百年时间变化分析可以看出,温度模拟效果比较好,降水模拟较差.

DOI

[ Xu C H, Shen X Y, Xu Y.An analysis of climate change in East Asia by using the IPCC AR4 simulations[J]. Advances in Climate Change Research, 2007,3(5):287-292. ]

[20]
巢清尘,周波涛,孙颖,等.IPCC气候变化自然科学认知的发展[J].气候变化研究进展,2014,10(1):7-13.过去20年来,随着观测手段的 改善、气候模式的进步以及分析方法的提升,人类对气候变化事实、原因和未来趋势的认识水平不断深化,进一步确认全球气候系统变暖是毋庸置疑的,人类活动是 20世纪中叶以来气候变暖的主要原因,未来气候系统仍将继续变暖。IPCC评估报告极大地促进了气候变化自然科学的进展,并为适应和减缓气候变化奠定了坚 实的科学基础。

DOI

[ Chao Q C, Zhou B T, Sun Y, et al.The cognition development of the climate change physical sciences on IPCC[J]. Progresses Inquisitiones de Mutatione Climatis, 2014,10(1):7-13. ]

[21]
黄传江,乔方利,宋亚娟,等.CMIP5模式对南海SST的模拟和预估[J].海洋学报,2014,36(1):38-47.分析了32个CMIP5模式对南海历史海表温度(SST)的模拟 能力和不同排放情景下未来SST变化的预估。通过检验各气候模式对南海历史SST增温趋势和均方差的模拟,发现大部分模式都能较好地模拟出南海20世纪历 史SST的基本特征和变化规律,但也有部分模式的模拟存在较大偏差。尽管这些模拟偏差较大的模式对SST多模式集合平均的影响不大,但会增加未来情景预估 的不确定性。剔除15个模式后,分析了南海SST在RCP26、RCP45和RCP85三种排放情景下的变化趋势,发现在未来百年呈明显的增温趋势,多模 式集合平均的增温趋势分别为0.42、1.50和3.30℃/(100 a)。这些增温趋势在空间上变化不大,但随时间并不是均匀变化的。在前两种排放情景下,21世纪前期的增温趋势明显强于后期,而在RCP85情景下,21 世纪后期的增温趋势强于前期。

DOI

[ Huang C J, Qiao F L, Song Y J, et al.The simulation and forecast of SST in the south China sea by CMIP5 models[J]. Acta Oceanologica Sinica, 2014,36(1):38-47. ]

[22]
李振朝,韦志刚,吕世华,等.CMIP5部分气候模式气温和降水模拟结果在北半球及青藏高原的检验[J].高原气象,2013,32(4):921-928.<p>利用北半球和青藏高原的观测资料,&nbsp; 通过趋势分析、 量值比较及小波分析等方法对已提交历史模拟结果的8个模式进行了比较。结果表明,&nbsp; 各模式对北半球气温年变化模拟的较好,&nbsp; 一般7、 8月气温最高,&nbsp; 1月气温最低,&nbsp; 不存在相位差问题。各模式模拟的历史气温年际和年代际变化趋势比较一致,&nbsp; 气温最大相差2.8 ℃以上; 模拟的1850-2005年气温平均最高和最低值相差可达1.8 ℃左右; 除1个模式外,&nbsp; 其余模式都能较准确地模拟出至少有一次气温突变。对北半球降水的模拟,&nbsp; 各模式都模拟出了降水的季节变化,&nbsp; 但从年际变化趋势来看,&nbsp; 4个模式模拟的降水为增大趋势,&nbsp; 4个为减小趋势。对青藏高原的模拟,&nbsp; 从变化趋势与观测气温的对比来看,&nbsp; 8个模式中,&nbsp; 除2个模式通过了0.05显著性水平检验外,&nbsp; 其余均通过了0.01显著性水平检验; 各模式都模拟出了青藏高原的降水中心,&nbsp; 但对降水量值的模拟相差较大。</p>

DOI

[ Li Z C, Wei Z G, Lv S H, et al.Verifications of surface air temperature and precipitation from CMIP5 model in northern hemisphere and Tibet Plateau[J]. Plateau Meteorology, 2013,32(4):921-928. ]

[23]
Xu Y, Xu C H.Preliminary assessment of simulations of climate changes over China by CMIP5 multi-models[J]. Atmospheric and Oceanic Science Letters. 2012,5(6):489-494.Based on 18 global climate models’ simulations of the 20th century climate, a set of experiments within phase five of the Coupled Model Inter-comparison Project (CMIP5), the performances of simulating the present climate over China are assessed. Compared with observations, models can capture the dominant features of the geographic distributions of temperature and precipitation during 1961–2005. For the temporal changes of temperature, models appear to have a good performance on reproducing the warming tendency but show limited skills for precipitation. For the regional mean temperature and precipitation over the whole of China, most models underestimate the actual temperature and overestimate precipitation. Concerning the standard deviations of simulations by the 18 models, they are larger for temperature in the western part of China, while the standard deviations are larger for precipitation in the South.

DOI

[24]
Song F, Zhou T.Inter-annual variability of East Asian summer monsoon simulated by CMIP3 and CMIP5 AGCMs:Skill dependence on Indian Ocean-western Pacific anticyclone teleconnection[J]. Journal of Climate, 2014,27(4):1679-1697.Abstract The climatology and interannual variability of East Asian summer monsoon (EASM) are investigated by using 13 atmospheric general circulation models (AGCMs) from phase 3 of the Coupled Model Intercomparison Project (CMIP3) and 19 AGCMs from CMIP5. The mean low-level monsoon circulation is reasonably reproduced in the multimodel ensemble mean (MME) of CMIP3 and CMIP5 AGCMs, except for a northward shift of the western Pacific subtropical high. However, the monsoon rainband known as mei-yu/baiu/changma (28°–38°N, 105°–150°E) is poorly simulated, although a significant improvement is seen from CMIP3 to CMIP5. The interannual EASM pattern is obtained by regressing the precipitation and 850-hPa wind on the observed EASM index. The observed dipole rainfall pattern is partly reproduced in CMIP3 and CMIP5 MME but with two deficiencies: weaker magnitude and southward shift of the dipole rainfall pattern. These deficiencies are closely related to the weaker and southward shift of the western Pacific anticyclone (WPAC). The simulation skill of the interannual EASM pattern has been significantly improved from CMIP3 to CMIP5 MME accompanied by the enhanced dipole rainfall pattern and WPAC. Analyses demonstrate that the tropical eastern Indian Ocean (IO) rainfall response to local warm SST anomalies and the associated Kelvin wave response over the Indo–western Pacific region are important to maintain the WPAC. A successful reproduction of interannual EASM pattern depends highly on the IO–WPAC teleconnection. The significant improvement in the interannual EASM pattern from CMIP3 to CMIP5 MME is also due to a better reproduction of this teleconnection in CMIP5 models.

DOI

[25]
陈晓晨. 全球气候模式对中国降水模拟能力的评估[D].北京:中国气象科学研究院,2014.

[ Chen X C.Assessment of the precipitation over China simulated by CMIP5 multi-models[D]. Beijing: Chinese Academy of Meteorological Sciences, 2014. ]

[26]
Jane Q.The third pole[J]. Nature, 2008,454(24):393-396.

[27]
马耀明,胡泽勇,田立德,等.青藏高原气候系统变化及其对东亚区域的影响与机制研究进展[J]. 地球科学进展,2014,29(2):207-215.青藏高原地区特殊的大气圈、水 圈、冰冻圈、生物圈等多圈层相互作用过程及其变化,不仅对青藏高原及其周边地区的气候格局和变化有重要影响,而且对东亚、北半球乃至全球的环流形势和异常 产生深远影响。为此,全球变化研究重大科学研究计划于2010年9月启动了"青藏高原气候系统变化及其对东亚区域的影响与机制研究"项目,旨在开展青藏高 原环境、地表过程、生态系统对全球变化的响应及其对周边地区人类生存环境影响的综合交叉研究,以揭示青藏高原气候系统变化及其对东亚区域的影响机制,提出 前瞻性的应对气候变化与异常的策略,减少其导致的区域自然灾害的损失。项目实施近3年来,开展了青藏高原首次"星—机—地"综合立体协同观测试验和大规模 地气相互作用综合观测试验。在遥感结合地面观测估算青藏高原地表特征参数和能量通量方法,高原地区上对流层和下平流层结构,高原季风与东亚季风和南亚季风 之间的内在联系,中国及青藏高原地区太阳辐射和风速的年代际变化趋势,青藏高原春季感热源减弱及其对亚洲夏季风和中国东部降水的影响,以及极高海拔地区土 地覆被格局等方面取得了一些突出进展。

DOI

[ Ma Y M, Hu Z Y, Tian L, et al.Study progresses of the Tibet Plateau climate system change and mechanism of its impact on East Asia[J]. Advances in Earth Science, 2014,29(2):207-215. ]

[28]
叶笃正,高由禧.青藏高原气象学[M].北京:科学出版社, 1979.

[ Ye D Z, Gao Y X.Aerography of Tibet Plate[M]. Beijing: Science Press, 1979. ]

[29]
赵昕奕,张惠远,万军.青藏高原气候变化对气候带的影响[J].地理科学,2002,22(2):190-195.已经发生和未来的全球气候变化将对自然界和人类社会产生一系列的 影响,特别是全球气候要素的变化会导致气候带的变动,进而导致自然带(区)的变动并影响人类的生产、生活.在对青藏高原20世纪50年代到90年代气温变 化分析的基础上,讨论了40年来积温等气候带指标值的变化特征,并依据对未来气候情景的假设,指出未来全球气候变化背景下,青藏高原气候带的可能变动.

DOI

[ Zhao X Y, Zhang H Y, Wan J.The impact of climatic change on the climate zones in the Qinghai-Tibetan Plateau[J]. Scientia Geographica Sinica, 2002,22(2):190-195. ]

[30]
陈咸吉. 中国气候区划新探[J].气象学报,1982,40(1):35-41.根据大量资料的分析,得出在地势高差悬殊和幅员广大的位于中低纬度的我国,用≥10℃天数作为划分气候带的指标,可以较好地显示出各气候带的水平和垂直地带性。 在三级气候区划中,本文在每一级中使用同一气象要素指标进行气候区划,便于比较。这比过去的气候区划有所改进。

DOI

[ Chen X J.A new approach to the climate division of China[J]. Acta Meteorologica Sinica, 1982,40(1):35-41. ]

[31]
李明星,马柱国.中国气候干湿变化及气候带边界演变:以集成土壤湿度为指标[J].科学通报,2012,57(28-29):2740-2754.依据观测气象资料驱动的陆面模 式模拟土壤湿度,比较评估了25个全球耦合气候模式的模拟土壤湿度,选择其均值和趋势与陆面模式模拟均呈正相关的11个数据集.采用多模式权重平均法集成 了中国区域两种气候情景1900~2099年的土壤湿度.以集成土壤湿度为指标,分析中国区域199年气候干湿变化的时空特征,区划干湿气候带,分析干湿 区边界的演变特征.结果表明总体上典型干旱区土壤湿度呈增加趋势,湿润区变化不显著,干湿过渡带土壤湿度变化最剧烈,呈显著干旱化趋势.干湿气候带边界线 演变表明半干旱区扩张,半湿润区收缩是两种情景下我国干湿气候带演变的典型特征.其中20世纪30°N以北的半干旱区面积与1970~1999年平均半干 旱区面积比较扩大了11.5%,即使考虑湿润区向半湿润区的转变,与1970~1999年平均面积相比,半湿润区面积缩小也达9.8%.21世纪A1B情 景下干湿区界线的变化保持了同样的趋势,但强度明显大于20世纪.因此未来干旱化扩张影响下的区域生态环境变化和人类适应问题需要深入关注.

DOI

[ Li M X, Ma Z G.Soil moisture-based study of the variability of dry-wet climate and climate zones in China[J]. Chinese Science Bulletin, 2012,57(28-29):2740-2754. ]

[32]
郑景云,卞娟娟,葛全胜,等.1981-2010年中国气候区划[J].科学通报,2013,58(30):3088-3099.<p>根据我国658个站1981~2010年日气象观测数据, 以日平均气温稳定&ge;10℃的日数、年干燥度、7月平均气温为划分温度带、干湿区、气候区的主要指标, 以1月平均气温、年降水量为温度带、干湿区划分的辅助指标, 并参考日平均气温稳定&ge;10℃的积温及极端最低气温的多年平均值等指标, 对我国1981~2010年气候状况进行了区划, 将我国分为12个温度带、24个干湿区、56个气候区. 与1951~1980年相比, 受气候增暖影响, 1981~2010年间我国东部多个温度带界线出现了北移, 其中暖温带北界东段最大北移超过1个纬度, 北亚热带北界东段平均北移1个纬度, 中亚热带北界中段最大北移2个纬度, 南亚热带北界西段北移0.5~2.0个纬度; 西部因受地形影响, 温度带水平移动不显著, 但在青藏高原有亚寒带范围缩小、温带范围扩大趋势. 同时, 因华北、东北东南部、西北东部降水减少, 北方半干旱与半湿润分界线东移与南进, 其中36&deg;~41&deg;N间的移动幅度达0.5~2.5经度; 但西北的河西走廊、新疆及青藏高原的干旱区、半干旱区总体转湿.</p>

DOI

[ Zheng J Y, Bian J J, Ge Q S, et al.The climate regionalization in China for 1981-2010[J]. Chinese Science Bulletin, 2013,58(30):3088-3099. ]

[33]
任国玉,姜彤,李维京,等.气候变化对中国水资源情势影响综合分析[J].水科学进展,2008,19(6):772-779.介绍了近年在气候变化对中国水资源影响研究方面的若干进展。研究表明,中国水资源问题的产生 不仅与人口和社会经济快速发展有联系,更与气候环境的显著变化密切相关;未来的气候变化将会导致一些流域水资源更加短缺和洪涝灾害更加频繁,对流域水资源 和可持续发展产生重要影响;在流域水资源综合规划与管理中,应十分重视气候变化的影响问题。

DOI

[ Ren G Y, Jiang T, Li W J, et al.An integrated assessment of climate change impacts on China’s water resources[J]. Advances in Water Science, 2008,19(6):772-779. ]

[34]
张建云,王国庆.气候变化与中国水资源可持续利用[J].水利水运工程学报,2009(4):17-20.全球变暖是目前最重要的环境问 题之一.根据目前的相关研究成果,介绍了中国气候变化及其影响的事实,论述了中国水资源特点及目前存在的问题,分析了气候变化对中国典型流域河川径流量变 化的贡献、未来气候变化对水资源的可能影响、以及水资源系统对气候变化的敏感性和脆弱性;结合中国的实际情况,初步提出了水资源管理中应对气候变化的基本 适应对策.

DOI

[ Zhang J Y, Wang G Q.Climate change and sustainable utilization of water resources in China[J]. Hydro-Science and Engineering, 2009,4:17-20. ]

[35]
梅锦山. 我国重要江河湖泊水功能区划特征[J].中国水利,2012(7):38-42.全国重要江河湖泊水功能区划在统筹协调水资源开发利用、保护以及经济社会发展要求的同时,也 充分考虑了所在流域水资源的自然条件和属性。基于国务院批复的区划成果,分析了不同类型功能区及其水质目标在全国十大水资源一级区的分布状况,并针对不同 水资源一级区的自然环境、水资源条件和经济社会发展状况,进一步分析了各水资源一级区重要江河湖泊水功能区划成果和主要特征。

DOI

[ Mei J S.Features of water function zoning in different river basins in China[J]. China Water Resources, 2012,7:38-42. ]

[36]
孙侦,贾绍凤,吕爱锋等.IPCC AR5全球气候模式对1996-2005年中国地区气温模拟精度评价[J]. 地理科学进展,2015,34(10):1229-1240.本文利用中国660个站点逐日地面温度资料,评估了参与政府间气 候变化专门委员会第五次报告(IPCC AR5)的9个全球气候模式(Global Climate Models,GCMs)及多模式集合(Multi-Model Ensemble,MME)对中国地区气温的模拟精度.结果表明:9个IPCC AR5全球气候模式和MME模拟的中国地区1996-2005年日平均气温与气象站点观测值的相关系数都大于0.86,表明相关性较好;气候模式模拟的中 国东南部地区1996-2005年日平均气温的模拟精度较高,模拟值的偏差、平均相对误差、平均绝对误差和均方根误差都比较小;而西部地区的模拟效果较 差,模拟精度较低.综合考虑模式模拟值与站点观测值的相关系数、偏差、平均相对误差、平均绝对误差和均方根误差发现,MME在中国地区的气温模拟精度优于 大部分单个模式.

DOI

[ Sun Z, Jia S F, Lv A F, et al.Assesment on precision of temperature simulated by the IPCC AR5 GCMs in China 1996-2005[J]. Progress in Geography, 2015,34(10):1229-1240. ]

[37]
张超. 地理信息系统实习教程[M].北京:高等教育出版社,2004:186-190.

[ Zhang C.GIS practice tutorial[M]. Beijing: Higher Education Press, 2004:186-190. ]

Outlines

/