
Journal of Geo-information Science >
Study on City Shadow Extraction and Elimination in QuickBird Images
Received date: 2014-12-29
Request revised date: 2015-06-12
Online published: 2016-02-04
Copyright
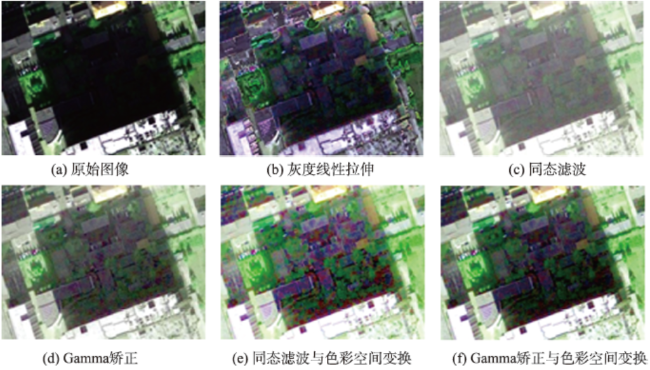
Urban green space, as the main element of urban structure, plays a very important role in urban studies. In recent years, remote sensing technology has been applied in various industries with its rapid development. It has become one of the major techniques for city information (especially, green space) extraction with the emergence of high-resolution remote sensing images. Compared to the low-resolution images, the high-resolution images have many advantages such as clear texture detail and rich information. However, the existence of shadows in the urban district has a great impact on image classification, interpretation, mapping and so on. Therefore, the building shadows in the images have become one of the important limiting factors for green space extraction. In order to effectively extract city (green space) information from remote sensing images, it is necessary to extract and eliminate shadows from remote sensing images. This study is based on the QuickBird image of Hohhot city. Firstly, by utilizing the methods of band ratio process and band recombination, the image shadow information was enhanced; and the optimal band combinations for shadow extraction were derived using optimum index factor (OIF). Secondly, the image mask was established and the shadow information was extracted based on shadow threshold values (the minimum values and maximum values) of near-infrared band. At last, the shadow was removed by combining color space transformation with homomorphic filter and gamma correction; and then the effects were compared with other methods. The results show that, for shadow extraction, the optimal band combination is a combination of band 3/4, 4 and 2; and the best DN range is between 70 and 165. The method combined with gamma correction and color space transformation can effectively eliminate shadows and retain color information of QuickBird image. It is the best solution for shadow elimination in this study. The results can provide theoretical basis and technical support for efficient city (especially, green space) information extraction based on high-resolution remote sensing images.
WANG Bing , AN Huijun , LIU Huaipeng , WANG Lijun , HE Xiaohui . Study on City Shadow Extraction and Elimination in QuickBird Images[J]. Journal of Geo-information Science, 2016 , 18(2) : 255 -262 . DOI: 10.3724/SP.J.1047.2016.00255
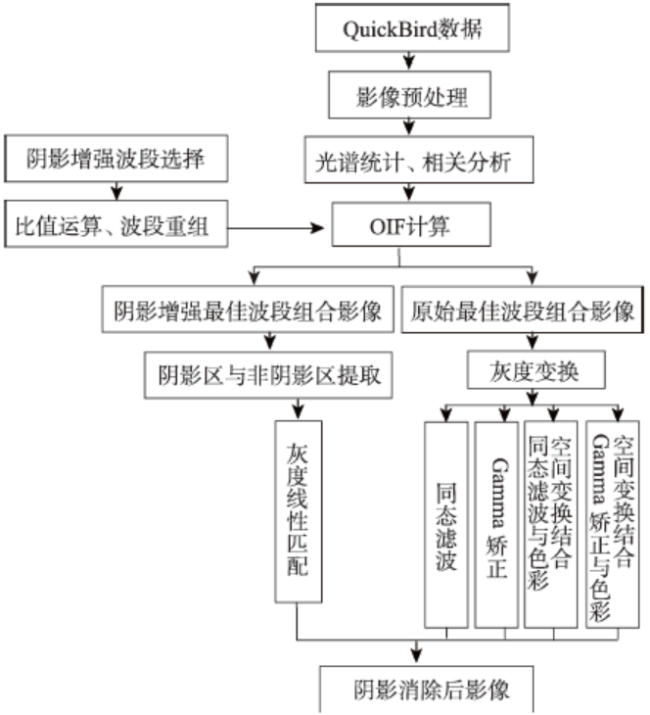
Fig. 1 Technique flow chart图1 技术流程图 |
Tab. 1 Spectrum characteristics of QuickBird image表1 QuickBird影像光谱特征统计表(Bit) |
| 波段 | 最小值 | 最大值 | 平均值 | 标准差 |
|---|---|---|---|---|
| 波段1 | 20 | 1237 | 194.27 | 37.68 |
| 波段2 | 0 | 1653 | 267.55 | 69.27 |
| 波段3 | 0 | 1361 | 186.95 | 71.40 |
| 波段4 | 0 | 1874 | 189.89 | 84.59 |
Tab. 2 Correlation coefficients between bands表2 各波段间相关系数 |
| 相关系数 | 波段 1 | 波段 2 | 波段3 | 波段 4 |
|---|---|---|---|---|
| 波段1 | 1.00 | |||
| 波段2 | 0.97 | 1.00 | ||
| 波段3 | 0.86 | 0.93 | 1.00 | |
| 波段4 | 0.82 | 0.89 | 0.96 | 1.00 |
Tab. 3 The OIF values for various band combinations表3 不同波段组合OIF指数表 |
| 波段组合 | 标准差和 | 相关系数和 | OIF指数 | 排序 |
|---|---|---|---|---|
| 1、2、3 | 178.36 | 2.76 | 64.58 | 4 |
| 1、2、4 | 191.54 | 2.68 | 71.56 | 3 |
| 1、3、4 | 193.67 | 2.64 | 73.43 | 2 |
| 2、3、4 | 225.26 | 2.79 | 80.86 | 1 |
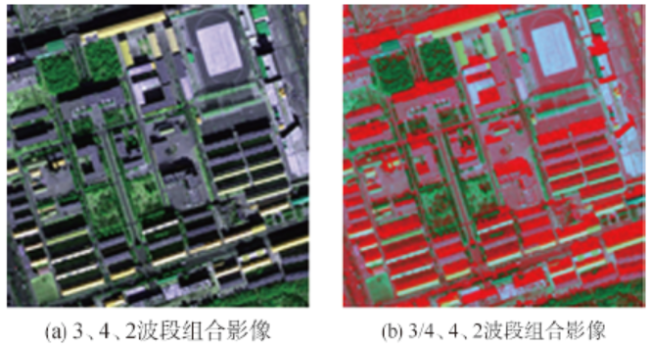
Fig. 2 The optimum band combination images图2 最佳波段组合图像 |
Tab. 4 The OIF values for shadow extraction derived band combinations表4 阴影提取派生波段组合OIF指数表 |
| 波段组合 | 标准差和 | 相关系数和 | OIF | 排序 |
|---|---|---|---|---|
| 4、1/4、1 | 122.83 | 1.68 | 73.05 | 9 |
| 4、1/4、2 | 154.42 | 1.85 | 83.51 | 4 |
| 4、1/4、3 | 156.55 | 1.99 | 78.77 | 7 |
| 4、2/4、1 | 122.84 | 1.64 | 74.82 | 8 |
| 4、2/4、2 | 154.43 | 1.80 | 85.80 | 3 |
| 4、2/4、3 | 156.56 | 1.96 | 80.08 | 5 |
| 4、3/4、1 | 122.45 | 1.53 | 79.84 | 6 |
| 4、3/4、2 | 154.04 | 1.67 | 92.10 | 1 |
| 4、3/4、3 | 156.17 | 1.78 | 87.76 | 2 |
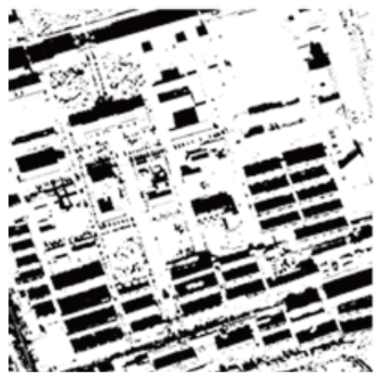
Fig. 3 Mask image图3 掩膜图像 |
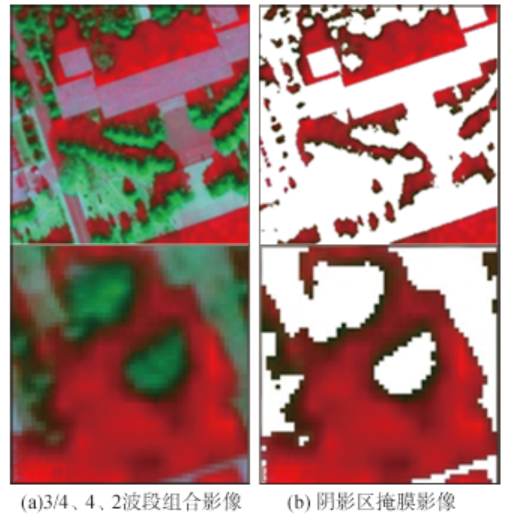
Fig. 4 Shadow extraction in combination of band 3/4, 4 and 2图4 3/4、4、2波段组合阴影提取效果图 |
Fig. 5 Original image and images with shadows eliminated图5 原始影像和阴影消除后影像 |
Tab. 5 Statistics of the classification accuracy表5 分类精度统计表 |
| 分类影像 | A | B | C | D | E | F |
|---|---|---|---|---|---|---|
| 总体精度/(%) | 74.33 | 88.27 | 91.80 | 92.37 | 94.09 | 94.91 |
| Kappa系数 | 0.59 | 0.76 | 0.84 | 0.85 | 0.88 | 0.90 |
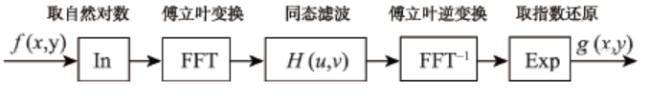
Fig. 6 Process of homomorphic filter algorithm图6 同态滤波算法流程 |
The authors have declared that no competing interests exist.
| [1] |
|
| [2] |
|
| [3] |
[
|
| [4] |
|
| [5] |
[
|
| [6] |
[
|
| [7] |
[
|
| [8] |
[
|
| [9] |
[
|
| [10] |
[
|
| [11] |
|
| [12] |
|
| [13] |
|
| [14] |
|
| [15] |
|
| [16] |
|
| [17] |
[
|
| [18] |
[
|
| [19] |
[
|
| [20] |
[
|
| [21] |
[
|
| [22] |
[
|
| [23] |
[
|
| [24] |
|
/
| 〈 |
|
〉 |