
Journal of Geo-information Science >
Classification of Hyperspectral Images with Spectral-Spatial Sparse Representation
Received date: 2015-05-11
Request revised date: 2015-10-27
Online published: 2016-02-04
Copyright
A novel sparse representation classification model with spectral-spatial sparsity properties is presented to improve the classification accuracy of hyperspectral images. Firstly, this method uses the wavelet dictionary as the core dictionary to extract spectral domain sparse information, and then the spectral dimension sparse representation classification is transformed into the wavelet domain (WSRC) by inverse wavelet transformation. After that, we actually extract the sparse spectral features of the hyperspectral images and increase the recognition of the original dictionary. Secondly, considering the unity and diversity of the spatial adjacent object, we realize the sparse coding of the neighborhood pixels, and then accumulate the sparse codes. At the same time, we classify the hyperspectral images using a linear classifier that is based on the accumulated sparse codes. This method ensures that we extract the main sparse signal of the neighborhood pixels on the basis of the personality features of sparse encoding, and it performs better than the joint sparse representation model (JSRC) which is directly based on the neighborhood pixels. Finally, two commonly used hyperspectral images are utilized to validate the proposed model. The experimental results demonstrate that the proposed algorithm outperforms other models in terms of overall accuracy and kappa coefficient measurements.
ZHU Yong , WU Bo . Classification of Hyperspectral Images with Spectral-Spatial Sparse Representation[J]. Journal of Geo-information Science, 2016 , 18(2) : 263 -271 . DOI: 10.3724/SP.J.1047.2016.00263
Tab. 1 16 Ground-truth classes in AVIRIS Indian Pines and the training and test sets for each class表1 16种真实类别地物及每类训练和测试样本数 |
| 序号 | 类别 | 训练 | 测试 |
|---|---|---|---|
| 1 | 苜蓿 | 5 | 41 |
| 2 | 玉米I | 143 | 1285 |
| 3 | 玉米II | 83 | 747 |
| 4 | 玉米III | 24 | 213 |
| 5 | 草I | 49 | 343 |
| 6 | 草II | 73 | 657 |
| 7 | 草III | 3 | 25 |
| 8 | 干草梗 | 48 | 430 |
| 9 | 燕麦 | 2 | 18 |
| 10 | 大豆I | 98 | 874 |
| 11 | 大豆II | 246 | 2209 |
| 12 | 大豆III | 60 | 533 |
| 13 | 小麦 | 21 | 184 |
| 14 | 树丛 | 127 | 1138 |
| 15 | 建筑物-草-树-路 | 39 | 347 |
| 16 | 石-钢顶棚 | 10 | 83 |
| 总计 | 1031 | 9218 | |
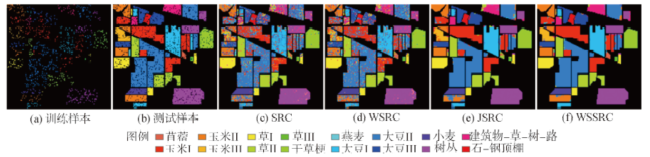
Fig. 1 Indian Pine image图1 Indian Pine影像 |
Tab. 2 WSRC classification accuracy and the dictionary structure index under different wave basis and decomposition levels表2 不同小波基,不同分解层次下WSRC字典结构指标和分类精度 /(%) |
| 小波基层次 | DB4 | Sym2 | Coif 2 | Dmey | |||||||
|---|---|---|---|---|---|---|---|---|---|---|---|
| OA | St | OA | St | OA | St | OA | St | ||||
| 原始层 | 70.10 | 0.98 | 70.10 | 0.98 | 70.10 | 0.98 | 70.10 | 0.98 | |||
| 第1层 | 72.70 | 1.01 | 73.29 | 1.02 | 72.77 | 1.01 | 73.60 | 1.01 | |||
| 第2层 | 74.00 | 1.03 | 73.71 | 1.03 | 74.32 | 1.03 | 75.40 | 1.03 | |||
| 第3层 | 65.94 | 1.04 | 62.95 | 1.03 | 67.78 | 1.03 | 69.28 | 1.02 | |||
Tab. 3 Different related indexes of the Dmey wavelet decomposition表3 Dmey小波基不同分解层次相关指标值 |
| Dmey | 类内距离 | 类间距离 | 信息损失量 | 结构指标St |
|---|---|---|---|---|
| 原始层 | 0.0031 | 0.0129 | 0.0000 | 0.0098 |
| 第1层 | 0.0027 | 0.0128 | 0.0022 | 0.0101 |
| 第2层 | 0.0024 | 0.0127 | 0.0039 | 0.0103 |
| 第3层 | 0.0022 | 0.0123 | 0.0102 | 0.0102 |
| 第4层 | 0.0019 | 0.0109 | 0.0305 | 0.0090 |
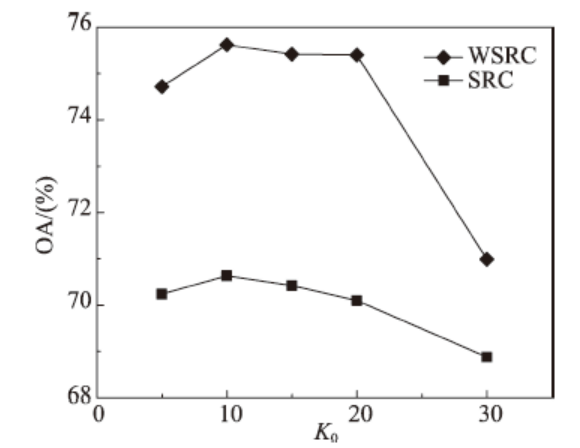
Fig. 2 WSRC and SRC classification results under different sparsity图2 不同稀疏度下WSRC与SRC分类结果比较 |
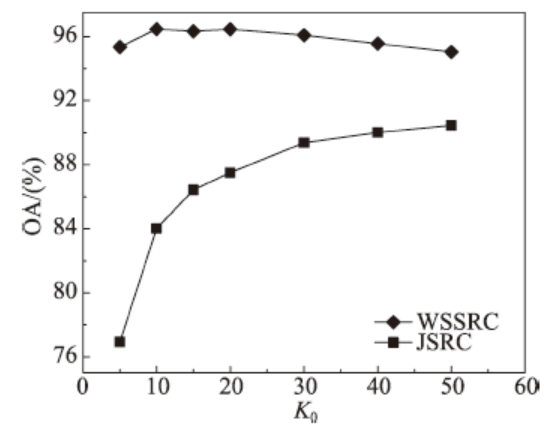
Fig. 3 WSSRC and JSRC classification results under different sparsity图3 不同稀疏度下WSSRC与JSRC分类结果比较 |
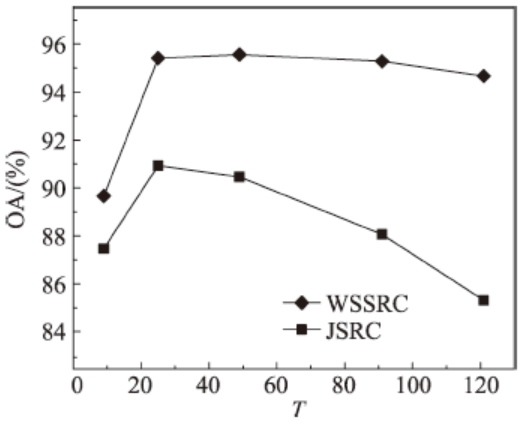
Fig. 4 WSSRC and JSRC classification results diffident window sizes图4 不同窗口下WSSRC与JSRC分类结果比较 |
Tab. 4 Different models of classification accuracy / (%)表4 不同模型各类别分类精度比较 / (%) |
| 类别 | SRC | WSRC | JSRC | WSSRC |
|---|---|---|---|---|
| 苜蓿 | 39.02 | 75.61 | 21.95 | 92.68 |
| 玉米I | 60.31 | 65.45 | 94.09 | 96.11 |
| 玉米II | 52.61 | 59.30 | 84.20 | 91.83 |
| 玉米III | 32.39 | 42.25 | 85.92 | 95.31 |
| 草I | 86.64 | 89.63 | 94.24 | 94.70 |
| 草II | 95.74 | 95.89 | 99.70 | 99.70 |
| 草III | 64.00 | 84.00 | 80.00 | 96.00 |
| 干草梗 | 95.81 | 97.44 | 100.00 | 100.00 |
| 燕麦 | 55.56 | 61.11 | 0.00 | 0.00 |
| 大豆I | 56.86 | 69.11 | 85.47 | 91.42 |
| 大豆II | 69.58 | 73.38 | 94.43 | 98.37 |
| 大豆III | 49.91 | 60.41 | 95.87 | 97.94 |
| 小麦 | 98.37 | 98.37 | 100.00 | 99.46 |
| 树丛 | 89.89 | 89.10 | 98.51 | 98.86 |
| 建筑物-草-树-路 | 41.21 | 51.87 | 85.59 | 93.95 |
| 石-钢顶棚 | 79.52 | 80.72 | 97.59 | 98.80 |
| OA | 69.53 | 74.46 | 92.98 | 96.46 |
| kappa系数 | 0.651 | 0.708 | 0.920 | 0.960 |
3.3 ROSIS数据 |
Tab. 5 9 Ground-truth classes of the ROSIS Pavia University data set, and the training and test sets for each class表5 9类真实地物及每类训练和测试样本数 |
| 序号 | 类别 | 训练 | 测试 |
|---|---|---|---|
| 1 | 柏油 | 664 | 5967 |
| 2 | 草甸 | 1865 | 16 784 |
| 3 | 碎石 | 210 | 1889 |
| 4 | 树 | 307 | 2757 |
| 5 | 金属板 | 135 | 1210 |
| 6 | 裸土 | 503 | 4526 |
| 7 | 沥青 | 133 | 1197 |
| 8 | 砖 | 369 | 3313 |
| 9 | 阴影 | 95 | 852 |
| 总计 | 4281 | 38 495 | |
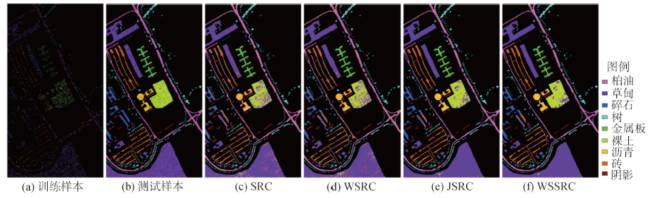
Fig. 5 Pavia University image图5 PaviaU影像 |
Tab. 6 Different models of classification accuracy / (%)表6 不同模型各类别分类精度比较 / (%) |
| 类别 | SRC | WSRC | JSRC | WSSRC |
|---|---|---|---|---|
| 柏油 | 79.97 | 82.62 | 90.16 | 96.75 |
| 草甸 | 92.75 | 93.11 | 99.41 | 99.21 |
| 碎石 | 66.65 | 68.29 | 82.69 | 80.36 |
| 树 | 89.01 | 88.68 | 94.41 | 95.43 |
| 金属板 | 99.83 | 99.67 | 99.92 | 99.92 |
| 裸土 | 66.06 | 66.02 | 74.04 | 79.89 |
| 沥青 | 68.17 | 76.44 | 89.31 | 88.22 |
| 砖 | 68.52 | 70.57 | 84.79 | 94.11 |
| 阴影 | 90.96 | 94.25 | 93.08 | 97.77 |
| OA | 83.42 | 84.54 | 92.12 | 94.57 |
| kappa系数 | 0.779 | 0.794 | 0.894 | 0.927 |
The authors have declared that no competing interests exist.
| [1] |
|
| [2] |
|
| [3] |
|
| [4] |
|
| [5] |
|
| [6] |
|
| [7] |
|
| [8] |
|
| [9] |
|
| [10] |
[
|
| [11] |
[
|
| [12] |
[
|
| [13] |
|
| [14] |
|
| [15] |
|
| [16] |
|
| [17] |
[
|
| [18] |
[
|
| [19] |
[
|
| [20] |
|
| [21] |
|
| [22] |
[
|
| [23] |
|
| [24] |
|
/
| 〈 |
|
〉 |