Orginal Article

Suitability Analysis on Behavior-based Aggregation of Land Use Classification in Yunnan Province

  • SUN Yunhua , 1, 2 ,
  • GUO Tao , 3, * ,
  • CUI Ximin 1 ,
  • CUI Weihong 2
Expand
  • 1. College of Geoscience and Surveying Engineering, China University of Mining & Technology, Beijing 100083, China
  • 2. Institute of Remote Sensing and Digital Earth, CAS, Beijing 100101, China
  • 3. School of Computer Science and Technology, Hunan University of Science and Technology, Xiangtan 411201, China
*Corresponding author: GUO Tao, E-mail:

Received date: 2015-05-30

  Request revised date: 2015-07-07

  Online published: 2016-03-10

Copyright

《地球信息科学学报》编辑部 所有

Abstract

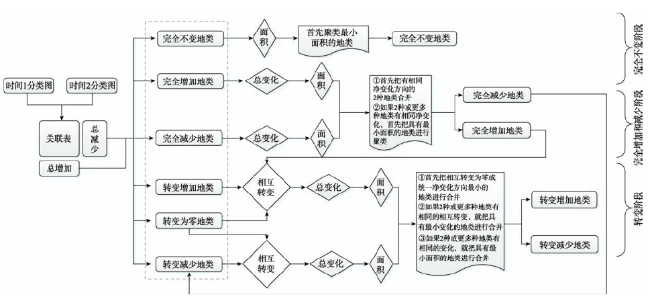
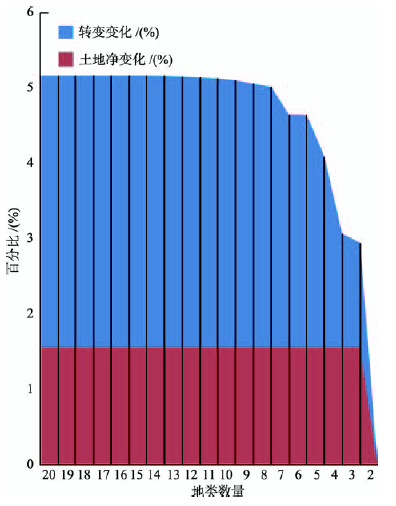
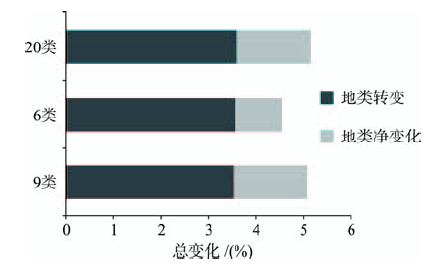
Comparison of the same study area between two time points on the same categorical variable can reveal changes occurred among categories over time, such as transitions among land categories. Therefore, it is an effective method to aggregate a large number of categories into a smaller number of broader categories in order to simplify interpretation and give insights concerning categorical change over time. We use an algorithm to aggregate categories in a sequence of steps based on the categories' behaviors in terms of gross losses and gross gains. The behavior-based algorithm aggregates net gaining categories with net gaining categories, and aggregates net losing categories with net losing categories, but doesn't aggregates a net gaining category with a net losing category. The algorithm's steps are summarized into three phases. The first phase is the Exclusive Zero phase, when our algorithm aggregates pairs of Exclusive Zero categories until all Exclusive Zero categories are aggregated into one comprehensive Exclusive Zeroes category, which remains as one of the three categories at the end of the algorithm. The second phase is the Exclusive Loser and Gainer phase, when the algorithm aggregates pairs of Exclusive Gainer categories and pairs of Exclusive Loser categories. The third phase is the swapping phase. In this final phase, our algorithm computes the transition sum for every possible pair of categories that have the same direction of net change. Moreover, the behavior-based algorithm at each step in the sequence keeps the values of net change and maximizes swap change. This article introduces three mathematical principles and defines six aggregation behaviors. In the last section of this article, we present a case study, in which the data are obtained in Yunnan Province between 1990 and 2010 for 20 land categories, in order to prove the advantage and feasibility of this algorithm in terms of area change and intensity change. The results show that the behavior-based algorithm produces a set of 9 categories that retains almost the original amount of change, while giving a total area change of 5.10%, which is only 0.06% lower than the original change. In contrast, the common used classification system of 6 categories produces a total area change of 4.7%, which is 0.4% lower than the results of our algorithm. It has been found that the behavior-based algorithm is an effective method to retain land use dynamic change information.

Cite this article

SUN Yunhua , GUO Tao , CUI Ximin , CUI Weihong . Suitability Analysis on Behavior-based Aggregation of Land Use Classification in Yunnan Province[J]. Journal of Geo-information Science, 2016 , 18(3) : 396 -405 . DOI: 10.3724/SP.J.1047.2016.00396

1 引言

土地涵盖了地球陆地表层的一切物质,结构复杂,与周围的环境不同,土地在地域之间存在着差异性,导致其可利用性,生产能力和利用方式不同.将不同类型的土地按照一定的规律方式,建立从属关系,形成了土地利用分类系统.长期以来,为了满足不同的需要,不同部门形成了不同的分类系统,主要包括:(1)全国农业区划委员会制定的土地利用分类系统,包括8个一级类型和46个二级类型[1];(2)中国科学院结合遥感特点制定的土地利用分类系统[2],包括6个一级类型和25个二级类型,并对耕地进行细分,增加了8个三级类型;(3)国土资源部制定的土地利用现状分类国家推荐标准[3],包括12个一级分类和57个二级分类.人们在利用这些分类系统时,均会根据工作需要或区域特点因地制宜地进行必要的调整和完善.
在同一研究区域内,对2期或多期时相的相同地类进行比较,可揭示地类随时间的动态变化.例如,不同地类之间的相互转变,如果地类过多,则难以从整体上把握变化趋势.对地类进行聚类的目的就是将2种或更多种地类进行合并得到较少但更具概括性的地类.聚类可简化解译过程,也可影响土地利用变化过程的分析和研究.一些基于先验聚类可简化过程,但会忽略某些重要的动态变化.Pontius和Malizia[4]对土地利用的聚类提出了5个土地利用变化行为原则,从数学角度进行了描述.此外,许多学者认为聚类可影响转移矩阵的结果[5-7].Aldwaik[8]在前人聚类原则的基础上,提出了6种行为聚类方式,但是并不一定适合国内土地利用系统的分类.因此,本文借鉴Aldwaik的基本理论,将其首次应用于国内常用土地利用分类系统的聚类过程,以探索该方法的可用性和普适性.

2 行为聚类算法

2.1 行为聚类的基本公式解释

式(1)-(6)分别定义了Lk,Gk,Tij,D,N,S.式(1)表示在时间间隔内地类k的总减少变化面积,Lk是地类jt时刻的总变化面积(括号内的公式)与主对角线保持不变地类面积Ckk的差值,J表示地类总数.式(2)表示在时间间隔内地类k的总增加变化面积,是地类i t + 1 时刻的总变化面积(括号内的公式)与主对角线保持不变地类面积Ckk的差值.式(3)的Tij表示关联表中除了对角线保持不变的地类面积,即地类i和地类j之间相互转变的总和;Cij表示某一时间间隔内由初始时刻的地类i转变为末期时刻地类j的面积;Cji表示某一时间间隔内由初始时刻的地类j转变为末期时刻地类i的面积.式(4)计算了在时间间隔 [ Y t , Y t + 1 ] 内,所有地类的总变化面积D,等于t时刻所有减少地类k的总面积,也等于在 t + 1 时刻所有增加地类k的总面积.式(5)定义了净变化N,来源于地类k的总增加面积Gk与总减少面积Lk之差的绝对值,除以2的原因是在t时刻地类k的总减少面积Lk t + 1 时刻总增加面积Gk同时存在.式(6)表示转变变化面积S等于总变化面积D与净变化面积N的差值.
L k = j = 1 J C kj - C kk (1)
G k = j = 1 J C ik - C kk (2)
T ij = C ij + C ji ( i > j ) (3)
D = k = 1 J L k = k = 1 J G k (4)
N = k = 1 J | L k - G k | 2 (5)
S = D - N (6)

2.2 行为聚类的3个原则

Pontius和Malizia[4]根据地类随时间的变化,提出了5个聚类原则,分析了按照一定聚类方式对总变化的净变化面积N和转变变化面积S产生的影响,这2部分变化之和即为整个时间间隔内的总变化面积D.总变化的净变化部分N是每种地类k的面积总数在2个时间点的差值,增加面积Gk大于减少面积Lk,则地类k为净增加地类,反之则是净减少地类;总变化的转变变化部分面积S是地类k在空间位置重新分配的过程,即同一时间间隔内,某一地类在一个空间位置发生了像元变化,在另外一个时间点同一空间位置的地类发生了像元重新分配.
对于聚类前的遥感解译影像,利用任意2个地类之间聚类可能性,得到聚类后的结果.本文从数学角度对下述的原则1,2,3进行了证明,聚类后的总变化面积D,净变化部分面积N和转变变化部分面积S取决于聚类前遥感解译影像中的地类A与地类B之间是否存在相互转换,以及是否存在时间间隔 [ Y t , Y t + 1 ] 内地类A与地类B转变时表现为净减少或净增加.3个原则都是基于整个时间间隔内的总变化D等于净变化面积N和转变变化面积S之和(式(6)).因此,由聚类产生的整个时间间隔内总变化面积差值 ΔTota l M 等于净变化面积差值 ΔNe t M 和转变变化面积差值 ΔSwa p M 之和,如式(7)所示.
ΔTota l M = ΔNe t M + ΔSwa p M (7)
原则1可应用于所有情况,也是提出其他原则的基础,原则2和原则3应用于减少地类和减少地类合并或增加地类和增加地类合并的情况.原则2描述了对总变化中净变化部分面积聚类产生的影响,原则3描述了总变化中转变变化部分面积在 聚类过程中产生的影响.原则1和原则2证明了原则3.
原则1:假设对于任意相互发生转变的地类都可进行聚类,则聚类会使整个时间间隔内总变化面积减少,差值用 ΔTota l M 表示.式(8)从数学角度表达了任意地类i和地类j相互发生转变,对地类i和地类j进行聚类后,总变化面积差值为 ΔTota l M .
ΔTota l M = - ( C ij + C ji ) (8)
任意2种地类合并后,二者之间的转变由非主对角线元素转为对角线元素.地类ij的合并会减少总变化面积,其值变为总变化面积D减去 C ij + C ji ,原因是 C ij + C ji 转变为保持不变的面积,即转变为对角线元素.地类合并导致遥感解译地图上总变化面积减少.聚类后总变化唯一不会减少的特例是没有发生任何转变的地类进行合并,即 C ij + C ji = 0 .
原则2:假设净减少地类和净减少地类合并或净增加地类和净增加地类合并,聚类后的遥感影像的净变化面积N保持不变.用数学语言来讲,如果( C + i - C i + 0 C + j - C j + 0 )或( C + i - C i + 0 C + j - C j + 0 ).其中, C + i 代表末期类型i的总量; C + i 代表的是初期类型i的总量; C j + 代表末期类型j的总量; C j + 代表初期类型j的总量(式(9)).
ΔNe t M = 0 (9)
原则3:假设净减少地类和净减少地类合并或净增加地类和净增加地类合并,聚类后的遥感解译影像上的转变变化面积减少.从数学角度来看,如果 C + i - C i + 0 C + j - C j + 0 ,或 C + i - C i + 0 C + j - C j + 0 ,则表示为式(10):
ΔSwa p M = - ( C ij + C ji ) (10)
当合并的地类显示为净变化方向时,地类ij的合并会使转变变化部分面积减少了 C ij + C ji .式(10)是式(8),(9)取代式(7)的结果.因此,原则3是原则1,2产生的直接结果,因为所有涉及地类聚类的原则都有相同的净变化方向.原则3适用于原则2所适用的所有条件.

2.3 行为聚类的6种行为方式

根据式(1),(2)定义了地类k在初始分类时的6种变化行为:
(1)当总减少 L k > 0 且总增加 G k = 0 ,聚类后遥感影像地类k在某一空间位置出现总减少,把这种聚类行为定义为完全减少地类(Exclusive Loser);
(2)当 L k = G k = 0 ,聚类后的遥感影像地类k既不出现增加也不出现减少的现象,把这种聚类的行为方式定义为完全不变地类(Exclusive Zero);
(3)当 L k = 0 G k > 0 ,聚类后的遥感影像地类k在空间某一位置仅出现了总增加,把这种行为聚类方式定义为完全增加地类(Exclusive Gainer);
(4)当 L k > G k > 0 ,聚类后的遥感影像地类k在空间某一位置增加,在空间其他位置减少,且地类k的总减少大于总增加,地类k在空间位置发生了重新分配现象,把这种行为聚类方式定义为转变减少地类(Swapping Loser);
(5)当 L k = G k > 0 ,聚类后的遥感影像地类k在空间上发生了地类增加和地类减少,且减少地类和增加地类面积相同,则把这种地类的行为聚类方式定义为转变为零地类(Swapping Zero);
(6)当 G k > L k > 0 ,聚类后的遥感影像地类k增加和减少在空间位置发生分配,并且增加地类的面积大于减少地类的面积,把这种地类行为聚类方式定义为转变增加地类(Swapping Gainer).

2.4 行为聚类算法流程

基于行为聚类的算法可在保持净变化不变的条件下合并地类,该算法不会将净增加地类和净减少地类合并.首先,将Tij最小的2种地类进行合并,每一步都会先将2种地类沿着同一个净变化方向进行合并,以最大可能保证转变变化部分的面积.
图1为行为聚类算法的流程,分为3个阶段.
Fig. 1 Methodological flow of the algorithm

图1 基于行为聚类的算法流程图

第1阶段是完全不变阶段(Exclusive Zero Phase),用该算法将所有完全不变(Exclusive Zero)的地类进行聚类,直到所有完全不变地类(Exclusive Zero)合并为一种综合的完全不变地类,在算法结束时仅保留3种地类中的一种.完全不变阶段通过选择具有最小变化信息的地类,决定了地类合并的先后次序.
第2阶段是完全减少和完全增加阶段,该阶段将完全增加地类和完全减少地类分别进行合并.该算法对完全增加地类的界定是在所有完全增加地类中具有最小的Tij;同理,对完全减少地类的限定是在所有完全减少地类中具有最小的Tij.先比较2种已经界定的地类,然后将具有最小Tij的地类合并.如果2种或更多的完全增加或减少地类有相同的Tij,该算法就会将包括保持不变类型的具有最小面积总和的地类合并.随后,进入下一步地类合并的过程.第2阶段产生2种地类,一种是完全减少地类,是所有完全减少地类的综合聚类结果;另一种是完全增加地类,对应的是所有完全增加地类的综合聚类结果.这2种地类是该算法下一个阶段进行聚类的可选地类.在该算法的前2个阶段,净变化和转变变化均为常数.
第3阶段是转变阶段,用该算法计算出每一对有相同净变化方向地类的Tij.地类对的界定是在所有减少地类对和所有增加地类对中具有最小的Tij.该算法会将已界定的转变减少地类或转变增加地类进行合并,同样具有最小的Tij.如果2种或更多种转变地类有相同的Tij,该算法就会将具有最小总变化的地类对合并.如果超过一对的地类有最小的Tij且有相同的最小总变化,该算法就会将具有最小总面积的地类对合并.新形成的地类又会参与到随后的聚类过程中,使用同样的逻辑原理,转变为零的地类可和增加地类,减少地类或另一个转变为零的地类形成一对进行聚类.可能的转变地类对是:增加地类和增加地类,增加地类和为零地类,减少地类和减少地类,减少地类和为零地类,为零地类和为零地类.随着聚类过程的推进,地类总数越来越少,净变化始终保持常数,而转变变化面积在随后聚类的每一步均会用Tij来逐渐缩小.

2.5 地类的强度变化分析

强度分析理论是Pontius研究团队提出的理论框架,是一种自上而下的分层等级的解释性的框架结构,用于分析地类之间的变化差异,由间隔层次,地类层次和转变层次3个层次构成[9-10].本研究只涉及到强度分析的地类层次,关于强度分析的更多理论可访问:https://sites.google.com/site/intensityanalysis/获取.
式(11)给出了研究区域整个时间范围 [ Y 1 , Y T ] 的统一变化强度,分子中的Ctij表示t时刻从地类i转变到地类j的面积,Ctjj表示t时刻转移矩阵中保持不变地类的面积.对于特定时间间隔 [ Y t , Y t + 1 ] ,式(12),(13)分别给出了地类的年均观察增加变化强度和年均观察减少变化强度,也在每个特定时间间隔内为每种地类产生了一个输出结果.通过比较观察变化强度大小和统一变化强度,如果某地类的强度变化大于统一变化强度,就称该地类是活跃的;如果某地类的变化强度小于统一变化强度,就称该地类是沉寂的.
U = t = 1 T - 1 j = 1 J i = 1 J C tij - C tjj / j = 1 J i = 1 J C t ij Y T - Y 1 × 100 % (11)
G tj = i = 1 J C tij - C tjj / Y t + 1 - Y t i = 1 J C tij × 100 % (12)
L ti = j = 1 J C tij - C tii / Y t + 1 - Y t j = 1 J C tij × 100 % (13)

3 算法实验结果与分析

利用中国科学院资源环境科学数据中心(http://www.resdc.cn/Default.aspx)提供的云南省1990年和2010年1:10万比例尺土地利用现状遥感监测数据为原始数据,采用刘纪远[11],张增祥[12]等建立的分类体系,包括6个一级分类和20个二级分类.为保证获取数据的解译质量和一致性,他们对每期数据集都进行统一的质量检查和数据集成[12].通过对每期数据开展野外考察,实地调查(除台湾省以外)各省土地利用情况,获取大量的外业调查记录,照片,对野外调查资料与外业实地记录,按照县数10%的比例随机抽样开展精度验证.土地利用一级类型综合评价精度达到94.3%以上,二级类型分类综合精度达91.2%以上,满足1:10万比例尺用户制图精度[11-17].本实验采用其二级分类体系,利用行为聚类算法,得到9种土地利用类型,最后与刘纪远[11]等建立的一级分类体系结果进行比较.
本文从面积变化和强度变化2个方面,对6个一级类型和行为聚类结果的9个土地类型进行对比.在变化分析中,对比了2个分类体系的变化面积(包括总增加(Gk),总减少(Lk)和保持不变3部分)以及变化强度(增加强度和减少强度2部分).从变化面积来看,基于行为聚类方式保留了最大化的转变变化部分面积和保持净变化面积不变,而6类的分类体系出现了净变化和转变变化,从关联表的非对角线元素转移到对角线上,导致整个时间间隔内的总变化面积减少,使得研究区域的真实变化没有反映出来.从增加强度和减少强度来看,6类分类体系的林地表现为增加强度和减少强度均是活跃的,而9类分类体系可明显地看出森林地的减少强度和园地的增加强度是活跃的,结合转移矩阵可知,园地的增加来自森林地的减少,可更清晰地看出将林地细致分类的优点.

3.1 基于行为聚类结果

基于行为聚类的算法是按照3个原则和6种行为方式进行两两合并,只能将净减少地类和净减少地类合并,净增加地类和净增加地类合并,净增加地类与净减少地类不能合并.表1是对原始的分类体系利用行为聚类算法的合并次序.由表1可知,保持地类净变化不变,地类转变变化保留最大时,所合并的地类数为9类.此时,地类总变化由5.16%减少到5.10%,减少了0.06%,地类转变变化由3.60%减少到3.53%,减少了0.07%,地类净变化面积保持不变,这样保持地类总变化面积为最大.
Tab. 1 Behavior-based aggregation sequence

表1 基于行为聚类方法的次序

地类数量 地类总变化/(%) 转变变化/(%) 净变化/(%) 聚类次序 聚类类型
20 5.16 3.60 1.56 湖泊,沼泽地 G/净增加,G/净增加
19 5.16 3.60 1.56 河渠,水库坑塘 G/净增加,G/净增加
18 5.16 3.60 1.56 冰川与永久积雪,裸地 L/净减少,L/净减少
17 5.16 3.60 1.56 低覆盖度草地,滩地 G/净增加,G/净增加
16 5.16 3.60 1.56 有林地,聚类18 L/净减少,L/净减少
15 5.16 3.60 1.56 聚类16,裸岩石砾地 L/净减少,L/净减少
14 5.16 3.60 1.56 旱地,聚类20 G/净增加,G/N净增加
13 5.15 3.59 1.56 聚类14,聚类17 G/净增加,G/净增加
12 5.15 3.58 1.56 水田,聚类 15 L/净减少,L/净减少
11 5.14 3.57 1.56 聚类13,聚类 19 G/净增加,G/净增加
10 5.12 3.56 1.56 聚类11,工交建设用地 G/净增加,G/净增加
9 5.10 3.53 1.56 聚类10,城镇 G/净增加,G/净增加
8 5.05 3.49 1.56 疏林地,中覆盖度草地 L/净减少,L/净减少
7 5.01 3.45 1.56 聚类12,灌木林地 L/净减少,L/净减少
6 4.64 3.08 1.56 其他林地,农村居民点 G/净增加,G/净增加
5 4.64 3.08 1.56 聚类7,聚类8 L/净减少,L/净减少
4 4.09 2.52 1.56 聚类5,高覆盖度草地 L/净减少,L/净减少
3 3.06 1.50 1.56 聚类9,聚类6 G/净增加,G/净增加
2 2.95 1.38 1.56
图2是聚类结果,第1阶段是完全不变阶段,原始分类体系由20类进行两两聚类,聚类到17类时,地类总变化与原始分类结果地类总变化一样,没有发生变化.第2阶段是完全减少和增加阶段,这个阶段是将完全增加地类和完全减少地类进行界定,分别找到完全增加地类和完全减少地类界定的最小值进行合并,聚类到地类14;地类16是有林地和聚类18进行合并,地类15是聚类16与裸岩石砾地进行合并.第3阶段是转变阶段,这部分是地类转换面积变化最为剧烈阶段,聚类到9类时转变变化开始出现下降,因此,本文选择9类作为最终结果.地类13是聚类14和聚类17进行合并,地类12是水田和聚类15进行合并,地类11是聚类13和聚类19进行合并,地类10是聚类11和交通建设用地进行合并,地类9是聚类10与城镇地类进行合并.随着聚类过程的推进,地类总数越来越少,净变化始终保持为常数,而转变变化在随后聚类的每一步都会逐渐减少.结合表1图2可知,聚类为2类时,净变化仍保持常数,地类转变变化从3.60%减少到1.38%,转换变化部分达到最小.
Fig. 2 Swap change and net change during 1990-2010 in terms of percentage on the study extent for the behavior-based aggregation sequence

图2 1990-2010年行为聚类次序地类转换和地类净变化面积百分比

根据行为聚类的方法,并结合合理的逻辑顺序,将20种地类重分类成9类,即:(1)耕地(11:水田,12:旱地);(2)森林地(21:有林地,22:灌木林地);(3)疏林地(23:疏林地);(4)园地(24:其他林地);(5)天然牧草地(31:高覆盖牧草地,32:中覆盖草地);(6)人工草地(33:低覆盖草地);(7)水域(41:河渠,42:湖泊,43:水库坑塘,44:冰川永久积雪,46:滩地,64:沼泽地);(8)建设用地(51:城镇,52:农村居民点用地,53:工交建设用地);(9)裸地(65:裸地,66:裸岩石砾地).

3.2 1990-2010年6个和9个土地利用类型变化 面积和变化强度

图3(a)是1990-2010年6个土地利用类型分类结果变化面积,建设用地,林地和水域的增加面积大于减少面积,并且都大于零,属于转变增加地类(Swapping Gainer);耕地,草地和裸地的增加面积小于减少面积,但都大于零,属于转变减少地类(Swapping Loser).结合图3(a)和表2的转移矩阵可看出,建设用地和林地增加面积主要来自于耕地和草地,也存在耕地,草地和林地之间的相互转换.
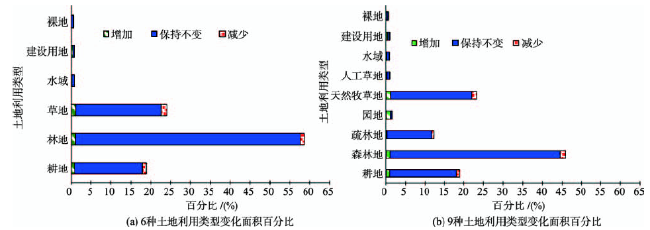
Fig. 3 Percentage of area change of different land categories during 1990-2010

图3 1990-2010年土地利用类型变化面积百分比

Tab. 2 Cross-tab of six land categories during 1990-2010 in Yunnan Province (hm2)

表2 1990-2010年云南省6个一级类型的转移矩阵(hm2)

1990年 2010年
耕地 林地 草地 水域 建设用地 裸地 总减少
耕地 6 530 509 120 729 146 418 6122 99 727 1407 374 403
林地 104 013 21 606 562 239 751 5735 16 805 766 367 072
草地 211 137 299 079 8 216 116 5935 21 057 1644 538 852
水域 2156 1413 8898 270 013 784 158 13 409
建设用地 5597 1023 1362 645 170 057 473 9100
裸地 2234 1413 57 804 275 96 151 779 61 822
总增加 325 137 423 658 454 233 18 712 138 469 4448
图3(b)是1990-2010年行为聚类土地利用分类结果的变化面积,建设用地,园地,人工草地和水域的增加面积大于减少面积,并且都大于零,属于转变增加地类(Swapping Gainer);森林地,疏林地,耕地,天然牧草地和裸地的减少面积大于增加面积,并且都大于零,属于转变减少地类(Swapping Loser).从表3的转移矩阵可看出,建设用地的增加主要源于耕地的减少,园地的增加源于森林地和天然牧草地的减少.这也可看出,原始森林转为橡胶园茶园的面积逐年增加[18],并且随着桉树等速生经济林的广泛种植[19],虽然云南省林地总面积增加,但生物多样性降低,水源涵养性变弱,水土流失严重,干旱等自然灾害加重[20].
Tab. 3 Cross-tab of nine land categories during 1990-2010 in Yunnan Province (hm2)

表3 1990-2010年云南省行为聚类结果的转移矩阵(hm2)

1990年 2010年
耕地 森林地 疏林地 园地 天然牧草地 人工草地 水域 建设用地 裸地 总减少
耕地 6 529 142 81 532 19 346 19 823 144 086 2244 6088 99 711 1407 374 237
森林地 60 799 16 675 113 17 398 226 482 179 115 31 4218 11076 321 499 443
疏林地 38 126 68 825 4 406 585 44 312 57 316 63 1446 4352 403 214 843
园地 5079 1289 199 157 009 3139 32 43 1373 42 11 196
天然牧草地 210 692 197 730 22 972 76 378 7 948 931 2085 5888 20 270 1621 537 636
人工草地 419 1652 240 23 6920 254 358 26 785 23 10 088
水域 2147 980 295 138 5563 3335 268 223 781 158 13 397
建设用地 5597 479 356 188 1362 0 645 170 052 473 9100
裸地 2234 1413 0 0 12 124 45 540 275 96 151 324 61 682
总增加 325 093 353 899 60 806 367 344 409 625 53 330 18 629 138 444 4448 374 237
图3(a)和图3(b)的结果可看出,2种分类体系中的耕地,裸地,建设用地和水域变化面积基本一致.9种分类结果中的天然牧草地和人工草地相对于6种分类结果仅一种草地而言,可更清晰地表明,发生动态变化较大的是天然牧草地.6种分类结果中的林地对应于9种分类结果中的园地,森林地和疏林地,可看出园地增加更明显,疏林地和森林地减少较多,但6种分类结果中的林地仅表现出增加略大于减少.对比结果表明,基于行为聚类的方法可更清晰地揭示地类变化过程中的细微变化,这对于深入理解地类变化,挖掘变化来源,进而揭示土地利用变化所造成的宏观生态环境变化及其他环境效应具有重要意义.
图4(a)是6类分类体系的强度分析结果,林地的增加强度和减少强度均位于统一强度线右侧,属于活跃型地类.建设用地和耕地的增加强度位于统一强度线右侧,属于增加活跃型地类.裸地的减少强度位于统一强度线右侧,属于减少活跃型地类.水域和草地的增加强度和减少强度位于统一强度线左侧,属于沉寂型地类.由图3(a)和表2可知,在6种土地利用类型中林地是转变面积最大的地类,也体现为活跃型.这说明林地转换为其他地类具有最大的变化面积和最强的变化强度,这和1990年林地面积占整个研究区域的比重较大有关.此外,自1989年以来,中国为恢复和扩大森林植被,遏制水土流失,综合治理江河,首次实施了大规模的林业生态工程[20].20世纪末,云南开始实施退耕还林工程,尤其经济林的建设,这也是林地变化强度表现为活跃型的原因.由于建设用地具有不可逆性,表现为其他土地利用类型向建设用地转入,而建设用地转变为其他土地利用类型的面积极少,因此,建设用地表现出了很强的增加强度,转变速度快,属于典型的增加活跃型地类.草地和水域距离统一强度线较近且具有相同变化方向的增加强度和减少强度.裸地表现为弱的增加强度和强的减少强度,原因是人们加大对裸地的开发程度,导致裸地转化为其他地类,所以,裸地减少强度大于增加强度.
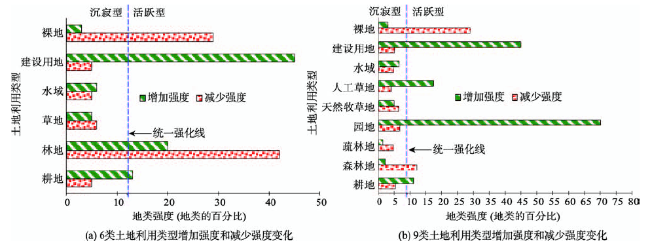
Fig. 4 Gross gain intensity and gross loss intensity of different land categories during 1990-2010

图4 1990-2010年土地利用类型增加强度和减少强度变化

图4(b)是利用行为聚类算法得到的9种土地利用类型的强度变化结果.裸地,建设用地,水域和耕地的变化强度方向和6个一级类型的变化强度方向一致.人工草地的增加强度位于统一强度线右侧,属于活跃型.园地的增加强度远远大于其他地类的增加强度,而森林地的减少强度也是活跃的,结合表3的转移矩阵可看出,园地的增加来自森林地的减少.查阅资料发现近20年来茶叶和天然橡胶涨势显著,特别是2006年以来橡胶价格暴涨,巨大的经济利益刺激了茶园和橡胶园等园地的扩张[19].
图4(a)和图4(b)相比,行为聚类的结果详细地体现出了土地利用类型中草地和林地的变化强度,森林地,疏林地和园地比6个一级类型的林地更加详细说明地类之间的变化,人工草地的增加强度较强,主要来自裸地的减少(表3).

3.3 分类结果对比分析

图5分别对基于行为聚类,6类分类体系和原始分类结果进行比较,这三者都具有相同大小的地类净变化,地类转变变化减少的百分比由大到小依次是:原始分类结果>行为聚类结果>6类分类体系,其中行为聚类方式可保持地类转变部分信息最大,比6类的分类系统可更好反映土地利用变化动态过程.
Fig. 5 Comparison between the 20 original categories, the 6 common used categories and the 9 behavior-based categories

图5 基于行为聚类,常用分类系统和原始分类系统结果比较

4 结论与讨论

通过建立行为聚类算法,对地类间合并的行为方式和合并方向进行界定.以1990年和2010年云南省20个二级类型的分类结果为数据源进行聚类,从变化面积和变化强度2方面进行了对比分析.
(1)与其他降维方法相比,基于行为聚类的算法是否合适取决于特定的研究问题.如果详细地类存在大量的行为方式(如上述6种行为都存在或存在多数),则行为聚类的算法合适.例如,科学家需理解林地的具体变化过程,则行为聚类的算法将林地分为3类是有益的.但是,如果详细地类存在一致的行为方式(如全部为转变增加地类或全部为转变减少地类),则行为聚类算法不合适.例如,6类中的耕地和9类中的耕地变化类似,则没有必要再细分.
(2)云南省地处西南山区,林地占全省总面积的53%[22],6个一级类型中的林地的增加和减少强度均是活跃的,从9个类型来看,具体体现为森林地的减少强度和园地的增加强度是活跃的.结合转移矩阵来看,园地的增加主要来自森林地的减少,这对云南省的生物多样性保护是不利的,需尽快采取措施,保护原始森林.2种分类体系中的建设用地均表现出强的增加强度,主要来自耕地的减少,这与野外调查结果一致.
(3)从数学角度证明了聚类算法的3个原则,定义了6种行为聚类方式.按照某一种方式两两地类之间合并,始终保持净变化不变.实验结果表明,在特定的样本环境下,该方法得到的分类结果能保持地类转变信息,并有效缩减分类的维度.但是,该算法没有充分考虑专家知识,可能在最后会出现把概念上属于2个地类的种类进行合并.下一步工作将会加入其他原则,假设增加地类和减少地类进行合并,使聚类结果加入专家知识后更合理,但可能导致净变化出现减少,转变变化出现减少,增加,保持不变的现象.
(4)基于行为的聚类算法具有广泛应用前景,可对植被覆盖,土壤侵蚀数据和其他数据进行聚类.本文使用的聚类算法只考虑了一个时间间隔的数据,下一步会利用大于一个时间间隔的多期数据进行聚类,从整个系统论的角度进行行为聚类,使其更符合实际需求.
致谢:感谢美国克拉克大学地理学院Robert Gilmore Pontius, Jr教授给予的指导.感谢中国科学院遥感与数字地球研究所张增祥研究员提出的宝贵意见.

The authors have declared that no competing interests exist.

[1]
全国农业区划委员会.土地利用现状调查技术规程[M].北京:测绘出版社,1984.

[ National agricultural zoning committee. Technology procedures of land use status quo survey[M]. Beijing: Surveying and Mapping Press, 1984. ]

[2]
刘纪远. 中国资源环境遥感宏观调查与动态研究[M].北京:科学出版社,1996.

[ Liu J Y.Macro-scale survey and dynamic study of natural resources and environment of china by remote sensing [M]. Beijing: China Science and Technology Press, 1996. ]

[3]
中华人民共和国国家质量监督检验检疫总局国家标准化管理委员会.中华人民人民共和国国家标准——土地利用现状分类(GB/T21010-2007)[S].北京:中国标准出版社,2007.

[ Standardization Administration of China. The standard of the people's Republic of China: classification of land use status(GB/T21010-2007)[S]. Beijing: Standards Press of China, 2007. ]

[4]
Pontius Jr R G, Malizia N R. Effect of category aggregation on map comparison[J]. Geographic Information Science, 2005,3234:251-268.This paper investigates the influence of category aggregation on measurement of land-use and land-cover change. To date, research concerning data aggregation has examined primarily the effects of modifying the unit of observation (i.e., the modifiable areal unit problem and the ecological inference problem); here, we examine the effects of changing the categorical definition, such as the conversion from many, detailed Anderson Level II classes to fewer, broader Anderson Level I classes. Cross-tabulation matrices are used to analyze the change between two times for aggregated and unaggregated versions of identical landscapes. A mathematical technique partitions the Total change as the sum of Net (i.e., quantity change) and Swap (i.e., location change). This paper shows that the Total and Net exhibited by maps between two points in time can be substantially reduced through land-use category aggregation, but cannot be increased. Swap, however, can be reduced or increased by the aggregation of categories. We derive five principles that dictate the effect of aggregation and illustrate the principles using both simplified examples and empirical data. The empirical data are from three Human Environment Regional Observatory sites. The principles are mathematical facts that apply to the analysis of any categorical variable.

DOI

[5]
Ahlqvist O, Shortridge A.Spatial and semantic dimensions of landscape heterogeneity[J]. Landscape Ecology,2010,25(4):573-590.This paper addresses the challenge of measuring spatial heterogeneity in categorical map data. Spatial heterogeneity is a complex notion that involves both spatial variability and attribute variability, and metrics to capture this are a product of their developers’ simplifying assumptions about both spatial and attribute dimensions. We argue that the predominantly binary treatment of categorical data is frequently an unnecessary oversimplification that can be replaced by ordered measures based on semantic similarity evaluations. We develop a typology of autocorrelation metrics for categorical data that identifies a critical gap: existing measures are limited in their ability to capture variability of both spatial and attribute dimensions simultaneously. We demonstrate an approach to formally characterize the semantic similarity between pairs of categorical data classes as a continuous numeric variable. A series of experiments on synthetic and actual land cover data contrasts the information content provided by metrics representative of all portions of the typology: the recently proposed semantic variogram, the indicator variogram, the contagion index, and the edge contrast index. Experimental results suggest that the typology captures essential qualities of metric information richness. Among our findings is that the commonly used contagion index is directly correlated with Moran’s I for 2-class maps but it fails to distinguish between negatively and positively autocorrelated patterns. We identify the semantic variogram as the only metric that can simultaneously detect both spatial and semantic attribute aspects of categorical autocorrelation. The semantic variogram is also relatively robust to attribute scale changes and therefore less sensitive to class aggregation than the other metrics.

DOI

[6]
Buyantuyev A, Wu J.Effects of thematic resolution on landscape pattern analysis[J]. Landscape Ecology, 2007,22(1):7-13.<a name="Abs1"></a>The thematic resolution of mapped data determines the amount of detail of geospatial information, and influences various aspects of landscape classification and the relevance of derived pattern attributes to particular ecological questions. Here we show that changing thematic resolution may significantly affect landscape metrics and in turn their ability to detect landscape changes. The effects of thematic resolution on many landscape metrics tend to show consistent general patterns, but the details of these patterns are likely to be dependent on specific landscape patterns and classification criteria. Thus, the effects of thematic resolution, like those with regard to grain and extent, must be considered in landscape pattern analysis.

DOI

[7]
Buyantuyev A, Wu J, Gries C.Multiscale analysis of the urbanization pattern of the Phoenix metropolitan landscape of USA: Time, space and thematic resolution[J]. Landscape and Urban Planning, 2010,94:206-217.Investigating the ecological consequences of urbanization require knowledge of land-cover dynamics. Quantification of land-use/land-cover change in Phoenix, Arizona during the period of 1985鈥2005 using landscape metrics computed from Landsat-derived maps revealed temporal patterns of landscape composition and configuration. With accelerated urbanization the landscape as a whole became more fragmented ecologically and more complex compositionally and geometrically. However, the majority of individual patches became more compact in shape. Urban land covers, especially xeric residential, increased substantially and the desert decreased by 20%. Spatial and thematic resolution of data was shown to have large effects on the analysis of land-cover pattern. Our results, while agreeing in general with previously reported scaling relations with respect to changing spatial grain and extent, showed that scaling relations are also robust and consistent across thematic resolutions and time periods. Some metrics behaved unpredictably and some exhibited scale-free behavior. Compositional metrics, such as patch density, diversity, evenness, and largest patch index, were well correlated with vegetative cover, its spatial variation, and population density. Many of these correlations exhibited hump-shaped patterns with respect to increasing grain size, indicating a characteristic scale at approximately 500鈥1000m. By simultaneously manipulating spatial and thematic resolutions, the importance of the Modifiable Area Unit Problem in relating landscape patterns to vegetation and socio-economic variables was also demonstrated. Additionally, highly variable desert vegetation due to precipitation variability poses a challenge for accurately quantifying urbanization pattern in arid environments. Choosing appropriate spatial, temporal and thematic resolutions is essential in meeting this challenge.

DOI

[8]
Aldwaik S Z, Onsted J A, Pontius Jr R G. Behavior-based aggregation of land categories for temporal change analysis[J]. International Journal of Applied Earth Observation and Geo-information, 2015, 35,Part B(1):229-238.Comparison between two time points of the same categorical variable for the same study extent can reveal changes among categories over time, such as transitions among land categories. If many categories exist, then analysis can be difficult to interpret. Category aggregation is the procedure that combines two or more categories to create a single broader category. Aggregation can simplify interpretation, and can also influence the sizes and types of changes. Some classifications have an a priori hierarchy to facilitate aggregation, but an a priori aggregation might make researchers blind to important category dynamics. We created an algorithm to aggregate categories in a sequence of steps based on the categories鈥 behaviors in terms of gross losses and gross gains. The behavior-based algorithm aggregates net gaining categories with net gaining categories and aggregates net losing categories with net losing categories, but never aggregates a net gaining category with a net losing category. The behavior-based algorithm at each step in the sequence maintains net change and maximizes swap change. We present a case study where data from 2001 and 2006 for 64 land categories indicate change on 17% of the study extent. The behavior-based algorithm produces a set of 10 categories that maintains nearly the original amount of change. In contrast, an a priori aggregation produces 10 categories while reducing the change to 9%. We offer a free computer program to perform the behavior-based aggregation.

DOI

[9]
Aldwaik S Z, Pontius Jr R G. Intensity analysis to unify measurements of size and stationarity of land changes by interval, category, and transition[J]. Landscape and Urban Planning, 2012,106(1):103-114.This article presents a quantitative method to analyze maps of land categories from several points in time for a single site by considering cross-tabulation matrices, where one matrix summarizes the change in each time interval. There are three levels of analysis, starting from general to more detailed levels, where each level exposes different types of information given the previous level of analysis. First, the interval level examines how the size and speed of change vary across time intervals. Second, the category level examines how the size and intensity of gross losses and gross gains in each category vary across categories for each time interval. Third, the transition level examines how the size and intensity of a category's transitions vary across the other categories that are available for that transition. At each level, the method tests for stationarity of patterns across time intervals. The unique contribution of this article is that it combines all three levels of analysis into one unified framework that we call intensity analysis, where the more detailed levels are conditional on the less detailed levels. The illustrative case study is for seven categories at the Plum Island Ecosystems site in northeastern Massachusetts, USA, where the largest transition is from Forest to Built during 1985, 1991, and 1999. We compare our approach to other established methods such as the Markov approach in order to show how our proposed intensity analysis gives more information concerning five possible reasons to explain why the transitions vary across time and space.

DOI

[10]
Pontius Jr R G, Gao Y, Giner N M, et al. Design and interpretation of intensity analysis illustrated by land change in Central Kalimantan, Indonesia[J]. Land, 2013,2(3):351-369.Intensity Analysis has become popular as a top-down hierarchical accounting framework to analyze differences among categories, such as changes in land categories over time. Some aspects of interpretation are straightforward, while other aspects require deeper thought. This article explains how to interpret Intensity Analysis with respect to four concepts. First, we illustrate how to analyze whether error could account for non-uniform changes. Second, we explore two types of the large dormant category phenomenon. Third, we show how results can be sensitive to the selection of the domain. Fourth, we explain how Intensity Analysis’ symmetric top-down hierarchy influences interpretation with respect to temporal processes, for which changes during a time interval influence the sizes of the categories at the final time, but not at the initial time. We illustrate these concepts by applying Intensity Analysis to changes during one time interval (2000–2004) in a part of Central Kalimantan for the land categories Forest, Bare and Grass.

DOI

[11]
刘纪远,张增祥,庄大方,等.二十世纪九十年代中国土地利用变化的遥感时空信息研究[M].北京:科学出版社,2005.

[ Liu J Y, Zhang Z X, Zhuang D F, et al.Remote sensing information study of land use change in China in 1990s [M]. Beijing: Sciences Press, 2005. ]

[12]
张增祥,赵晓丽,汪潇,等.中国土地利用遥感监测[M].北京:星球地图出版社,2012.

[ Zhang Z X, Zhao X L, Wang X, et al.Remote sensing monitoring of land use in China[M]. Beijing: Starmap Press, 2012. ]

[13]
刘纪远,匡文慧,张增祥,等.20世纪80年代末以来中国土地利用变化的基本特征与空间格局[J].地理学报,2014,69(1):3-14.土地利用/土地覆被变化(LUCC)是人类活动与自然环境相互作用最直接的表现形式,本文采用相同空间分辨率的卫星遥感信息源和相同的技术方法,对中国1980 年代末到2010 年土地利用变化数据进行定期更新。在此基础上,提出并发展土地利用动态区划的方法,研究土地利用变化的空间格局与时空特征。我们发现:1990-2010 年的20 年间,中国土地利用变化表现出明显的时空差异。“南减北增,总量基本持衡,新增耕地的重心逐步由东北向西北移动”是耕地变化的基本特征;“扩展提速,东部为重心,向中西部蔓延”是城乡建设用地变化的基本特征;“林地前减后增,荒漠前增后减,草地持续减少”是非人工土地利用类型变化的主要特征。20 世纪末与21 世纪初两个10 年相比,中国土地利用变化空间格局出现了一些新特征,原有的13 个土地利用变化区划单元演变为15 个单元,且部分区划单元边界发生变化。主要变化格局特征为黄淮海地区、东南部沿海地区、长江中游地区和四川盆地城镇工矿用地呈现明显的加速扩张态势;北方地区耕地开垦重心由东北地区和内蒙古东部转向西北绿洲农业区;东北地区旱作耕地持续转变为水田;内蒙古农牧交错带南部、黄土高原和西南山地退耕还林还草效果初显。近20 年间,尽管气候变化对北方地区的耕地变化有一定的影响,但政策调控和经济驱动仍然是导致我国土地利用变化及其时空差异的主要原因。2000 年后的第一个10 年,土地利用格局变化的人为驱动因素已由单向国土开发为主,转变为开发与保护并重。在空间格局变化的分析方法方面,应用“动态区划法”开展世纪之交两个10 年中国LUCC空间格局变化的分析,有效揭示了20 年来中国LUCC“格局的变化过程”,即动态区划边界的推移、区划单元内部特征的变化与单元的消长等;以及“变化过程的格局”,即土地利用变化过程与特征的分阶段区域差异,清晰刻画了LUCC动态区划中区划单元的消长,单元边界的变动,以及前后10 年的变化强度特征,揭示了土地利用“格局”与“过程”之间的交替转化规律,以及不同类型和区域的变化原因,证明了该分析方法的有效性。

DOI

[ Liu J Y, Kuang W H, Zhang Z X, et al.Spatiao-temporal characteristics, patterns and causes of land-use changes in China since the late 1980s[J]. Journal of Geographical Sciences, 2014,24(2):195-210. ]

[14]
刘纪远,刘明亮,庄大方,等.中国近期土地利用变化的空间格局分析[J].中国科学D辑,2002,32(12):1031-1040.在全球环境变化研究中, 土地利用和土地覆被动态越来越被认为是一个关键而迫切的研究课题. 依据覆盖中国1990年代末期5 a时间间隔的陆地卫星数据资料, 研究了土地利用变化的特征和空间分布规律. 依据土地利用动态度的概念, 在1 km格网土地利用变化数据基础上, 根据区域近期土地利用动态特点与社会、自然环境综合特征, 设计了全国土地利用动态区划图, 揭示了土地利用变化过程的空间格局. 总体上, 传统农作区(包括黄淮海平原、长江三角洲地区和四川盆地等)城镇居民建设用地的扩张侵占了大面积的耕地, 而北方农牧交错带与西北绿洲农业区由于生产条件、经济利益和气候变化等方面的原因, 耕地开垦现象最为突出. 国家退耕还林还草政策的实施效果在局部地区有所体现, 但截至2000年, 尚未对土地覆被变化产生区域性的影响, 此5 a期间森林砍伐现象依然比较严峻. 本项研究, 实现了中国现代土地利用动态区域单元的划分, 揭示了中国现代土地利用变化的时间-空间属性并为其特征分析提供了区域格局框架. 该项研究是地理科学对研究对象的"空间格局"与"时间过程"特征进行集成研究, 揭示研究对象"变化过程的格局", 以及"格局的变化过程"的一次有益的尝试.

DOI

[ Liu J Y, Liu M L,Zhuang D F, et al.Spatial pattern analysis of land use recent change in China[J]. Science in China(Series D), 2002,32(12):1031-1040. ]

[15]
张增祥,汪潇,王长耀,等.基于框架数据控制的全国土地覆盖遥感制图研究[J].地球信息科学学报,2009,11(2):216-224.土地覆盖研究是全球变化的一个重要内容。本文针对中国土地覆盖实际情况,从遥感制图角度和陆地生态系统观点出发,建立了一种基于陆地生态系统特点的土地覆盖遥感分类体系。充分利用目视解译的精确性和自动分类的快速性,在高精度目视解译数据提供的基本覆盖类型及其位置、边界的控制下,以250m分辨率的2005年MODIS植被指数产品为遥感分类信息源,获取主要类型的详细分类信息,并结合人机交互判读分析与相关资料等的综合运用,实现2005年全国土地覆盖遥感制图。对比实地调查结果的精度分析表明:土地覆盖制图的类型分类准确,基本上反映了各地区的土地覆盖特点和分布趋势,图斑格局与影像地理特征基本吻合,全国土地覆盖制图总体准确率为91%,各类型准确率也达89%以上。

[ Zhang Z X, Wang X, Wang C Y, et al.National land cover mapping by remote sensing under the control of interpreted data[J]. Journal of geo-information science, 2009,11(2):216-224. ]

[16]
Liu J Y,Liu M L, Zhuang D F, et al. Study on spatial pattern of land-use change in China during 1995-2000[J]. Science in China, 2003,46(4):373-384.Land-use/cover change has become an event being of paramount importance to the study of global environmental change[1,2]. Land-cover change is closely related to the terrestrial surface material cycles and life-support processes[3], i.e., the interaction

DOI

[17]
Liu J Y, Zhang Z X, Xu X L, et al.Spatial patterns and driving forces of land use change in China during the early 21st century[J]. Journal of Geographical Sciences, 2010,20(4):483-494.lt;p>Land use and land cover change as the core of coupled human-environment systems has become a potential field of land change science (LCS) in the study of global environmental change. Based on remotely sensed data of land use change with a spatial resolution of 1 km &times; 1 km on national scale among every 5 years, this paper designed a new dynamic regionalization according to the comprehensive characteristics of land use change including regional differentiation, physical, economic, and macro-policy factors as well. Spatial pattern of land use change and its driving forces were investigated in China in the early 21st century. To sum up, land use change pattern of this period was characterized by rapid changes in the whole country. Over the agricultural zones, e.g., Huang-Huai-Hai Plain, the southeast coastal areas and Sichuan Basin, a great proportion of fine arable land were engrossed owing to considerable expansion of the built-up and residential areas, resulting in decrease of paddy land area in southern China. The development of oasis agriculture in Northwest China and the reclamation in Northeast China led to a slight increase in arable land area in northern China. Due to the &ldquo;Grain for Green&rdquo; policy, forest area was significantly increased in the middle and western developing regions, where the vegetation coverage was substantially enlarged, likewise. This paper argued the main driving forces as the implementation of the strategy on land use and regional development, such as policies of &ldquo;Western Development&rdquo; &ldquo;Revitalization of Northeast&rdquo; coupled with rapidly economic development during this period.</p>

DOI

[18]
刘晓娜,封志明,姜鲁光,等.西双版纳土地利用/土地覆被变化时空格局分析[J].资源科学,2014,36(2):233-244.西双版纳土地利用/土地覆被变 化对于区域土地资源合理利用和生态环境保护以及边境安全保障具有重要意义。基于Landsat TM/ETM遥感数据,采用决策树分类方法,获得西双版纳1990年、2000年和2010年3期的土地利用/土地覆被分类数据;从结构变化、类型变化、 空间变化3个角度,系统分析1990-2010年间西双版纳的土地利用/土地覆被时空变化规律,并对轮歇地、茶园和橡胶园3个典型地类进行了重点讨论。研 究表明:①西双版纳土地利用/土地覆被呈现以"林地-园地-耕地"为主导的地域结构特征,有林地是最为重要的土地覆被类型,橡胶园是最为主要的土地利用类 型;②1990-2010年间,土地利用/土地覆被变化速度呈加快趋势,土地利用强度呈增加趋势,近10年来则更为显著;③1990-2010年间,土地 利用/土地覆被变化的主要特征是有林地不断减少,橡胶园、旱地和茶园不断增加;有林地为面积减少最多的地类,橡胶园为面积增加最多的地类,轮歇地为增速最 快的地类,灌木林地为减速最快的地类;④1990-2010年间,土地利用/土地覆被类型发生转化的地类主要是轮歇地、灌木林地和有林地,主要的转化方向 是轮歇地向有林地和灌木林地转化,橡胶园和茶园的主要来源是有林地和灌木林;⑤1990-2010年间,土地利用/土地覆被空间变化较显著的地类是有林 地、灌木林地、橡胶园、茶园和轮歇地;有林地呈以减少为主要特征的"南退北进"的空间变化特征,灌木林地呈先增加后减少为主要特征的"西退东进、南退北 进"的空间变化特征,橡胶园呈以增加为主要特征的"以景洪市区为中心,北上南进,西拓东扩"的空间变化特征。

[ Liu X N, Feng Z M, Jiang L G, et al.Spatial-temporal pattern analysis of land use and land cover change in Xishuangbanna[J]. Resources Science, 2014,36(2):233-244. ]

[19]
刘晓娜. 中老缅交界地区土地利用/土地覆被变化研究[D].北京:中国科学院地理科学与资源研究所,2013.

[ Liu X N.Study on land use and land cover change in the boreder region of China, Laos, and Myanmar[D]. Beijing: Institute of Geography Science and Natural Resources Research, Chinese Academy of Sciences, 2013. ]

[20]
赵元茂,杞明辉.全球变化中的我国云南气候与生态响应[J].辽宁气象,2005,1(1):20-22.分析了全球变化背景下的我国云南气候、水土资源和生物多样性变化,评估了近50a云南气侠生态与环境的现状、变化和成因.在IPCC等相关工作的启示下,初步提出了云南生态环境建设与社会经济协调发展的对策与建议.

DOI

[ Zhao Y M, Qi M H.Climate and ecological response to global change in Yunnan Province[J]. Liaoning qixiang, 2005,1(1):20-22. ]

[21]
王瑞红,董慧秀.1950-2010年云南高原水资源利用与生态环境变迁[J].黑龙江史志,2014,1(6):65-70.云南和平解放后,按照国家水利 方针政策,云南省在农田水利、水力发电、水体养殖、水体旅游、生活及工业用水等方面进行了大力的开发利用和管理,促进了云南经济社会的较快发展。作为云南 省人口、工农业重心的云南高原分布有云南省大部分的水利工程,云南高原生态脆弱,水资源的过度开发和管理不善是造成区域水土流失、水体污染、生物减少和自 然灾害频繁的重要原因之一。生态环境的不断恶化给人们的生产生活带来严重威胁,自上世纪90年代起,云南高原不得不进行生态修复,并取得部分成效。

DOI

[ Wang R H, Dong H X.The use of water resources and the ecological environment change in yunnan plateau during 1950-2010[J]. Heilongjiang local Chronicles, 2014,1(6): 65-70. ]

[22]
云南省人民政府门户网. 云南省自然地理[EB/OL].2014..

[ People's government of Yunnan Province. Natural geography in Yunnan Province[EB/OL].2014. . ]

Outlines

/