
Journal of Geo-information Science >
Classification of MISR Multi-Angle Imagery Based on Decision Tree Classifier
Received date: 2015-08-24
Request revised date: 2015-11-15
Online published: 2016-03-10
Copyright
Accurately obtaining the land use and land cover information has been a hot research focus in the field of remote sensing. It is a feasible way to utilize the new remote sensing data source and the effective classification algorithms. In this study, five decision tree classifiers and the MISR multi-angle data have been implemented to study the land cover classification in the lower Tarim River. Six datasets of different bands and observation angles are classified and compared, and the findings are presented as follows: (1) Compared to the Nadir angle observation, the multi-angle observation can achieve higher classification accuracy and significantly improve the classification accuracy of the shrubs, woodland and grassland in particular. It showed that the multi-angle observation can effectively reveal the anisotropic feature of surface reflectance and get a better classification result. (2) Compared with the MLC method, the classification accuracy of the decision tree algorithms is higher, which is especially evident for the random forest and C5.0 methods, implying that the classification ability of decision tree is better than MLC and is more effective when using multi-angle datasets. (3) The classification effect of near infrared band is better than the red band, which indicates that the near infrared band can provide more information about the anisotropic feature of the surface reflectance.
Key words: land cover; MISR; multi-angle; decision tree; lower Tarim River
YANG Xuefeng , WANG Xuemei . Classification of MISR Multi-Angle Imagery Based on Decision Tree Classifier[J]. Journal of Geo-information Science, 2016 , 18(3) : 416 -422 . DOI: 10.3724/SP.J.1047.2016.00416
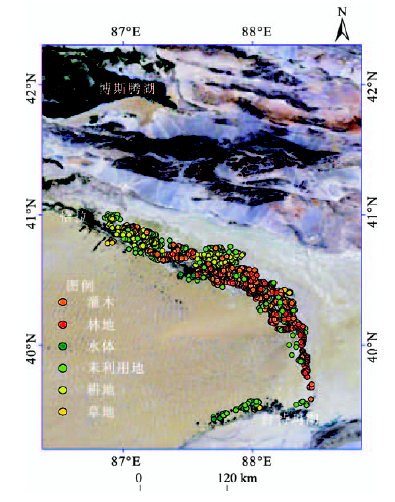
Tab.1 Land-cover and land-use classification system表1 土地利用/覆被类型体系 |
| 土地利用类型 | 样地数量/个 | 覆盖度/(%) | 描述 |
|---|---|---|---|
| 灌木 | 1888 | >5 | 灌木,半灌木植物群落 |
| 林地 | 1148 | >5 | 胡杨林 |
| 水体 | 95 | 0 | 水库,天然水体 |
| 未利用地 | 647 | <5 | 沙地,盐碱地 |
| 耕地 | 383 | >40 | 农田 |
| 草地 | 206 | >5 | 盐生草本植物群落 |
Tab.2 The band definition of MISR's nine cameras at the globe mode表2 MISR影像全球模式下各角度影像的波段分辨率定义 |
| 波段 | DF | CF | BF | AF | AN | AA | BA | CA | DA |
|---|---|---|---|---|---|---|---|---|---|
| NIR | 1.1 kmx1.1 km | 1.1 kmx1.1 km | 1.1 kmx1.1 km | 1.1 kmx1.1 km | 275 mx275 m | 1.1 kmx1.1 km | 1.1 kmx1.1 km | 1.1 kmx1.1 km | 1.1 kmx1.1 km |
| Red | 275 mx275 m | 275 mx275 m | 275 mx275 m | 275 mx275 m | 275 mx275 m | 275 mx275 m | 275 mx275 m | 275 mx275 m | 275 mx275 m |
| Blue | 1.1 kmx1.1 km | 1.1 kmx1.1 km | 1.1 kmx1.1 km | 1.1 kmx1.1 km | 275 mx275 m | 1.1 kmx1.1 km | 1.1 kmx1.1 km | 1.1 kmx1.1 km | 1.1 kmx1.1 km |
| Green | 1.1 kmx1.1 km | 1.1k mx1.1 km | 1.1 kmx1.1 km | 1.1 kmx1.1 km | 275 mx275 m | 1.1 kmx1.1 km | 1.1 kmx1.1 km | 1.1 kmx1.1 km | 1.1 kmx1.1 km |
Fig. 1 The distribution of test samples.图1 样点分布 |
Tab. 3 MISR multi-angle observation dataset表3 MISR多角度观测数据集 |
| 数据集 | 描述 |
|---|---|
| Nadir | AN相机的蓝,绿,红和近红外波段地表反射率数据 |
| Nadir plus ABCD Nir | AN相机的4个波段和A,B,C,D前后向相机的8个近红外波段地表反射率数据 |
| Nadir plus ABCD Red | AN相机的4个波段和A,B,C,D前后向相机的8个红光波段地表反射率数据 |
| Nadir plus ABCD Red and Nir | AN相机的4个波段和A,B,C,D前后向相机的8个红光及8个近红外波段地表反射率数据 |
| Nadir Nir plus ABCD Nir | AN相机的近红外波段和A,B,C,D前后向相机的8个近红外波段地表反射率数据 |
| Nadir Red plus ABCD Red | AN相机的红光波段和A,B,C,D前后向相机的8个红光波段地表反射率数据 |
Tab.4 The comparison of classification results between the Nadir datasets and multi-angle datasets表4 天底角观测数据集与多角度观测数据集的分类结果比较 |
| 分类算法 | Nadir | Nadir plus ABCD Red and Nir | ||
|---|---|---|---|---|
| 总体精度 | kappa系数 | 总体精度 | kappa系数 | |
| MLC | 0.6505 | 0.5260 | 0.7046 | 0.6020 |
| CART | 0.6935 | 0.5556 | 0.7261 | 0.6097 |
| J48 | 0.6845 | 0.5522 | 0.7476 | 0.6426 |
| C 5.0 | 0.7270 | 0.6089 | 0.8160 | 0.7359 |
| RF | 0.7323 | 0.6151 | 0.8114 | 0.7287 |
| LMT | 0.7025 | 0.5729 | 0.7649 | 0.6664 |
Tab. 5 The comparison of classification results between the Nadir plus Nir and the Nadir plus red multi-angle datasets表5 天顶角观测与多角度观测的红光和近红外组合数据集的分类结果比较 |
| 分类算法 | Nadir plus ABCD Nir | Nadir plus ABCD Red | ||
|---|---|---|---|---|
| 总体精度 | kappa系数 | 总体精度 | kappa系数 | |
| MLC | 0.6706 | 0.5566 | 0.6893 | 0.5858 |
| CART | 0.7323 | 0.6208 | 0.6942 | 0.5623 |
| J48 | 0.7406 | 0.6300 | 0.7011 | 0.5739 |
| C 5.0 | 0.8110 | 0.7301 | 0.7570 | 0.6504 |
| RF | 0.8336 | 0.7617 | 0.7718 | 0.6695 |
| LMT | 0.7469 | 0.6409 | 0.7483 | 0.6420 |
Tab.6 The comparison of classification results between Nir and red multi-angle datasets表6 红光和近红外波段多角度数据集的分类比较 |
| 分类算法 | Nadir Nir plus ABCD Nir | Nadir Red plus ABCD Red | ||
|---|---|---|---|---|
| 总体精度 | kappa系数 | 总体精度 | kappa系数 | |
| MLC | 0.5804 | 0.4473 | 0.6144 | 0.4986 |
| CART | 0.7517 | 0.6487 | 0.6609 | 0.5061 |
| J48 | 0.7469 | 0.6430 | 0.6616 | 0.5206 |
| C 5.0 | 0.8150 | 0.7349 | 0.7290 | 0.6106 |
| RF | 0.8218 | 0.7452 | 0.7531 | 0.6425 |
| LMT | 0.6498 | 0.4961 | 0.7004 | 0.5696 |
Tab.7 Confusion matrix of the random forest classification with Nadir dataset表7 随机森林使用Nadir数据集分类的混淆矩阵 |
| 类型 | 灌木 | 林地 | 水体 | 未利用地 | 耕地 | 草地 | 总数 | 用户精度 |
|---|---|---|---|---|---|---|---|---|
| 灌木 | 505 | 82 | 0 | 27 | 1 | 8 | 623 | 0.8106 |
| 林地 | 156 | 208 | 0 | 8 | 0 | 6 | 378 | 0.5503 |
| 水体 | 1 | 0 | 34 | 0 | 0 | 0 | 35 | 0.9714 |
| 未利用地 | 52 | 10 | 0 | 151 | 0 | 4 | 217 | 0.6959 |
| 耕地 | 1 | 0 | 0 | 1 | 129 | 0 | 131 | 0.9847 |
| 草地 | 14 | 7 | 0 | 6 | 2 | 29 | 58 | 0.5000 |
| 总数 | 729 | 307 | 34 | 193 | 132 | 47 | 1442 | |
| 生产者精度 | 0.6927 | 0.6775 | 1.0000 | 0.7824 | 0.9773 | 0.6170 | 0.7323 |
Tab.8 Confusion matrix of the random forest classification with "Nadir plus ABCD Nir" dataset表8 随机森林使用"Nadir plus ABCD Nir"数据集分类的混淆矩阵 |
| 类型 | 灌木 | 林地 | 水体 | 未利用地 | 耕地 | 草地 | 总数 | 用户精度 |
|---|---|---|---|---|---|---|---|---|
| 灌木 | 550 | 53 | 0 | 17 | 0 | 3 | 623 | 0.8828 |
| 林地 | 93 | 280 | 0 | 5 | 0 | 0 | 378 | 0.7407 |
| 水体 | 1 | 0 | 34 | 0 | 0 | 0 | 35 | 0.9714 |
| 未利用地 | 44 | 2 | 0 | 170 | 0 | 1 | 217 | 0.7834 |
| 耕地 | 2 | 0 | 0 | 0 | 129 | 0 | 131 | 0.9847 |
| 草地 | 8 | 7 | 0 | 4 | 0 | 39 | 58 | 0.6724 |
| 总数 | 698 | 342 | 34 | 196 | 129 | 43 | 1442 | |
| 生产者 精度 | 0.7880 | 0.8187 | 1.0000 | 0.8673 | 1.0000 | 0.9070 | 0.8336 |
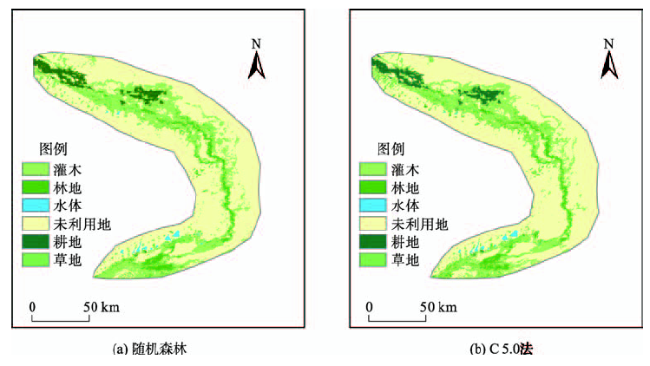
Fig. 2 Classification map obtained by random forest and C 5.0图2 随机森林和C 5.0法的分类结果 |
The authors have declared that no competing interests exist.
| [1] |
[
|
| [2] |
|
| [3] |
|
| [4] |
|
| [5] |
|
| [6] |
|
| [7] |
|
| [8] |
[
|
| [9] |
[
|
| [10] |
[
|
| [11] |
[
|
| [12] |
|
| [13] |
|
| [14] |
|
| [15] |
|
| [16] |
|
| [17] |
|
| [18] |
|
| [19] |
|
| [20] |
[
|
| [21] |
[
|
| [22] |
|
| [23] |
|
| [24] |
|
| [25] |
|
| [26] |
[
|
| [27] |
Exelis. ENVI Homepage[EB/OL]. , 2014-10-1.
|
| [28] |
|
| [29] |
Machine Learning Group at the University of Waikato. WEKA Homepage[EB/OL]. , 2013-3-28.
|
/
| 〈 |
|
〉 |