Orginal Article

Comparison Between the Two Near Infrared Bands of WorldView-2 Imagery in Their Applications in Pinus Massoniana Forest

  • HU Xiujuan ,
  • XU Hanqiu , * ,
  • HUANG Shaolin ,
  • ZHANG Can ,
  • TANG Fei
Expand
  • 1. College of Environment and Resources, Fuzhou University, Fuzhou 350116, China
  • 2. Institute of Remote Sensing Information Engineering, Fuzhou University, Fuzhou 350116, China
  • 3. Fujian Provincial Key Laboratory of Remote Sensing of Soil Erosion and Disaster Protection, Fuzhou University, Fuzhou 350116, China
*Corresponding author: XU Hanqiu, E-mail:

Received date: 2015-06-11

  Request revised date: 2015-08-13

  Online published: 2016-04-19

Copyright

《地球信息科学学报》编辑部 所有

Abstract

Since its launch in 2009, the WorldView-2 satellite has provided a large amount of high-quality images to the world. The WorldView-2 has two near infrared spectral bands NIR1 and NIR2, which make it different from the numerous other previously launched satellite sensor data. Up to date, however, the differences between the two NIR bands in applications are not clear. Therefore, taking Pinus Massoniana forest in the Changting county of Fujian, China as an example, this paper utilized the two NIR bands respectively to compute three vegetation indices, which are the Normalized Difference Vegetation Index (NDVI), the Atmospherically Resistant Vegetation Index (ARVI), and the Normalized Difference Mountain Vegetation Index (NDMVI), to explore the differences between the two bands in the retrieval of vegetation information. The results show that the accuracy of the extracted Pinus Massoniana information using the indices derived from the NIR1 band is always higher than that derived from the NIR2, and the NIR1-derived indices can gain more vegetation information than the NIR2-derived indices, which is 8.0% higher in NDVI, 12.3% higher in ARVI, and 7.3% higher in NDMVI, respectively. As for the retrieval of fractional vegetation coverage, NIR1 also show a higher accuracy than NIR2, as it shows a higher degree of agreement and lower root mean square error when compared with the actual fractional vegetation coverage. The performance differences between the two NIR bands are caused by the higher reflection rate of Pinus Massoniana in NIR1 wavelength than in the NIR2 spectral range.

Cite this article

HU Xiujuan , XU Hanqiu , HUANG Shaolin , ZHANG Can , TANG Fei . Comparison Between the Two Near Infrared Bands of WorldView-2 Imagery in Their Applications in Pinus Massoniana Forest[J]. Journal of Geo-information Science, 2016 , 18(4) : 537 -543 . DOI: 10.3724/SP.J.1047.2016.00537
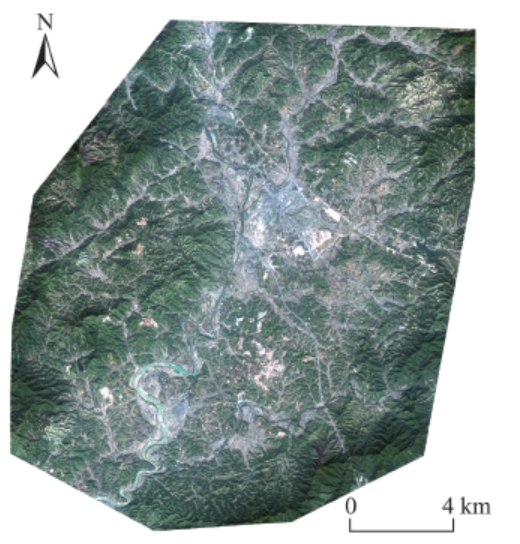
1 引言

地表植被通过遥感数据可反演出各种重要参数,以监测其变化与规律。WorldView-2卫星发射于2009年10月6日,是该系列卫星中第一个搭载多光谱传感器的卫星,且比WorldView-1具备更高的空间分辨率。WorldView-2的全色和多光谱影像的分辨率分别达到了0.5 m和2.0 m。与众多高分辨率卫星波段设置不同,WorldView-2有2个近红外波段,即近红外1(Near-infrared 1,NIR1)和近红外2(Near-infrared 2,NIR2)。近红外波段是植被指数计算、植被信息反演的最重要波段,但目前对WorldView-2中NIR1和NIR2波段在植被信息反演方面所表现出的差异还有待深入研究。
Kumar等在提取不透水面和植被时,认为用NIR2计算NDVI(Normalized Difference Vegetation Index)比NIR1能更明显地区分植被[1]。Pu和Landry利用WorldView-2和IKONOS影像识别城市中的树种后指出,采用NIR2可取得更好的植被分类结 果[2]。Belgiu等针对Kumar和Pu的结论测试了这些波段,但并没有发现NIR2波段的优势,仍选取NIR1波段计算植被指数[3]。凌成星等利用WorldView-2影像估算东洞庭湖湿地区域的植被覆盖度,并采用NIR2计算NDVI,认为其可以增强植被信息特征,拉伸植被光谱敏感区间[4]。陈利等利用WorldView-2影像监测外来物种薇甘菊的入侵,采用NIR1波段来组成识别薇甘菊的最佳波段组合[5]
从上述已有的WorldView-2植被应用研究来看,有的选用NIR1波段,也有的选用NIR2波段,但这些研究大多都是直接选定NIR1或NIR2波段来进行研究,并未在这2个波段比较分析的基础上做出选择,因此有必要对WorldView-2的这2个近红外波段进行定量比较。鉴于马尾松是中国南方湿润地区典型的针叶乡土树种,也是南方红壤水土流失区的主要造林树种[6],对区域生态系统有重要影响。因此,选取福建省长汀县河田地区的马尾松林为实验对象,通过定量分析和对比,揭示NIR1和NIR2波段在马尾松植被信息反演上的差异,以便更有效地利用WorldView-2高分辨率影像来精准反演马尾松林的信息。

2 实验方法

2.1 实验区与实验数据

本研究以福建省长汀县河田地区为实验区,总面积297.39 km2(图1)。实验区中心是一凹陷地形,四周群山环抱,表现为盆地地貌特征。植被覆盖类型主要为马尾松林,占实验区森林总面积的86.1%。实验选用WorldView-2卫星影像(表1),日期为2011年12月13日11时9分5秒,影像无云覆盖,质量较好。
Fig. 1 Map of the study area

图1 实验区范围

Tab. 1 Parameters of the WorldView-2 image

表1 WorldView-2卫星主要参数

波段 波长/nm 空间分辨率/m
海岸
401~453
447~508
2.0
绿


红边
近红外1
近红外2
全色
511~581
588~627
629~689
704~744
772~890
860~1040
464~801
0.5

2.2 数据预处理

采用WorldView-2官方手册提供的模型对影像进行辐射校正[7]
首先,将影像中每个像元的灰度值(DN)转换成其在传感器处的光谱辐射值Lλ,其计算公式为式(1)。
L λ = K q Δλ (1)
式中:K为每个波段的绝对辐射校正因子;q为像元的DN值;Δλ为波段λ的有效带宽。K和Δλ可从影像的头文件中获取。
其次,将大气顶部光谱辐射值转换为传感器处的反射率,其计算公式为式(2)。
ρ λ = L λ d ES 2 π Esu n λ cos θ S (2)
式中:dES为日地距离;Esunλ为波段λ的平均太阳光谱辐照度,可在其官方手册中查到;θs为太阳天顶角,可从影像头文件中获取; π 为常数。
最后,采用Chavez的COST模型[8]进行大气校 正[9],其计算公式为式(3)。
ρ λ = L λ - L h d ES 2 π Esu n λ cos θ S τ (3)
式中:Lh为大气影响的修正值,即各波段对应的最暗像元在传感器处的光谱辐射值;τ为大气透射率,其计算公式为式(4)。
τ = co s θ S π 180 (4)

2.3 植被指数计算

根据实验区和影像的特点,本次实验选取了以下3种植被指数。
(1) 归一化植被指数(NDVI)
在众多的植被指数中,Rouse等提出的归一化植被指数NDVI [10]的应用最广泛,通常被作为监测区域乃至全球植被和生态变化的重要指标。其计算公式为式(5)。
NDVI = ρ NIR - ρ R ρ NIR + ρ R (5)
式中:ρNIR表示近红外波段的传感器处反射率;ρR为红光波段的传感器处反射率。
(2) 大气修正植被指数(ARVI)
Kanfman和Janre提出了大气阻抗植被指数(Atmospherically Resistant Vegetation Index,ARVI)[11],该指数根据蓝光与红光对大气响应的差异,用红蓝波段组合替代了NDVI的红光波段,以减少大气对植被指数的影响。其计算公式表示为式(6)。
ARVI = ρ NIR - 2 ρ R - ρ B ρ NIR + 2 ρ R - ρ B (6)
式中:ρB为蓝光波段的传感器处反射率。
(3) 归一化差值山地植被指数(NDMVI)
归一化差值山地植被指数(Normalized Difference Mountain Vegetation Index,NDMVI)由吴志杰和徐涵秋提出,它通过同时降低近红外波段和红光波段反射率的方法来消除或抑制地形的影响[12]。由于实验区四面环山,地形起伏大,因此采用该指数以削弱山体阴影对植被信息的影响有较大的帮助。其计算公式为式(7)。
NDMVI = ρ NIR - ρ R + R min - NI R min ρ NIR + ρ R - R min + NI R min (7)
式中:Rmin为红光波段反射率最小值;NIRmin为近红外波段反射率最小值。

2.4 植被覆盖度的反演

实验区植被覆盖度的反演采用的是Gutman和Ignatov的模型(简称Gutman模型)[13],其表达式为 式(8)。
FVC = NDVI - NDV I min NDV I max - NDV I min (8)
式中:NDVImin代表纯裸土像元的NDVI值;NDVImax代表纯植被覆盖像元的NDVI值。

2.5 精度验证

2.5.1 植被信息提取精度验证
对上述3种植被指数计算公式中的ρNIR分别用ρNIR1和ρNIR2代入,反演出对应的NDVI、ARVI和NDMVI影像。对各植被指数影像进行统计,获得它们的直方图和统计参数,然后在直方图上通过目视判读和人工调试获得最佳阈值,提取出植被信息。为了保证结果的准确性,本文采用同期的全色影像与多光谱影像融合获得0.5 m的高分辨率融合影像,对植被提取结果进行精度验证,共随机选取了400个验证点。
2.5.2 植被覆盖度精度验证
分别用NIR1和NIR2构建的植被指数利用式(8)计算出各自的植被覆盖度。精度验证采用基于高分辨率影像的亚像元对比法。该方法不仅能检验精度,还可将模型求出的植被覆盖度和实际植被覆盖度关联起来[14]。考虑到统计的准确性和实际条件的限制[15],在所获得的植被覆盖度影像中随机选取100个样区,每个样区大小为10像元×10像元;再将各个样区覆盖到0.5 m高分辨率融合影像上,并对每个样区进行人工数字化,计算出高分辨率融合影像中每个样区的实际植被覆盖度;然后与所求出的植被覆盖度进行回归分析,并进一步计算二者的均方根误差RMSE(Root Mean Square Error),以考察模型计算的植被覆盖度精度。RMSE计算公式为式(9)。
RMSE = i = 1 n X i - Y i 2 n 1 2 (9)
式中:Xi是模型估算的植被覆盖度;Yi是实际的植被覆盖度;n为样本数。

3 结果与分析

3.1 波段和指数的比较

就NIR1和NIR2波段本身而言(表2),无论是动态范围、均值或标准差,NIR1波段的值都要高于NIR2波段(动态范围高出15.6%,均值高出11.5%,标准差高出12.9%)。这表明NIR1波段所获得的信息量比NIR2波段更丰富[16]
Tab. 2 Statistics of the two NIR bands

表2 2个近红外波段的统计特征参数

波段 动态范围 均值 标准差
NIR1 0.493(0.003~0.496) 0.183 0.070
NIR2 0.416(0.006~0.422) 0.162 0.061
Tab. 3 The mean values of three vegetation indices

表3 2个近红外波段构建的3种植被指数的均值

波段 NDVI ARVI NDMVI
NIR1 0.513 0.382 0.551
NIR2 0.472 0.335 0.511
为了进一步考察这2个NIR波段及其构成的3个植被指数之间的数据变化规律,采用35×35网格在全影像上共选取了68 856个像元作为统计样本,然后将它们投影到二维光谱散点空间,并对散点进行拟合。由图2可看出,NIR1和NIR2波段的散点分布虽然都靠近1:1线,但随着NIR1波段值的升高,光谱的散点群分布逐渐往下偏离1:1线(图2(a)),这说明了NIR1波段的值高于NIR2波段,且在中高值区表现得更为明显。由2个近红外波段分别构建的3种植被指数的散点图中(图2(b)-(d)),散点基本沿1:1线分布,但仍然可看出散点多分布在1:1线下方,表明以NIR1构建的植被指数所获取的植被信息要比NIR2更多[16]
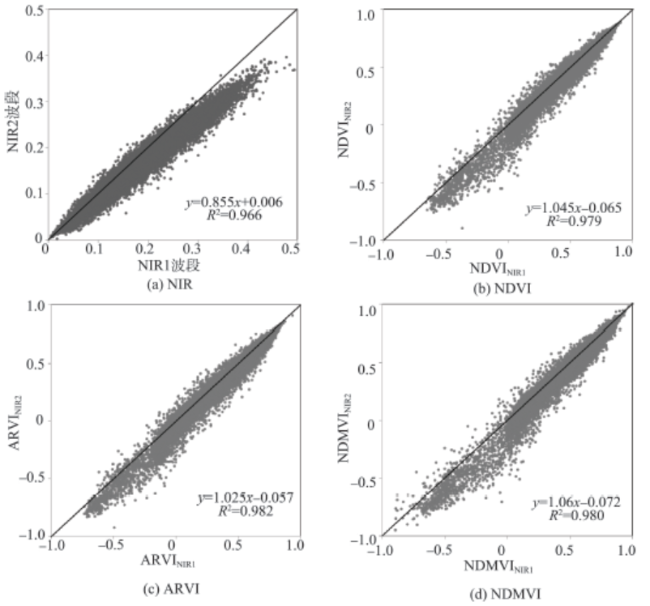
Fig. 2 Scatter plots of NIR1 and NIR2 bands and their derived vegetation indices

图2 NIR1和NIR2及其构建的3种植被指数

3.2 植被提取精度的比较

表4可看出,采用WorldView-2影像提取植被可以获得很高的精度。无论是用NIR1还是NIR2波段,总体精度都在92%以上,Kappa系数也都大于0.82。但在3种植被指数中,NIR1提取植被的精度都要比NIR2高出1.5~2.3个百分点。
Tab. 4 Accuracy validation results of vegetation extraction

表4 植被提取精度验证表

植被指数 阈值 参考数据 行像元
总数
使用者
精度/(%)
植被 非植被
NDVINIR1 0.38
植被 281 8 289 97.23
非植被 14 97 111 87.39
列像元总数 295 105 400
生产者精度/(%) 95.25 92.38
总体精度/(%) 94.50
Kappa系数 0.861
NDVINIR2 0.35
植被 270 5 275 98.18
非植被 24 101 125 80.80
列像元总数 294 106 400
生产者精度/(%) 90.57 87.63
总体精度/(%) 92.75
Kappa系数 0.824
ARVINIR1 0.34
植被 267 6 273 97.80
非植被 9 118 127 92.91
列像元总数 276 124 400
生产者精度/(%) 96.74 95.16
总体精度/(%) 96.25
Kappa系数 0.913
ARVINIR2 0.30
植被 260 7 267 97.38
非植被 17 116 133 87.22
列像元总数 277 123 400
生产者精度/(%) 93.86 94.31
总体精度 94.00
Kappa系数 0.862
NDMVINIR1 0.51
植被 261 3 264 98.86
非植被 6 130 136 95.59
列像元总数 267 133 400
生产者精度/(%) 97.75 97.74
总体精度/(%) 97.75
Kappa系数 0.950
NDMVINIR2 0.46
植被 252 3 255 98.82
非植被 12 133 145 91.72
列像元总数 264 136 400
生产者精度/(%) 95.45 97.79
总体精度/(%) 96.25
Kappa系数 0.918

3.3 植被覆盖度的对比分析

图3表明,采用NIR1构建的植被指数计算的植被覆盖度的精度要高于NIR2。由NIR1模拟的植被覆盖度和实际的植被覆盖度的拟合程度(R2)都明显优于NIR2,而均方根误差(RMSE)要小于NIR2。
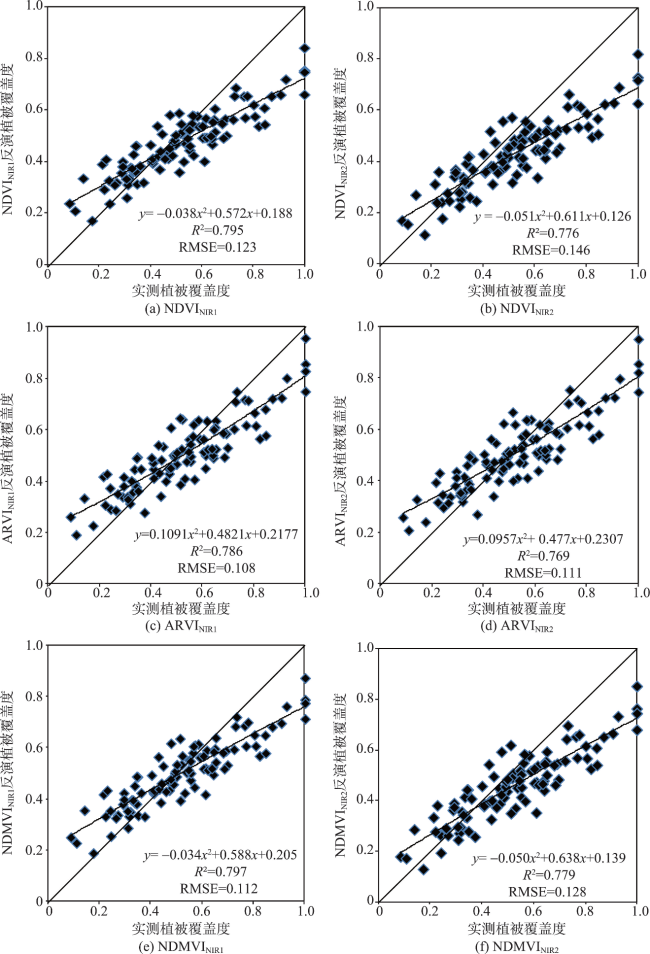
Fig. 3 Accuracy comparison between the actual fractional vegetation coverage and the simulated fractional vegetation coverage derived from NIR1 and NIR2 bands respectively

图3 3种植被指数模型反演的植被覆盖度与实际植被覆盖度的比较

上述实验结果表明,WorldView-2的NIR1和NIR2波段所构建的植被指数在马尾松提取和植被覆盖度的反演方面,仍表现出一定的差异。无论是植被信息的提取还是植被覆盖度的反演,NIR1的精度均高于NIR2,这显然与表2揭示的NIR1波段具有较高的信息量密切相关,且这一优势在NIR1的中、高值区(代表马尾松林植被覆盖较高的地区)表现得更为明显(图2(b)-(d)),这对马尾松林植被信息的反演有很大的帮助。
图4是实验区马尾松的光谱曲线在NIR1和NIR2近红外波长范围的变化特征。由图4可看出,马尾松的光谱曲线在NIR1光谱范围内,表现得较为平滑且略有上升,而在NIR2波长范围内,特别是与NIR1不重叠的区间,马尾松的光谱曲线则有一定的下降,且在922 nm处有一小的下降陡坎。Jensen认为[17],在近红外的波长范围内(700~1200 nm),植被遥感的最佳区域是在740~900 nm之间,而这一区间正好是NIR1波段所在的波长范围。在其后的900~1200 nm区间,由于在920~980 nm范围内出现了水汽吸收带,导致了植物反射率的下降,而这一波长范围则是NIR2波段所在位置,这说明了NIR1比NIR2具有更丰富信息量。
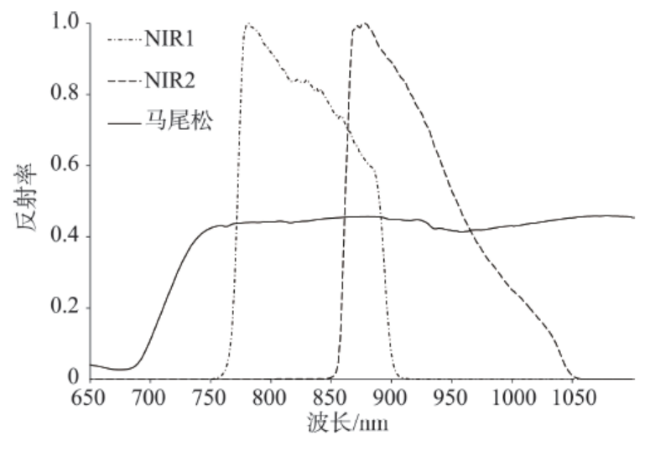
Fig. 4 In situ measured signature of Pinus Massoniana and the relative spectral response functions of two near infrared bands

图4 马尾松实测光谱曲线与WorldView-2的两个近红外波段光谱的响应函数

4 结论

近红外光谱波段是研究植被的最关键波段,它直接影响到植被信息反演的准确性。为了精确地提取马尾松植被信息,本文探讨了WorldView-2影像的2个近红外波段在马尾松林区的应用。通过定量分析发现,二者在马尾松林植被反演上存在一定的差异。采用NIR1波段构成的植被指数无论是提取植被信息还是反演植被覆盖度方面,其精度均高于NIR2波段,二者所表现出的差异主要是由马尾松在它们之间的光谱响应差异造成。由于马尾松的反射率在NIR1的光谱波长范围内达到最大值,而在NIR2的波长范围内则有所降低,故使得NIR1可获得比NIR2更丰富的植被信息。实验结果可为今后科学地应用WorldView-2的近红外光谱,以及有效地提取马尾松植被信息提供科学依据。

The authors have declared that no competing interests exist.

[1]
Kumar A, Pandey A C, Jeyaseelan A T.Built-up and vegetation extraction and density mapping using WorldView-II[J]. Geocarto International, 2012,27(7):557-568.ABSTRACT This study demonstrates the use of high resolution WorldView-II satellite data in extraction of built-up land and vegetation using normalized index techniques. The PCA 1 and NIR 2 bands-based built-up index was proposed for extracting built-up land, which exhibit high accuracy. The normalized difference vegetation index based on Red Edge and NIR 2 bands of WorldView-II produced high accuracy inthe estimation of vegetation compared to the use of Red and NIR bands. The grid technique used in estimating built-up and vegetation density from precisely classified images provided better and accurate assessment of built-up and vegetation density in heterogeneous landscape of urban areas. This shows areas of very high to high built-up density are located in the central, western and southern parts, which are primarily devoid of vegetation. This study indicates possibilities of utilizing high resolution satellite data in urban landscape characterization using a grid-based technique.

DOI

[2]
Pu R, Landry S.A comparative analysis of high spatial resolution IKONOS and WorldView-2 imagery for mapping urban tree species[J]. Remote Sensing of Environment, 2012,124:516-533.Urban forest tree species mapping has benefitted from advances in remote sensing techniques. In this study, we explored the potential of the newly developed high resolution satellite sensor, WorldView-2 (WV2) imagery for identifying and mapping urban tree species/groups in the City of Tampa, FL, USA by comparing capabilities between high resolution IKONOS (IKO, acquired on April 6, 2006) and WV2 (acquired on May 1, 2011) imagery for identifying the urban tree species. Seven urban tree species/groups were mapped, including: sand live oak ( Quercus geminata ), laurel oak ( Q. laurifolia ), live oak ( Q. virginiana ), pine (species group), palm (species group), camphor ( Cinnamomum camphora ), and magnolia ( Magnolia grandiflora ). Image-objects (IOs) were used as the tree species mapping unit. A stepwise masking protocol was developed to separate sunlit and shadow/shaded tree canopy IOs from the study area prior to tree species mapping. Comparative analyses examined average accuracies of tree species mapping results between four-band IKO imagery and three different band combinations of WV2 imagery: four “traditional” bands, four additional bands, and all eight bands. Linear Discriminant Analysis and Classification and Regression Trees were used to classify IOs using selected IO features derived from IKO and band combinations of WV2 imagery. With the exception of sand live oak mapping result (due to phenological difference due to image collection dates), validation results indicate significantly improved mapping accuracies using all combinations of WV2 imagery (p02<020.01). Results using independent validation samples demonstrated that average accuracy was increased by 16–18% using WV2 imagery compared to that using IKO imagery when considering mapping 6-species/group. Improved results with the WV2 sensor could be attributed to improved spatial resolution (402m to 202m) and additional bands (coastal, yellow, red-edge and NIR2).

DOI

[3]
Belgiu M, Drǎguţ L, Strobl J.Quantitative evaluation of variations in rule-based classifications of land cover in urban neighbourhoods using WorldView-2 imagery[J]. ISPRS Journal of Photogrammetry and Remote Sensing, 2014,87:205-215.The increasing availability of high resolution imagery has triggered the need for automated image analysis techniques, with reduced human intervention and reproducible analysis procedures. The knowledge gained in the past might be of use to achieving this goal, if systematically organized into libraries which would guide the image analysis procedure. In this study we aimed at evaluating the variability of digital classifications carried out by three experts who were all assigned the same interpretation task. Besides the three classifications performed by independent operators, we developed an additional rule-based classification that relied on the image classifications best practices found in the literature, and used it as a surrogate for libraries of object characteristics. The results showed statistically significant differences among all operators who classified the same reference imagery. The classifications carried out by the experts achieved satisfactory results when transferred to another area for extracting the same classes of interest, without modification of the developed rules.

DOI PMID

[4]
凌成星,张怀清,鞠洪波,等.基于Worldview-2数据的东洞庭湖湿地区域植被覆盖度估算研究[J].科学技术与工程,2012,20(29):7515-7520.利用Worldview-2卫星数据八波段多光谱数据特点,分析 与近红外波段重叠并具有更高信息量的近红外2新波段特征构建植被指数(Ⅵ)的关系.以湖南东洞庭湖湿地区域为研究区,建立近红外2新波段参与的归一化植被 指数( NDVI)植被覆盖度估算模型.通过与实测样点结果比较发现:近红外2波段参与改良后的NDVI法的估算结果与实测值验证结果更加匹配,精度达到 87.8%;原始近红外波段参与的NDVI法的估算结果精度最低.研究表明运用Worldview-2数据,并采用改良后的NDVI法可以大区域、准确、 快速的进行植被覆盖度估算.

DOI

[ Ling C X, Zhang H Q, Ju H B, et al.Research on vegetation fractional coverage estimation of east Dongting lake wetland area based on Worldview-2 satellite data[J]. Science Technology and Engineering, 2012,20(29):7515-7520. ]

[5]
陈利,林辉,孙华.基于WorldView-2影像的外来物种薇甘菊入侵遥感监测[J].浙江农林大学学报,2014,31(2):185-189.为了探究利用高分辨率影像进行 外来物种薇甘菊Mikania micrantha遥感监测,以WorldView-2影像为数据源,利用面向对象的分类方法,对深圳市薇甘菊进行遥感监测。研究结果表明:利用 WorldView-2影像进行薇甘菊的最佳波段组合为364波段(近红外波段、海岸波段、红色波段),薇甘菊的制图精度为83.33%,用户精度为 81.08%,总体精度为87.5%,且其他地物类型的分类精度也比较高,都达到80%以上,取得较好的监测结果,突破了人工调查周期长,主观性强等缺 点,在监测手段、方法以及时间上更加具有优势。因此,基于WorldView-2影像面向对象方法进行薇甘菊遥感信息提取具有良好的应用价值。

DOI

[ Chen L, Lin H, Sun H.Remote sensing of a Mikania micrantha invasion in alien species with WordView-2 images[J]. Journal of Zhejiang A&F University, 2014,31(2):185-189. ]

[6]
吕茂奎,谢锦升,周艳翔,等.红壤侵蚀地马尾松人工林恢复过程中土壤非保护性有机碳的变化[J].应用生态学报,2014,25(1):37-44.选择红壤侵蚀区本底条件相似而 恢复年限不同的马尾松林为对象,以侵蚀裸地和次生林为对照,结合时空代换法对侵蚀地植被恢复过程中表层土壤非保护性有机碳(轻组有机碳和颗粒有机碳)含 量、分配比例及其向保护性有机碳转化过程进行研究.结果表明:在植被恢复过程中(0~30年)土壤有机碳含量及其储量随恢复年限极显著增加.植被恢复 7~11年,土壤非保护性有机碳含量显著增加,其分配比例也明显升高,而恢复至27年和30年后分配比例保持在较稳定水平,说明植被恢复初始过程主要以非 保护性有机碳的形式积累,而长期恢复后土壤有机碳呈相对稳定状态;0~10 cm和10~20 cm土壤非保护性有机碳向保护性有机碳的转化速率常数(k)与恢复年限分别呈极显著相关和显著相关,说明植被恢复过程中土壤非保护性有机碳逐渐向保护性有 机碳转化.

[ Lv M K, Xie J S, Zhou Y X, et al.Dynamics of unprotected soil organic carbon with the restoration process of Pinus massoniana plantation in red soil erosion area[J]. Chinese Journal of Applied Ecology, 2014,25(1):37-44. ]

[7]
Updike T, Comp C.Radiometric use of WorldView-2 imagery[R]. Digital Globe, 2010.

[8]
Chavez P S Jr. Image-based atmospheric corrections-revisited and improved[J]. Photogrammetric Engineering and Remote Sensing, 1996,62(9):1025-1036.ABSTRACT A major benefit of multitemporal, remotely sensed images is their applicability to change detection over time.(...) However, to maximize the usefulness of data from multitemporal point of view, an easy-to-use, cost-efective, and accurate radiometric calibration and correction procedure is needed.

DOI

[9]
Ramsey R D, Wright D L Jr, Mc Ginty C. Evaluating the use of Landsat 30m enhanced thematic mapper to monitor vegetation cover in shrub-steppe environments[J]. Geocarto International, 2004,19(2):39-47.0.92, p < .01). Correlations between percent vegetation cover estimates versus ETM individual reflective bands and NDVI showed little relationship between vegetation cover and the NIR (band 4) but a strong relationship with NDVI for this semi‐arid landscape. Remote sensing information may be the key for public and private land mangers to make optimal economic and environmental decisions regarding use of state, public, and private rangelands.

DOI

[10]
Rouse Jr J W, Haas R H, Schell J A, et al. Monitoring vegetation systems in the Great Plains with ERTS[C]. Proceedings of Third ERTS symposium, 1974:351-309.

[11]
Kaufman Y J, Tanre D.Atmospherically resistant vegetation index (ARVI) for EOS-MODIS[J]. IEEE Transactions on Geoscience and Remote Sensing, 1992,30(2):261-270.In this paper atmospherically resistant vegetation index (ARVI) is proposed and developed to be used for remote sensing of vegetation from the earth Observing System (EOS) MODIS sensor. The same index can be used for remote sensing from Landsat TM, and the EOS-HIRIS sensor. The index takes advantage of the presence of the blue channel in the MODIS sensor, in addition to the red and the near IR channels that compose the present normalized difference vegetation index (NDVI). The resistance of the ARVI to atmospheric effects (in comparison to the NDVI) is accomplished by a self-correction process for the atmospheric effect on the red channel, using the difference in the radiance between the blue and the red channels to correct the radiance in the red channel. Simulations using radiative transfer computations on arithmetic and natural surface spectra, for various atmospheric conditions, show that ARVI has a similar dynamic range to the NDVI, but is, on average, four times less sensitive to atmospheric effects that the NDVI. The improvement is much better for vegetated surfaces than for soils. It is much better for moderate to small size aerosol particles (e.g., continental, urban, or smoke aerosol) than for large particle size (e.g., more&raquo; maritime aerosol or dust). 芦less

DOI

[12]
吴志杰,徐涵秋.卫星影像数据构建山地植被指数与应用分析[J].地球信息科学学报,2011,13(5):656-664.本研究以Landsat影像为数据源,在分析复杂地形山地植被在阳坡和阴坡反射率差异特征的基础上,提出一种归一化差值山地植被指数NDMVI(Normalized Difference Mountain Vegetation Index)。该指数模型无需辅助数据(如DEM)的支持,通过同时降低近红外波段(TM4)和红光波段(TM3)反射率的方法来消除或抑制地形的影响,具有较强的可操作性。研究表明:NDMVI与太阳入射角余弦值(cosi)的相关性相当小,对地形起伏变化表现不敏感,可有效消除或抑制地形的影响;比NDVI值动态变化范围更宽,对地物有更强的遥感识别能力;该模型抑制地形影响的效果比用C校正模型的效果更佳,不会出现过度校正的问题。

DOI

[ Wu Z J, Xu H Q.A new index for vegetation enhancements of mountainous regions based on satellite image data[J]. Journal of Geo-Information Science, 2011,13(5):656-664. ]

[13]
Gutman G, Ignatov A.The derivation of the green vegetation fraction from NOAA/AVHRR data for use in numerical weather prediction models[J]. International Journal of Remote sensing, 1998,19(8):1533-1543.Fraction of green vegetation, fg, and green leaf area index, Lg, are needed as a regular space-time gridded input to evapotranspiration schemes in the two National Weather Service (NWS) numerical prediction models regional Eta and global medium range forecast. This study explores the potential of deriving these two variables from the NOAA Advanced Very High Resolution Radiometer (AVHRR) normalized difference vegetation index (NDVI) data. Obviously, one NDVI measurement does not allow simultaneous derivation of both vegetation variables. Simple models of a satellite pixel are used to illustrate the ambiguity resulting from a combination of the unknown horizontal (fg) and vertical (Lg) densities. We argue that for NOAA AVHRR data sets based on observations with a spatial resolution of a few kilometres the most appropriate way to resolve this ambiguity is to assume that the vegetated part of a pixel is covered by dense vegetation (i.e., its leaf area index is high), and to calculate fg=(NDVI-NDVI0)/(NDVI8-NDVI0), where NDVIo (bare soil) and NDVI (dense vegetation) are specified as global constants independent of vegetation/soil type. Global (0.15o)2 spatial resolution monthly maps of fg were produced from a 5-year NDVI climatology and incorporated in the NWS models. As a result, the model surface fluxes were improved.

DOI

[14]
Wu C, Murray A T.Estimating impervious surface distribution by spectral mixture analysis[J]. Remote sensing of Environment, 2003,84(4):493-505.Estimating the distribution of impervious surface, a major component of the vegetation–impervious surface–soil (V–I–S) model, is important in monitoring urban areas and understanding human activities. Besides its applications in physical geography, such as run-off models and urban change studies, maps showing impervious surface distribution are essential for estimating socio-economic factors, such as population density and social conditions. In this paper, impervious surface distribution, together with vegetation and soil cover, is estimated through a fully constrained linear spectral mixture model using Landsat Enhanced Thematic Mapper Plus (ETM+) data within the metropolitan area of Columbus, OH in the United States. Four endmembers, low albedo, high albedo, vegetation, and soil were selected to model heterogeneous urban land cover. Impervious surface fraction was estimated by analyzing low and high albedo endmembers. The estimation accuracy for impervious surface was assessed using Digital Orthophoto Quarterquadrangle (DOQQ) images. The overall root mean square (RMS) error was 10.6%, which is comparable to the digitizing errors of DOQQ images. Results indicate that impervious surface distribution can be derived from remotely sensed imagery with promising accuracy.

DOI

[15]
Wu C.Normalized spectral mixture analysis for monitoring urban composition using ETM+ imagery[J]. Remote Sensing of Environment, 2004,93:480-492.

[16]
徐涵秋,张铁军.ASTER与Landsat ETM+植被指数的交互比较[J].光谱学与光谱分析,2011,31(7):1902-1907.在中尺度对地观测系统中,Landsat和ASTER数据无疑是使用得最多的遥感影像数据, 但是长期以来二者植被指数之间的定量关系并不清楚。因此,利用三对同日过空的Landsat ETM+和ASTER影像来考察二者植被指数(NDVI、SAVI)之间的定量关系,重点查明二者之间的差异。通过将ETM+与ASTER影像的多光谱波 段的灰度值转换成传感器处反射率,并对其进行回归分析来求出二者植被指数之间的定量关系和转换方程。研究发现,尽管ETM+与ASTER的植被指数之间具 有显著的线性正相关关系,但是二者在光谱响应函数上的不同造成ASTER影像的植被指数信号总体上弱于EMT+的植被指数信号。利用所求的转换方程对两种 传感器的植被指数进行互为转换,其转换的精度较高,RMSE都小于0.04。

DOI

[ Xu H Q, Zhang T J. Cross comparison of ASTER and Landsat ETM+ multispectral measurements for NDVI and SAVI vegetation indices[J]. Spectroscopy and Spectral Analysis, 2011,31(7):1902-1907. ]

[17]
Jensen J R, Lulla K.Introductory digital image processing: a remote sensing perspective, 3/e[M]. Upper Saddle River: Prentice-Hall Inc, 2005.

Outlines

/